NDVI in Remote Sensing: Understanding the Full Form, Meaning, and Importance for Precision Agriculture
In the ever-evolving world of precision agriculture, remote sensing technologies have become indispensable tools for farmers and agronomists alike. Among these technologies, one stands out as a crucial indicator of crop health and vegetation vigor: NDVI. In this comprehensive guide, we’ll delve deep into the world of NDVI, exploring its full form, meaning, and significance in remote sensing and precision agriculture.
What is NDVI in Remote Sensing?
NDVI, which stands for Normalized Difference Vegetation Index, is a widely used remote sensing indicator that helps assess the health and density of vegetation in a given area. But what exactly does NDVI mean in remote sensing, and how does it work?
To understand NDVI, we first need to grasp its full form in remote sensing:
- N – Normalized
- D – Difference
- V – Vegetation
- I – Index
NDVI is a mathematical calculation that uses the visible and near-infrared light reflected by vegetation to assess its health and density. Healthy vegetation absorbs most of the visible light that hits it and reflects a large portion of near-infrared light. Unhealthy or sparse vegetation, on the other hand, reflects more visible light and less near-infrared light.
The Science Behind NDVI
To truly understand the NDVI meaning in remote sensing, we need to dive into the science behind it. NDVI is calculated using the following formula:
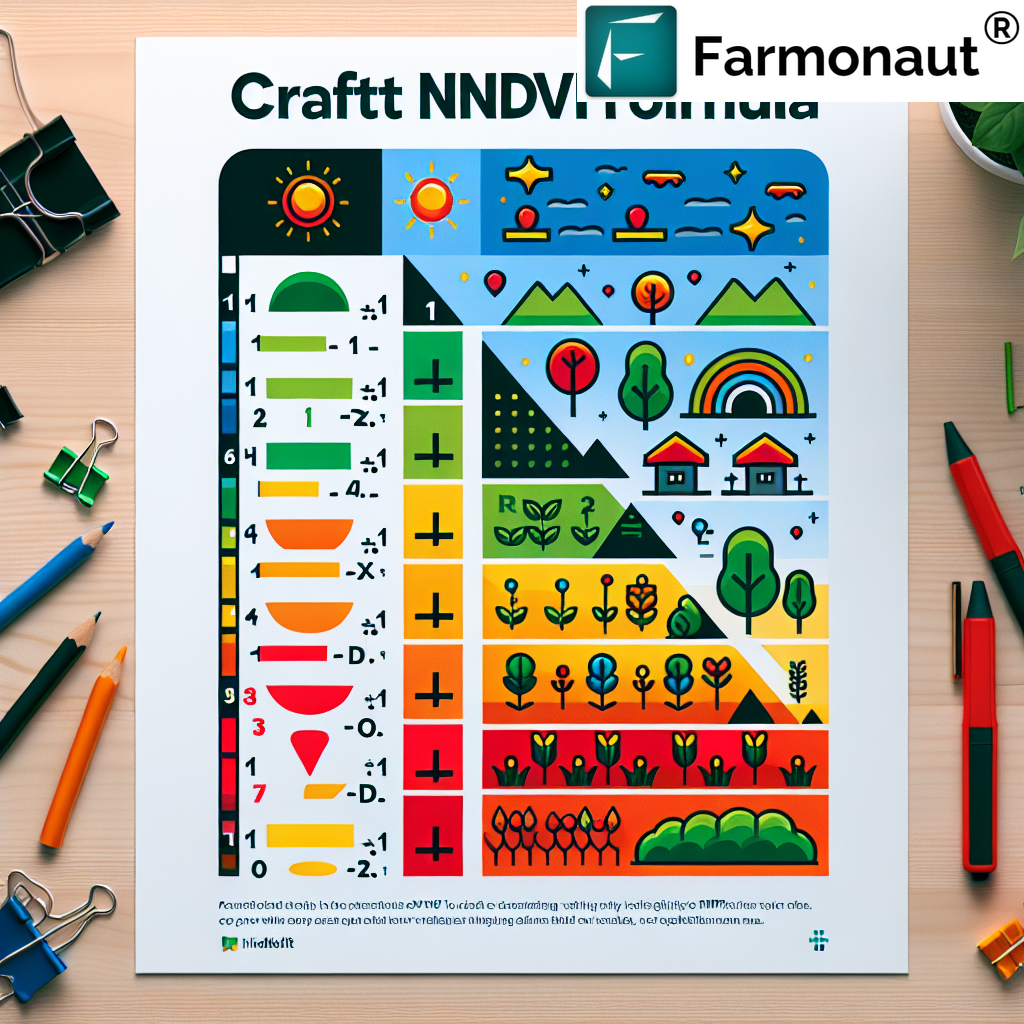
NDVI = (NIR – RED) / (NIR + RED)
Where:
- NIR = Near-Infrared light reflected by vegetation
- RED = Red light reflected by vegetation
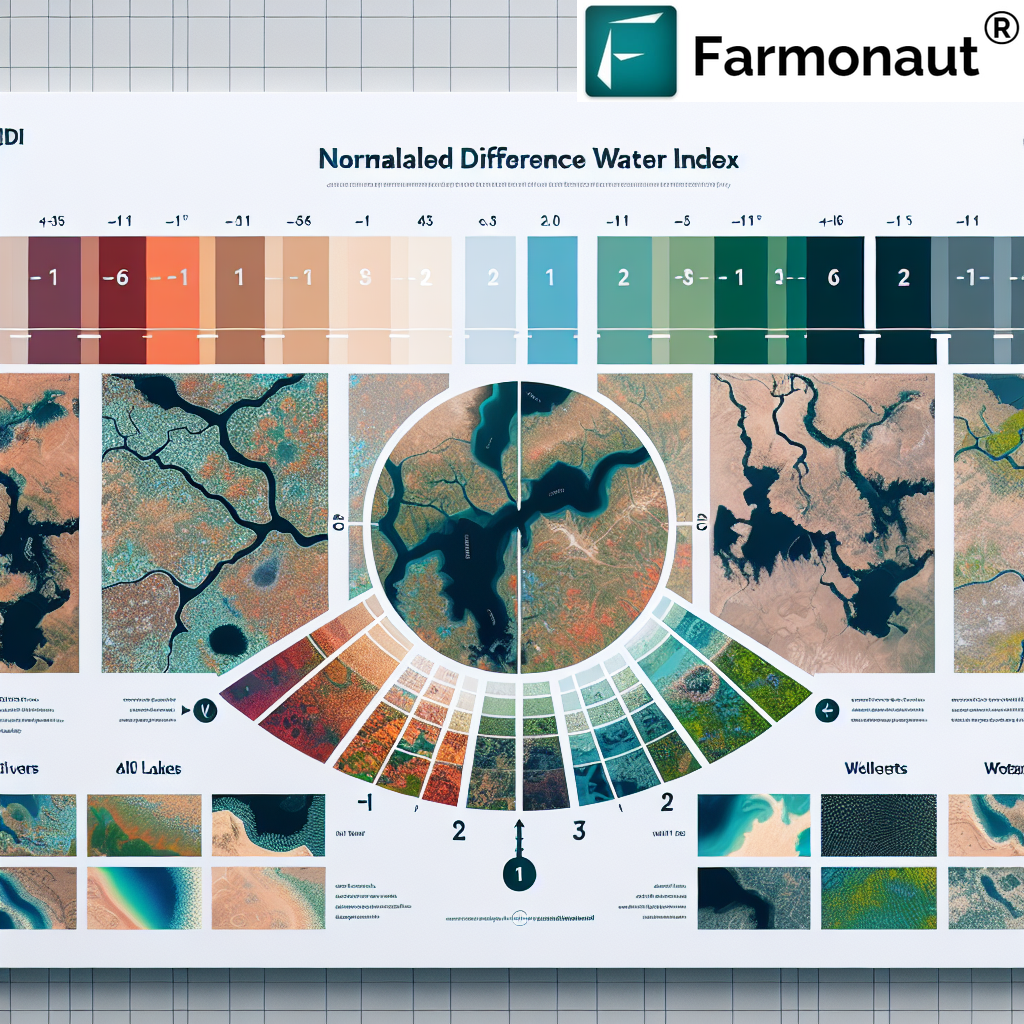
This formula results in values ranging from -1 to +1. Generally, healthy vegetation will have a higher NDVI value (closer to +1), while bare soil, water, or dead vegetation will have lower values (closer to -1).
The Importance of NDVI in Precision Agriculture
Now that we’ve answered the question “What is NDVI in remote sensing?”, let’s explore its significance in precision agriculture:
- Crop Health Monitoring: NDVI allows farmers to assess crop health across large areas quickly and efficiently.
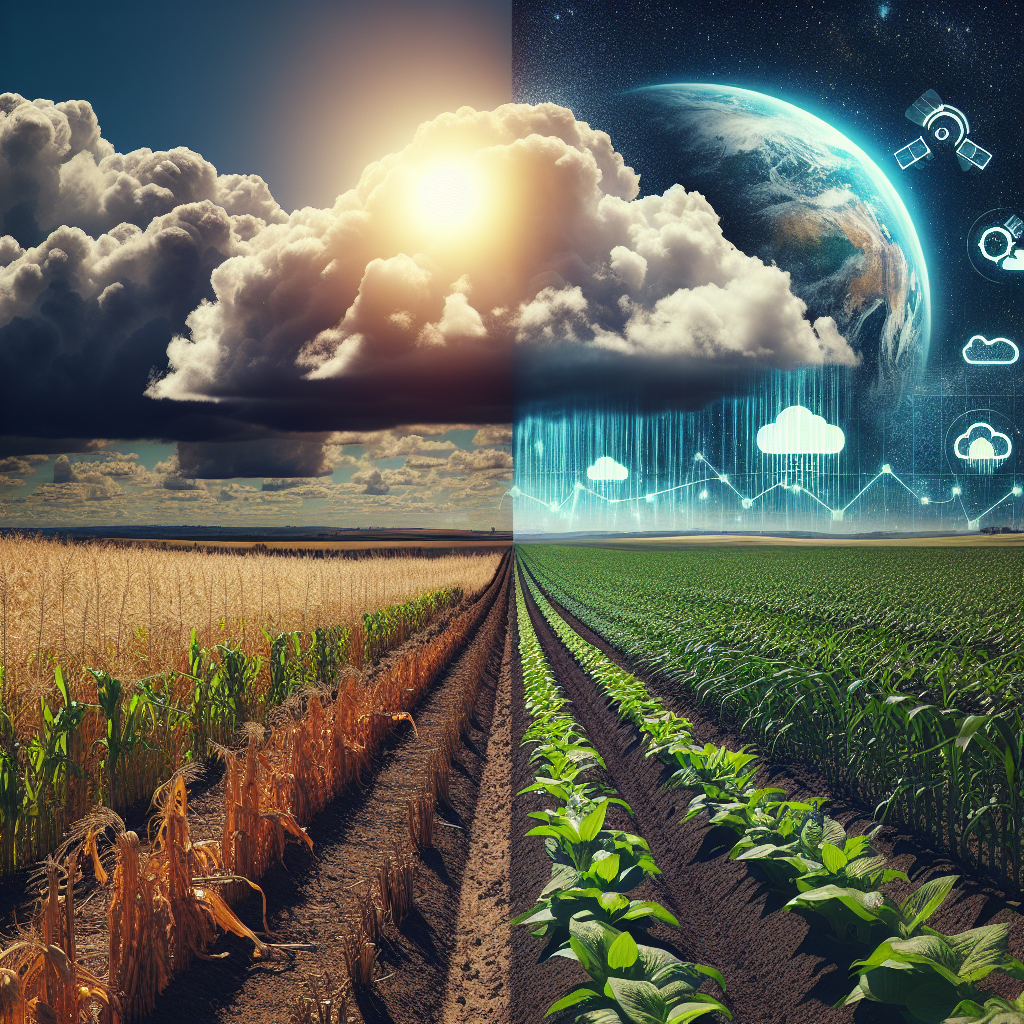
- Early Stress Detection: By regularly monitoring NDVI values, farmers can detect plant stress early, before it becomes visible to the naked eye.
- Yield Prediction: NDVI data can be used to estimate potential crop yields, helping farmers and agribusinesses make informed decisions.
- Resource Optimization: By identifying areas of low vegetation health, farmers can target their resources more effectively, reducing waste and improving efficiency.
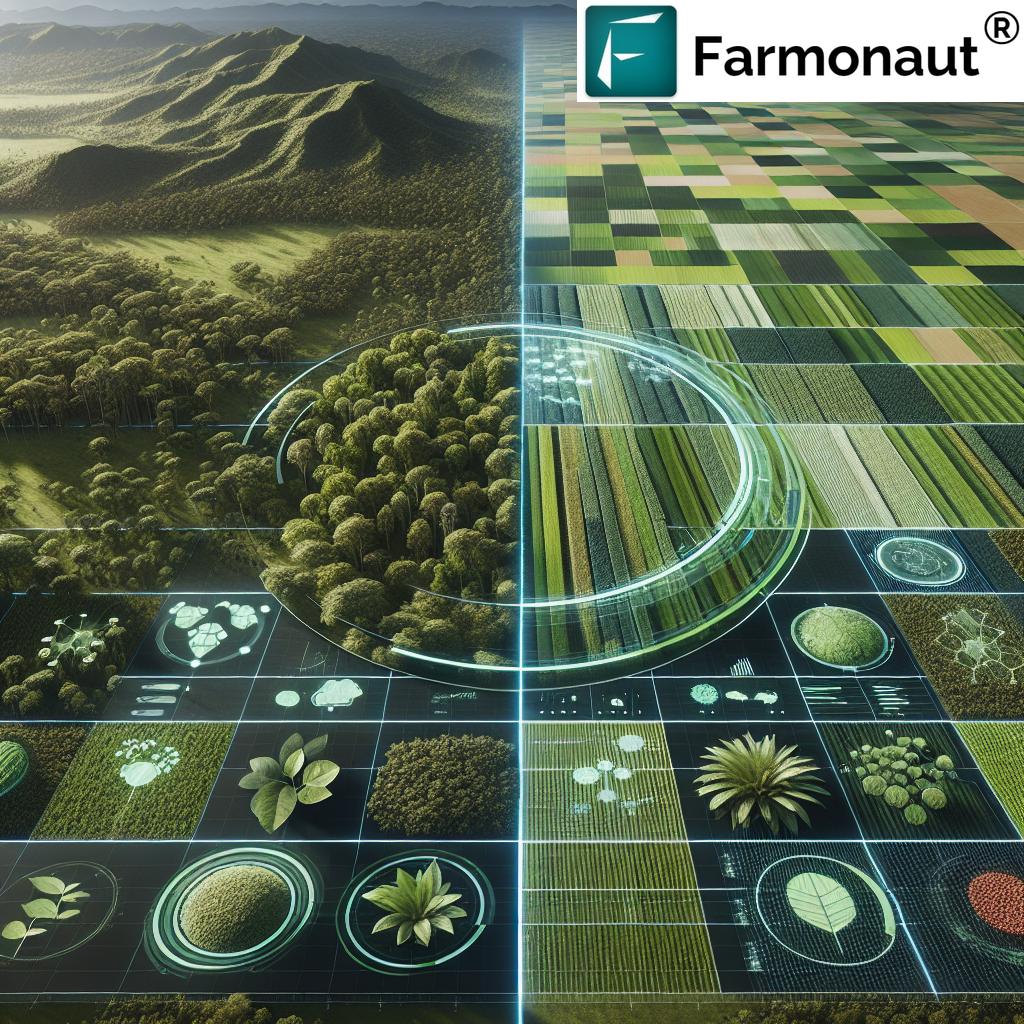
- Environmental Monitoring: NDVI is useful for tracking deforestation, desertification, and other large-scale environmental changes.
How Farmonaut Leverages NDVI for Precision Agriculture
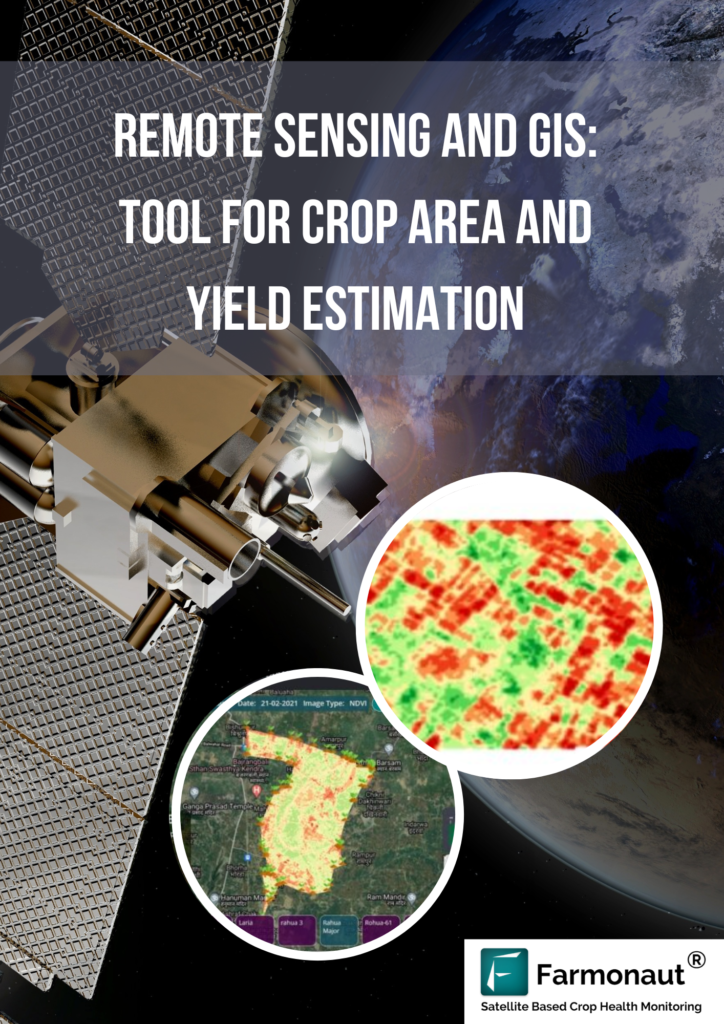
At Farmonaut, we understand the power of NDVI in revolutionizing agriculture. Our satellite-based crop health monitoring system uses advanced NDVI analysis to provide farmers with actionable insights about their fields. Here’s how we utilize NDVI:
- Regular Satellite Imagery: We process high-resolution satellite images to calculate NDVI values for our clients’ fields.
- AI-Powered Analysis: Our Jeevn AI Advisory System combines NDVI data with other factors to provide personalized recommendations.
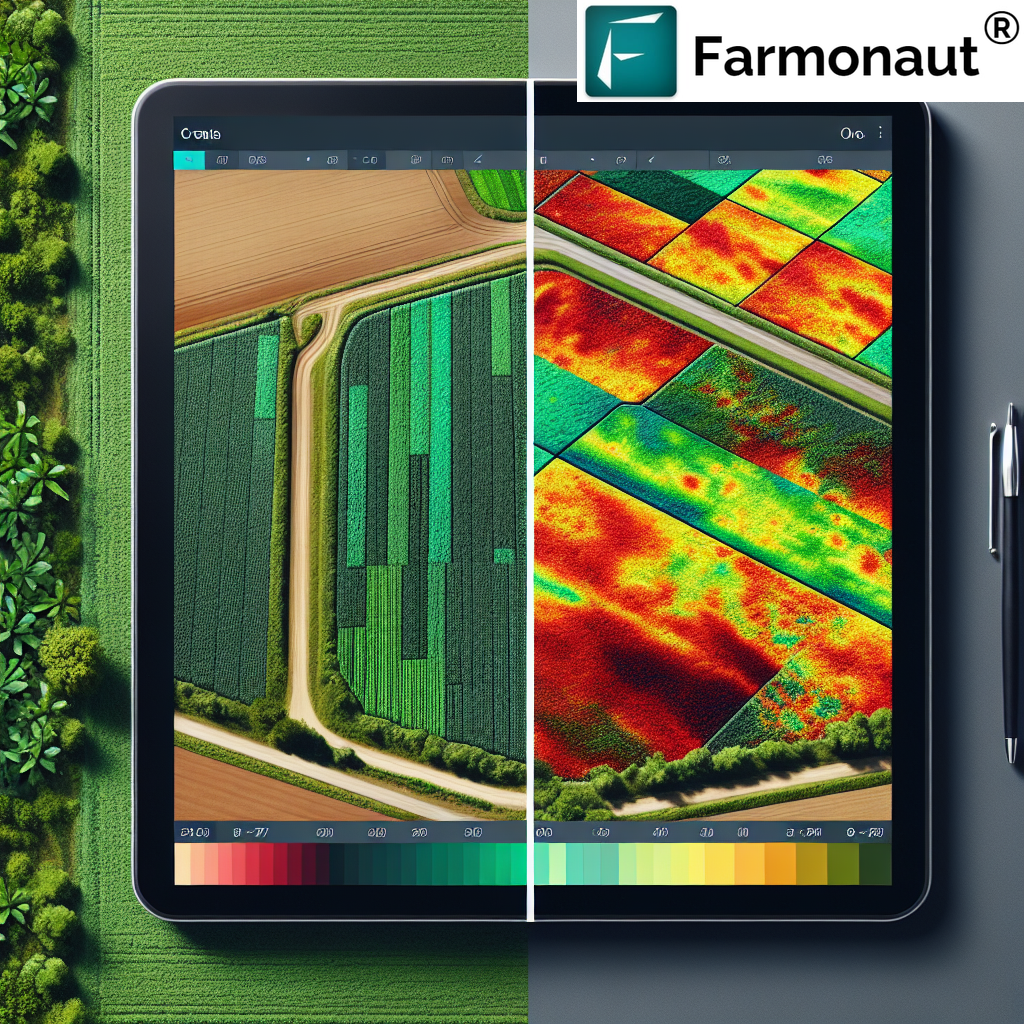
- User-Friendly Visualization: We present NDVI data in easy-to-understand maps and charts, accessible through our web and mobile apps.
- Historical Tracking: Our system allows farmers to track NDVI changes over time, helping identify trends and patterns in crop health.
To experience the power of NDVI analysis for your fields, try Farmonaut today.
NDVI vs. Other Vegetation Indices
While NDVI is one of the most popular vegetation indices, it’s not the only one. Here’s a comparison of NDVI with other common indices:
| Index | Full Form | Primary Use |
|---|---|---|
| NDVI | Normalized Difference Vegetation Index | General vegetation health and density |
| EVI | Enhanced Vegetation Index | Improved sensitivity in high biomass regions |
| SAVI | Soil-Adjusted Vegetation Index | Corrects for soil brightness in areas with sparse vegetation |
| NDRE | Normalized Difference Red Edge | Sensitive to chlorophyll content, useful for nitrogen management |
Farmonaut’s Satellite System vs. Drone and IoT-based Monitoring
While drones and IoT sensors have their place in agriculture, Farmonaut’s satellite-based system offers several advantages:
| Feature | Farmonaut Satellite System | Drone-based Monitoring | IoT-based Monitoring |
|---|---|---|---|
| Coverage Area | Large (Entire fields at once) | Medium | Small (Point-based) |
| Frequency of Data | Regular (Every few days) | As needed (Manual flights) | Continuous |
| Initial Investment | Low | High | Medium to High |
| Operational Complexity | Low (Fully automated) | High (Requires trained operator) | Medium (Requires setup and maintenance) |
| Data Processing | Automated (AI-powered) | Often manual or semi-automated | Automated |
| Scalability | Highly scalable | Limited by flight time and regulations | Requires additional sensors for larger areas |
Practical Applications of NDVI in Agriculture
Let’s explore some real-world applications of NDVI in agriculture:
- Variable Rate Application: Farmers can use NDVI maps to apply fertilizers and pesticides at variable rates across their fields, optimizing input use and reducing costs.
- Irrigation Management: By correlating NDVI values with soil moisture data, farmers can improve their irrigation strategies, ensuring water is applied where it’s needed most.
- Crop Rotation Planning: Historical NDVI data can help farmers make informed decisions about crop rotation, identifying areas that may benefit from different crops or management practices.
- Pest and Disease Detection: Sudden changes in NDVI values can indicate pest infestations or disease outbreaks, allowing for early intervention.
- Yield Forecasting: By analyzing NDVI trends throughout the growing season, farmers and agribusinesses can make more accurate yield predictions.
Challenges and Limitations of NDVI
While NDVI is a powerful tool, it’s important to understand its limitations:
- Saturation at High Biomass: NDVI can saturate in areas with very dense vegetation, making it less effective for distinguishing between high levels of biomass.
- Sensitivity to Atmospheric Conditions: Cloud cover, haze, and other atmospheric factors can affect NDVI calculations.
- Soil Background Effects: In areas with sparse vegetation, soil reflectance can influence NDVI values.
- Limited Information on Vegetation Type: NDVI alone cannot distinguish between different types of vegetation or crops.
At Farmonaut, we address these limitations by combining NDVI with other data sources and advanced AI algorithms to provide more comprehensive and accurate insights.
The Future of NDVI and Remote Sensing in Agriculture
As technology continues to advance, we expect to see several exciting developments in the use of NDVI and remote sensing for agriculture:
- Higher Resolution Imagery: Improved satellite technology will provide even more detailed NDVI maps.
- Integration with AI and Machine Learning: Advanced algorithms will extract more insights from NDVI and other remote sensing data.
- Combination with IoT Data: Integrating satellite-based NDVI with ground-level IoT sensors will provide a more complete picture of crop health.
- Real-time Analysis: Faster data processing and delivery will allow for near-real-time NDVI monitoring.
- Improved Crop-Specific Indices: Development of vegetation indices tailored to specific crops and growth stages.
How to Get Started with NDVI Analysis
If you’re interested in leveraging NDVI for your agricultural operations, here are some steps to get started:
- Choose a Platform: Select a reliable remote sensing platform like Farmonaut that provides NDVI analysis. You can try Farmonaut here.
- Define Your Area of Interest: Identify the fields or areas you want to monitor.
- Set Up Regular Monitoring: Establish a schedule for NDVI analysis that aligns with your crop’s growth stages.
- Learn to Interpret Results: Familiarize yourself with NDVI color scales and what different values mean for your specific crops.
- Integrate with Other Data: Combine NDVI insights with other data sources like weather information and soil tests for a comprehensive view of your farm.
Farmonaut’s NDVI Solutions
At Farmonaut, we offer a range of NDVI-based solutions to suit different needs:
- Web and Mobile Apps: Access NDVI maps and insights on-the-go. Download our app for Android or iOS.
- API Access: Integrate our NDVI data into your own systems. Check out our API documentation.
- Custom Solutions: We can develop tailored NDVI analysis solutions for large-scale operations or specific crops.
Frequently Asked Questions (FAQ)
Q: What is the full form of NDVI in remote sensing?
A: NDVI stands for Normalized Difference Vegetation Index.
Q: What does NDVI mean in remote sensing?
A: NDVI is a numerical indicator that uses the visible and near-infrared bands of the electromagnetic spectrum to analyze the health and density of vegetation.
Q: How is NDVI calculated?
A: NDVI is calculated using the formula: NDVI = (NIR – RED) / (NIR + RED), where NIR is the near-infrared reflectance and RED is the red reflectance.
Q: What are good NDVI values for crops?
A: Generally, NDVI values for healthy vegetation range from 0.2 to 0.8. Values closer to 1 indicate denser, healthier vegetation.
Q: How often should I monitor NDVI?
A: The frequency of NDVI monitoring depends on your crops and specific needs. With Farmonaut, we typically provide updates every 3-5 days, allowing for regular tracking of crop health.
Q: Can NDVI detect specific crop diseases?
A: While NDVI alone cannot identify specific diseases, sudden changes in NDVI values can indicate plant stress, which may be caused by diseases. Farmonaut’s AI system combines NDVI with other data to provide more specific insights.
Q: How does Farmonaut’s satellite-based NDVI differ from drone-based solutions?
A: Farmonaut’s satellite-based NDVI offers wider coverage, more frequent updates, and requires no on-site equipment or operators, making it more cost-effective and easier to scale compared to drone-based solutions.
Conclusion
NDVI has revolutionized the way we monitor and manage crop health in modern agriculture. By understanding the full form of NDVI in remote sensing, its meaning, and its applications, farmers and agronomists can make more informed decisions, optimize resource use, and improve crop yields.
At Farmonaut, we’re committed to making this powerful technology accessible to farmers of all sizes. Our satellite-based NDVI analysis, combined with AI-powered insights, provides a comprehensive solution for precision agriculture.
Ready to experience the benefits of NDVI analysis for your farm? Try Farmonaut today and take the first step towards data-driven agriculture.
Join the precision agriculture revolution with Farmonaut and unlock the full potential of your fields!


