

For lenders and insurers
Satellite crop insurance and lending data for each plot
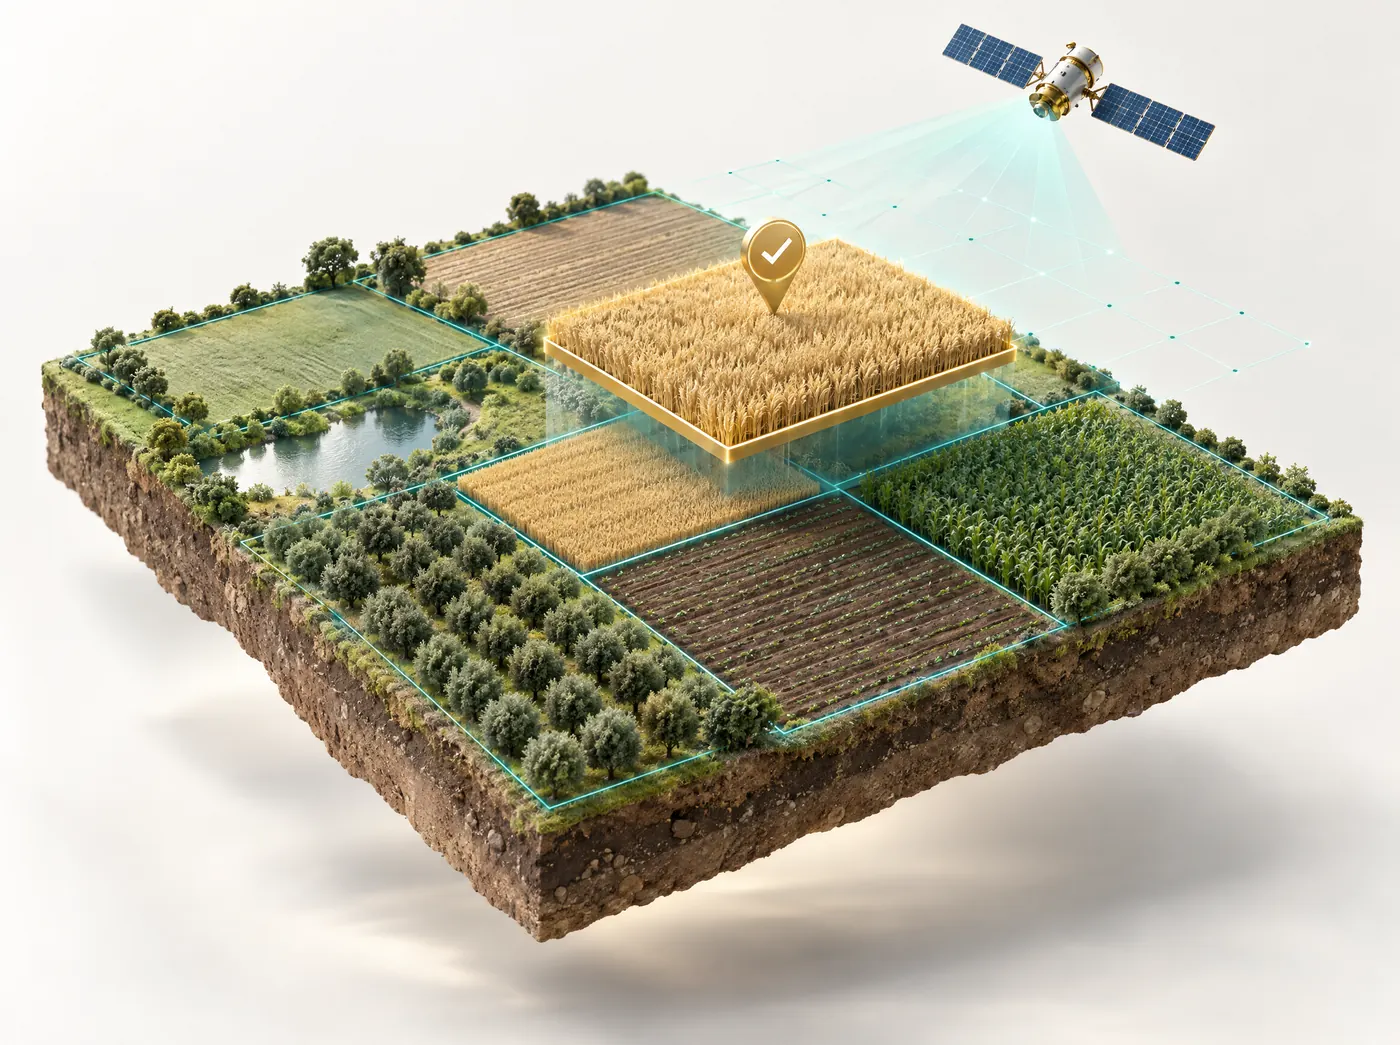
Banks, crop insurers and agri-fintechs use Farmonaut for satellite crop insurance checks and lending data on each plot in a portfolio. You can confirm the field and the crop before you lend or write a policy, follow crop health through the season, and go back to the record when a claim or repayment comes due.
Businesses with fields on the platform
- Agricultural Credit Policy Council
- Acro Insurance
- AgroRisk
- Agrotoken
- John Deere
- CGIAR
- Elders
- BayWa
- Fair Climate Fund
- Hayleys Agriculture
Over the life of a loan or policy
When lenders and insurers use it
Most agricultural risk is still priced from paperwork and a field visit or two. We add an independent satellite record of each plot, starting the day the application comes in and running until the claim or repayment is settled.
Before the loan or policy
Check that the field exists and is where the applicant says it is, then confirm the crop, the area and how the plot did in past seasons.
During the season
Follow crop health, stress and the yield estimate on each plot, and spot the part of the book that's slipping while there's still time to do something about it.
At claim or repayment
Compare a reported loss with the images from before and after the event, and flag claims that don't match the record.
Stage 1 of 3
Farm loan underwriting: what we check first
Draw or upload the plot boundary from the application. After the next satellite pass you'll know what is growing there and how big the field really is.
- The field exists: the boundary falls on actual cropland rather than a road, a river or a neighbor's farm.
- The area is right: we measure the acres inside the boundary and compare them with the declared area.
- The crop matches the application: the season's growth curve shows whether the crop and its planting calendar are what was declared.
- Field history: we build a risk profile from the field's crop history, the local weather and its condition (soil, slope and water).
That profile lets you do agricultural credit risk assessment at the plot level, and set loan and policy terms by each plot's crop type, land size and risk instead of using a single rate for the whole district.

Stage 2 of 3
Keeping an eye on the loan book mid-season
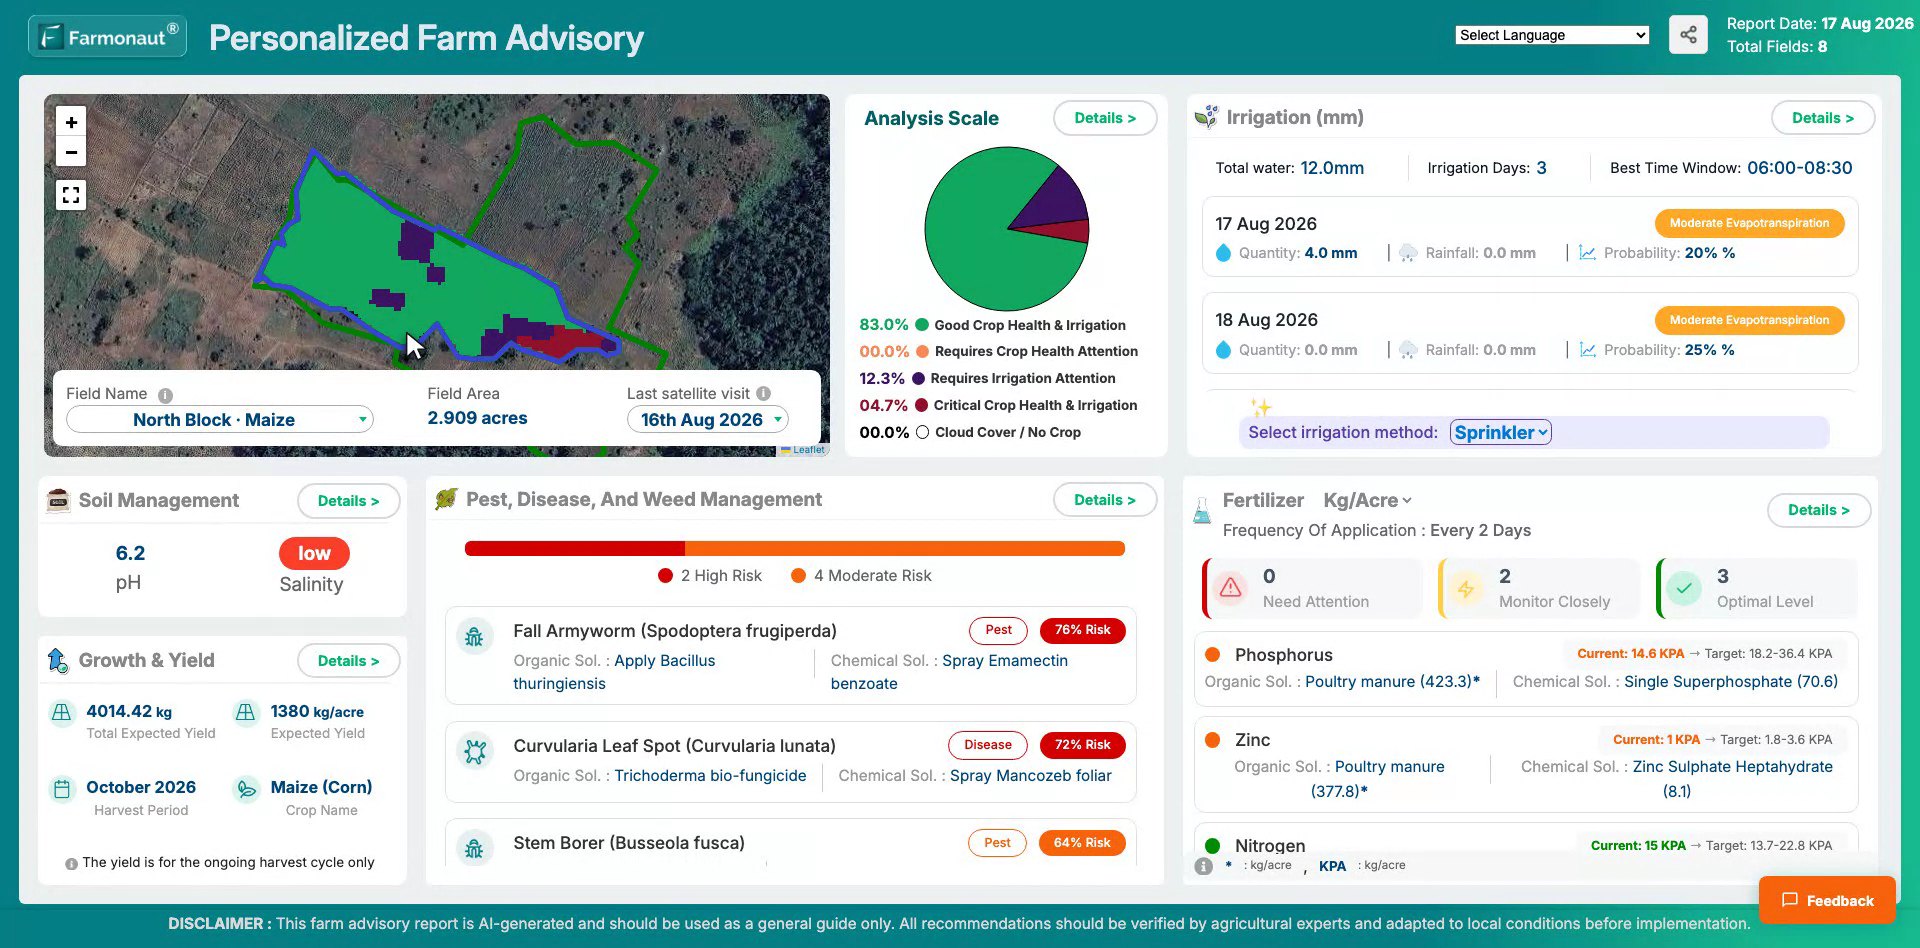
A satellite passes over each plot every few days. Optical sensors measure crop vigor, and radar works through cloud, smoke and haze, so a wet season doesn't leave you with weeks of missing data.
Lenders can also send the field advice to their borrowers through AI farm advisory. The farmer then gets guidance on water, fertilizer and pests while a problem is still small enough to fix.
Stage 3 of 3
How crop insurance claims verification works
By the time a claim arrives, we've been imaging that field all season. You can use that record to settle genuine claims faster and send adjusters to the fields where the evidence doesn't line up.
Damage evidence
Images from before and after the reported event show when crop health dropped, where in the field, and by how much.
Area-yield checks
Compare a claimed loss with the field's own yield estimate and with nearby fields growing the same crop.
Inconsistent claims
A claim gets flagged when the mapped area, the crop we see or the timing of the damage doesn't match what was declared.
Shareable evidence
A PDF report for each field, or a link your adjuster or reinsurer can open without logging in.
The satellite record shows which claims need a closer look. The decision on each claim stays with your loss adjuster.
Data for index and parametric insurance
Index-based and parametric covers pay out on a measured value instead of an assessed loss, so they need a consistent, independent record of each field and region.
Designing an index
We supply vegetation, moisture and evapotranspiration readings for the fields and regions you cover, which gives your product team a field-level history to test a trigger against.
Checking a loss
After an index pays out, the same record shows how the insured fields actually did. That helps you spot basis risk and adjust the design for next season.
We supply the data only. Farmonaut isn't an insurer or a lender, and we don't write policies, set triggers, price risk or settle claims. Those decisions stay with you.
Agri lending solutions for banks, insurers and fintechs
Banks and agri lenders use it to check collateral and the declared crop before they lend, then keep an eye on each loan through the season instead of finding out from a missed payment. Crop insurers and reinsurers underwrite from each field's history, track their exposure during the season, and check incoming claims against independent satellite evidence.
Smaller teams use it too:
- Microfinance lenders and cooperatives cover small plots in remote areas without sending a loan officer out to each one.
- Agri-fintechs use the API to build plot-level data into their own credit or insurance product.
- Programs and agencies track public credit and insurance schemes across regions, and compare them using the same satellite record for each plot.
Bulk upload and API
Agricultural lending software for thousands of plots
You can upload thousands of plots at once and then work in the web app, or pull everything into your own systems.
- Upload boundaries in bulk as KML, KMZ or shapefile, or search for them and draw them on the map.
- Through the API, one call per field returns every satellite view, the values behind it and the field report as JSON.
- Each farmer gets a digital record with the boundary, crop history and readings, kept on file for the next application or renewal.
- Seven partners already run Farmonaut under their own name, and white-label delivery is open to you as well.
Crop insurance technology
Site visits compared with satellite checks
Paperwork and site visits
- Declared area and crop taken largely on trust
- Usually a single visit, often after the damage
- Costly to reach small plots in remote areas
- Risk priced at district level
Satellite-checked
- Area and crop checked against the field itself
- Regular readings from before and after any event
- Thousands of plots reviewed without leaving the office
- A risk profile for each plot
How satellite data supports farm loan underwriting
An agricultural loan file usually rests on what the applicant declares: where the land is, what they'll grow and how much of it. Satellite data lets you test each of those statements before money goes out, which is the part of agricultural credit risk assessment that used to need a field visit.
Does the field exist where the applicant says?
The plot boundary is laid over current imagery. A boundary that lands on a road, a river, buildings or forest is an obvious flag. One that overlaps another applicant's plot is less obvious and worth checking across the whole book.
Is the crop the one declared?
Crops have recognizable growth curves. A vegetation index such as NDVI rises as the canopy closes and falls at ripening and harvest, and the timing and shape differ between, say, rice, maize and sugarcane. Comparing the season's curve with the declared crop and sowing date shows whether they fit.
Is the area right, and how has the plot done before?
We measure the acres inside the boundary and compare them with the declared area. Imagery from past seasons shows whether the field was cropped each year, left fallow, flooded or damaged, and that history, together with weather and field condition, goes into the plot's risk profile.
Monitoring a loan or insurance portfolio in season
Once loans or policies are out, the question becomes "which part of my book is in trouble?" Nobody reviews thousands of plots one at a time, so work by exception: compare each plot's crop health and yield estimate with what's normal for that crop and region at that point in the season, and look closely at the plots and districts that fall well short.
- Regional totals of expected yield show where a drought or flood is hitting the book, weeks before repayments come due.
- Plots that stop developing, or show no crop at all after the declared sowing date, are worth a call from the loan officer.
- Plots with high pest-risk scores can get guidance through AI farm advisory while the problem is still small.
What you do with an early warning (reschedule, visit, send advice or wait) is still a credit decision for your team.
Claims verification and area-yield checks
For satellite crop insurance, claims are where the season-long record is most useful. A claim says something happened to a crop, on a field, around a date, and each part can be checked. Imagery from before and after the event shows whether crop health dropped and where. Radar helps after floods and storms, when cloud often hides the field from optical satellites. The field's own yield estimate and nearby fields growing the same crop put the claimed loss in context.
- Each claim, filed against a plot ID that matches a boundary on file, is compared with the satellite record for that plot and its neighbors.
- Claims that fit the record move ahead under your settlement rules.
- Claims where the area, crop or timing don't fit go to an adjuster for a field visit.
Some losses don't show from above. Hail damage to fruit or a drop in grain quality may leave the canopy looking normal, so those claims still need someone on the ground. Our article on how satellite imagery is used in crop insurance covers more examples.
Index and parametric insurance: where satellite data fits
Traditional indemnity cover pays for a loss assessed on each farm. Index insurance pays when a measured value crosses a threshold agreed in advance, such as rainfall at a weather station, the average yield across an area, or a vegetation index over a region. Parametric is the wider term for covers that pay on a trigger instead of an assessed loss. Payouts can be quick and cheap to administer.
Their weak point is basis risk, the gap between what the index measures and what happened in a particular field. A farmer can lose a crop and get nothing, or get paid when the crop was fine. Satellite data helps at three stages. Field- and region-level histories of vegetation, moisture and evapotranspiration let a product team test how a trigger would have behaved in past seasons. During the season, an independent record shows whether conditions in the insured area match what the index measured. After a payout, comparing the insured fields' actual condition with the payout shows where basis risk sits. Our piece on parametric crop insurance and AI loss adjustment goes further into product design.
What data you provide and how integration works
The checks are only as good as the plot records behind them. For a pilot or a full rollout, we'd ask for:
| Input | Why it matters | Format |
|---|---|---|
| Plot boundary | Every check runs inside it | KML, KMZ or shapefile, or drawn on the map |
| Unique plot ID | Matches results to your loan or policy | Your own ID, supplied with the boundary |
| Farmer or customer ID | Links several plots to one borrower or policyholder | The ID from your system |
| Declared crop and sowing date | What the satellite record is compared against | Crop name and date |
| Declared area | Compared with the measured area | Acres or hectares |
If all you hold is a single GPS point for each farm, the crop and area checks get much weaker, so it pays to collect boundaries at application. Through the agriculture data API, one call per field (POST /submitField with your API key) returns every satellite view, the values behind it and the field report as JSON, which your credit or claims system can store against the plot ID.
Model risk and ground-truthing
Satellite checks can be wrong. These are the usual weak spots:
- Small plots. At 10-meter resolution a half-acre plot covers about 20 pixels, and the ones along the edge mix the crop with paths, bunds or the neighbor's field.
- Intercropping and mixed plantings, which blur the growth curve of any single crop.
- Long cloudy spells. Radar fills many gaps, but optical indices like NDVI can still have holes in the record.
- Wrong boundaries, which produce confident results for the wrong piece of land.
The fix is regular ground-truthing. Each season, visit a random sample of plots, including some the data says are fine, and compare what your staff see with what the record showed. Over a few seasons that shows how much weight satellite flags can carry in your crops and regions. Treat a flag as a reason to look, and keep the decision with a person.
Regulation and fairness, in general terms
Bringing new data into a credit or claims decision carries obligations that depend on your country and license. Treat this as a list to raise with your compliance team rather than legal advice.
- Plot boundaries tied to a named farmer are personal data under laws such as the EU's GDPR, so tell applicants what you collect and why.
- If satellite data contributes to a declined loan or a rejected claim, your staff should be able to explain what the data showed in terms the farmer understands.
- Check that satellite-based rules don't consistently disadvantage farmers with very small plots, where the data is weaker, or regions with frequent cloud.
- Give farmers who disagree with what the imagery shows a way to ask for a field visit.
In the EU, the AI Act (Regulation (EU) 2024/1689) lists AI systems used to assess the creditworthiness of individuals as high-risk, which brings extra requirements for the lender using them.
If you're a farmer comparing loans, see our guide to current USDA FSA and bank farm loan interest rates.
Satellite crop insurance: common questions
What is satellite crop insurance?
Satellite crop insurance uses Earth-observation data to underwrite, monitor and verify crop policies. Instead of relying only on declarations and site visits, the insurer checks each insured field's location, area, crop and condition from satellite imagery, and uses the season-long record to assess claims. Farmonaut supplies that field-level data to insurers, reinsurers and the lenders who work alongside them.
How does satellite imagery help farm loan underwriting?
Before a loan is approved, we check the plot boundary against satellite imagery to confirm the field exists, measure its area and identify the crop. A risk profile built from crop history, weather and field condition then helps set the loan size and terms. Once the loan is out, the lender can see crop health and a yield estimate for every plot in the book.
Can satellites verify crop insurance claims?
They can show whether a claim fits what actually happened in the field. We compare satellite images from before and after the reported event, check the claimed area and crop, and set the loss against the field's yield estimate and against nearby fields. Claims that don't match are flagged for a field visit, and your adjuster makes the final decision.
Does cloud cover stop the monitoring?
No. As well as optical imagery we use radar, which isn't blocked by cloud. That matters most in the rainy and flood seasons, which is when a lot of claims come in.
Do you support parametric or index insurance?
Yes, as a data provider. Field- and region-level vegetation, moisture and evapotranspiration records help product teams design and test an index, and help check how insured fields actually did after a payout. We don't act as the insurer, though, and we don't set triggers or settle claims.
What is parametric crop insurance?
It's cover that pays out when a measured value, such as rainfall, an area's average yield or a satellite vegetation index, crosses a threshold set in advance, instead of after a loss is assessed on each farm. Payouts are faster, but the farmer carries basis risk when the index and the field don't match. Satellite records help test a trigger against past seasons and check it afterward.
Is Farmonaut a crop insurer or a lender?
No. We supply field-level satellite data and reports. Underwriting, pricing, triggers, credit decisions and claim settlement all stay with you.
Can we monitor thousands of plots and use our own systems?
Yes. You can upload boundaries in bulk as KML, KMZ or shapefile and pull results through the agriculture data API, which returns every satellite view, its values and the field report as JSON. We also offer white-label delivery under your brand.
Which crops and countries are covered?
166 crops are monitored on the platform today, in 135 countries, including rice, wheat, maize, cotton, soybean, sugarcane, oil palm and cocoa. Coverage is global, since the satellites image the whole planet.
How do I monitor crop health on my own farm?
This page is for lenders and insurers. If you're a farmer, read our guide on how to monitor crop health using satellites, or start with satellite crop monitoring.
Pilot
What would the record show for your portfolio?
A pilot runs on a sample of your plots. We pull the field-level record for each one, across the crops and regions you cover, and show you what it looks like.
More Farmonaut solutions

 Field Capacity
 Abhishta Agri
 SP Farms
 Indosistim Teknologi
 Liquify Digital
 CU Foods
 BeyondTech Global
 Rouge VC
 AgroGreen Dynamics
 AgroRisk
 Oath Inc
 Reddane Farming
 Esri North East Africa
 Cresol
 MDCV UK
 Etech Consulting Madagascar
 Vestlandsforsking
