

Scope 3 and carbon farming data
Measure your farm carbon footprint with satellite soil maps
We map soil organic carbon in each of your fields from satellite data and track how it changes from one season to the next. Put that together with your fuel, fertilizer and livestock records and you have a farm carbon footprint you can share with buyers, auditors and carbon programs.
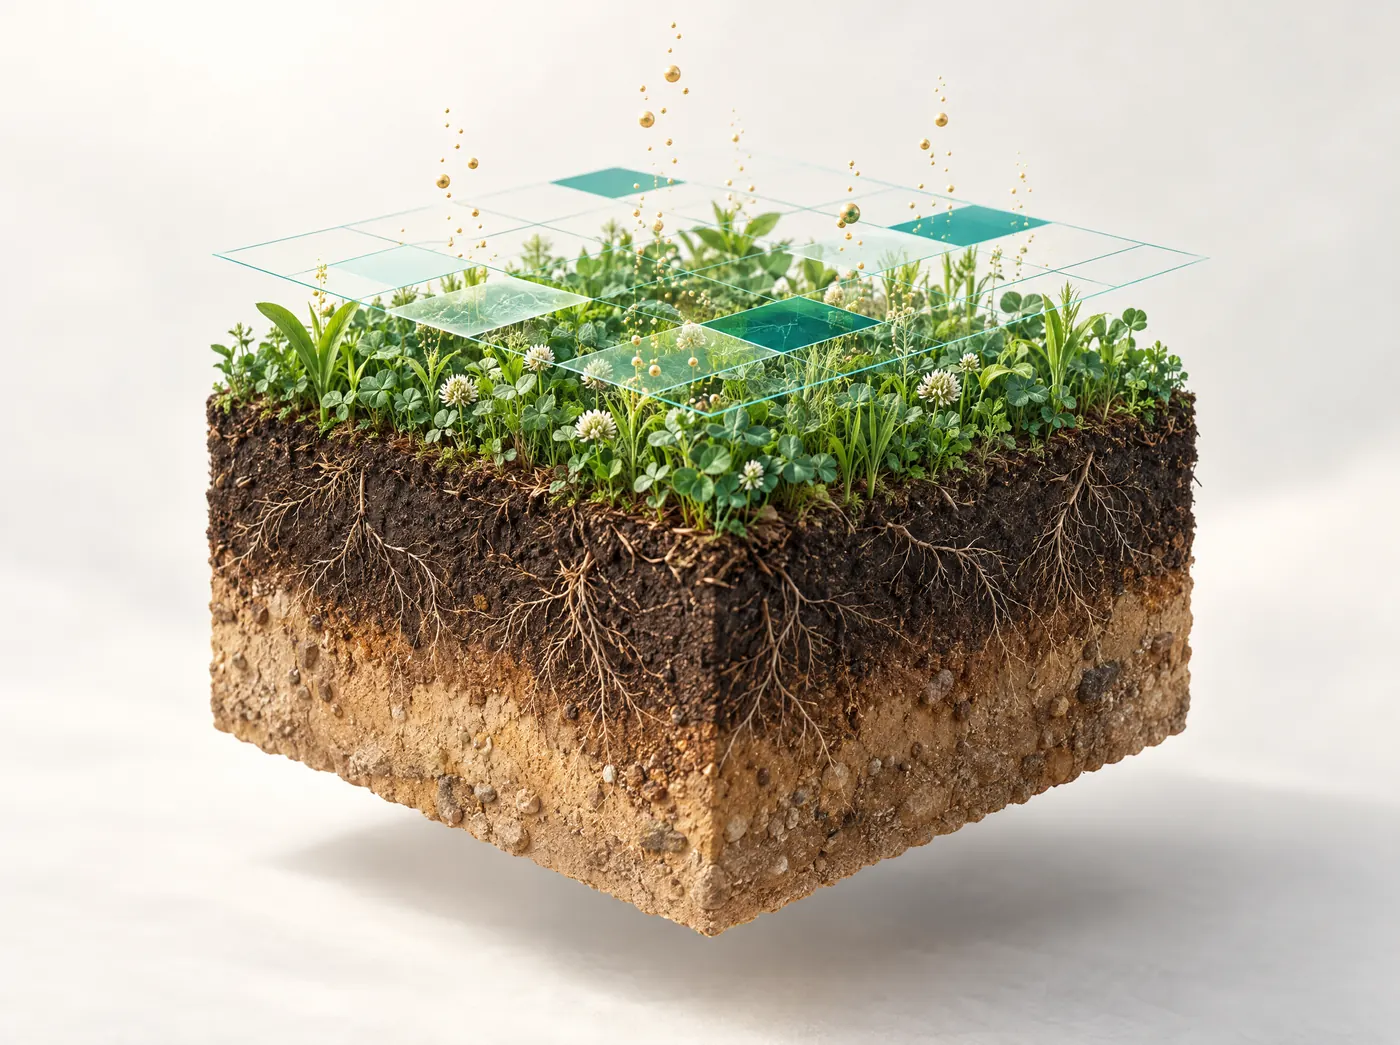
Carbon footprint in agriculture
Why buyers are asking farms for carbon numbers
Fertilizer, fuel, livestock and land-use change all release greenhouse gases. Soil can go the other way: practices that build soil organic carbon take some of that carbon back out of the air. Buyers, lenders and regulators now want figures for both, broken down to the field.
Source: FAO, "Greenhouse gas emissions from agrifood systems: global, regional and country trends, 2000–2022".
Setting up soil carbon monitoring
The mapping is done from satellite data, so there's no equipment to install. What can't be seen from space comes from your farm records, and soil samples are used to calibrate and check the estimates.
Map your fields
Draw boundaries or upload KML, KMZ or shapefiles for one farm or thousands of supplier plots.
Set the baseline
Soil organic carbon is mapped by zone for each field, calibrated with soil samples and paired with your input records.
Track practices
Satellite time series show cover crops, bare-soil periods and crop growth across the seasons.
Report the change
We produce field-level reports, plus blockchain-backed records of each change that you can pass on when someone asks for evidence.
Soil carbon measurement
Where each number comes from
A carbon footprint needs both remote sensing and farm data. This is what we get from satellites and what still has to come from you.
Measured from space
- Soil organic carbon maps by zone for each field, repeated over time to show change.
- Cover crops and green cover between cash crops, from vegetation indices such as NDVI and EVI.
- Bare-soil periods, which help evidence tillage and residue practices.
- Field boundaries and areas, and how the crop grows through the season.
Still comes from farm records and soil samples
- Fuel and electricity used by machinery, pumps and dryers.
- Fertilizer and manure quantities, the main source of nitrous oxide.
- Livestock numbers, feed and manure management.
- Lab soil samples, used to calibrate and check the satellite soil carbon estimates.
Satellite soil carbon estimates are modeled from spectral data. We calibrate them against soil samples and use the two together. The maps also help you decide where it's worth taking samples.
Soil carbon maps by zone
Soil organic carbon monitoring uses one of the standard satellite views we produce for each field. The map colors the field by high, medium and low zones and is updated with each new satellite pass.
- Find the low zones that would gain most from cover crops, compost or reduced tillage.
- Compare two dates, or play the season back, to see how soil carbon has changed.
- Send samplers to the zones that matter instead of sampling on a blanket grid.
- Check crop health in the same satellite crop monitoring account.
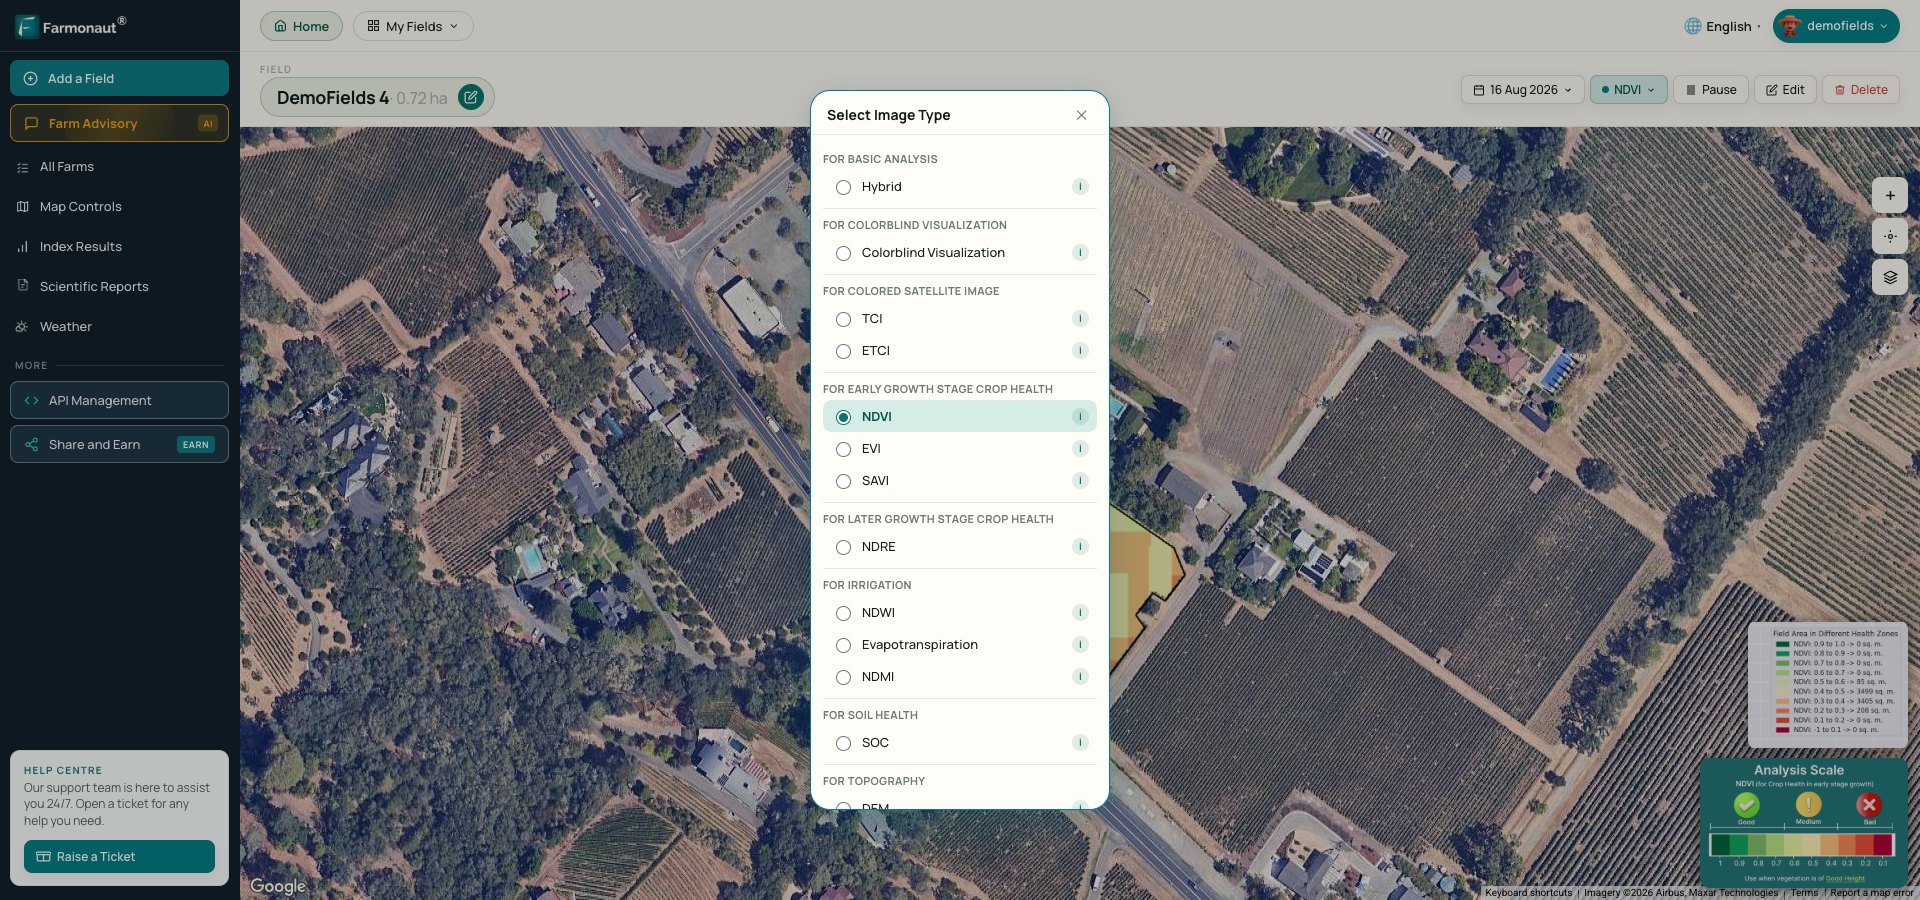
What we supply for carbon farming MRV
A carbon farming project depends on measurement, reporting and verification (MRV). We supply the field data that the project developer reports and the verifier checks.
- Baseline: soil organic carbon maps for each enrolled field at the start of the project.
- Practice evidence: satellite time series showing cover crops and bare-soil periods on each field.
- Change over time: repeat maps for every monitoring period.
- Tamper-evident records: data is kept on a blockchain, so entries can't be quietly edited later.
What Farmonaut provides
Field-level, repeatable satellite measurements and records you can hand to a verifier, for thousands of plots at once.
What stays with the standard
Carbon credits are issued by carbon standards and registries after third-party verification under their own methods. Good data helps a project, but we can't promise credits, and neither can any other data provider.
Farms, food companies and carbon project developers
Farms and growers
See your soil carbon by zone and show buyers the practices on your land. If you join a carbon program later, the records are already there.
Food and beverage companies
Collect field-level data from supplier farms for Scope 3 supply-chain reporting, and link it to each lot with product traceability.
Carbon project developers
Baseline and monitor soil carbon and practices across many smallholder or broadacre plots, with data that's ready for MRV.
Where a farm's emissions come from
Carbon accounting sorts emissions into three scopes, following the GHG Protocol. Scope 1 is what the farm releases directly, Scope 2 is the electricity it buys, and Scope 3 is everything upstream and downstream, such as the energy used to make the fertilizer. On many crop farms and grazing operations Scope 1 is the largest share, and much of it isn't CO₂.
| Source | Main gas | Scope | Records you'll need |
|---|---|---|---|
| Nitrogen fertilizer and manure on fields | Nitrous oxide (N₂O) | 1 | Product, rate and timing per field |
| Diesel and gasoline | CO₂ | 1 | Fuel purchases or meter readings |
| Cattle, sheep and goats | Methane (CH₄) | 1 | Head count, weights, feed |
| Manure storage | CH₄ and N₂O | 1 | Storage type and how long manure sits |
| Flooded rice | CH₄ | 1 | Water management and season length |
| Electricity for pumps, dryers and cooling | CO₂ | 2 | Utility bills |
| Making fertilizer, feed and other inputs | Mixed | 3 | Purchase records |
Land-use change sits alongside these. Clearing forest or plowing up grassland releases the carbon stored in trees and soil, and buyers increasingly ask for proof it hasn't happened on the land supplying them. Nitrous oxide also deserves attention out of proportion to its tonnage, because each tonne traps far more heat than a tonne of CO₂.
How a farm carbon footprint is calculated
Most of the calculation is activity data multiplied by an emission factor. Liters of diesel times kilograms of CO₂ per liter. Kilograms of nitrogen applied times the share expected to escape as N₂O. Each gas is then converted to CO₂-equivalent using its global warming potential, and the totals are added up.
The IPCC guidelines for national greenhouse gas inventories set out three tiers of method, and farm calculators borrow the same idea. Tier 1 uses default emission factors and is quick but coarse. Tiers 2 and 3 use country- or farm-specific factors and models, and pick up the effect of your soils, climate and practices much better. Which tier you need depends on who the number is for: a first estimate for your own planning can use Tier 1, while a carbon program or a food company's reduction target will usually ask for more.
Decide the unit early. A farm carbon footprint can be reported per farm, per hectare or per tonne of product. Buyers usually want it per tonne of the crop they buy from you, which means a farm can lower its footprint per tonne by raising yield without changing its total emissions.
Soil organic carbon: how it's measured and how satellite estimates are calibrated
The reference method is still a soil sample. Cores are taken to a set depth, often 30 cm and sometimes deeper, and a lab measures the carbon content, usually by dry combustion. To turn a percentage into a stock you also need bulk density, the weight of soil in a given volume. The arithmetic is simple: soil at 1.5% organic carbon, with a bulk density of 1.3 g/cm³, over 30 cm holds about 58.5 tonnes of carbon per hectare. Multiply by 3.67 to express that as roughly 215 tonnes of CO₂.
Sampling is accurate at the point where the core was taken, but soil carbon varies a lot across a field, so a few cores can miss the pattern. Satellite estimates come at the problem from the other side. Bare soil with more organic matter tends to be darker and reflects light differently in the visible, near-infrared and shortwave-infrared bands. A model trained on lab results from local samples turns that reflectance into a soil organic carbon estimate for each zone, and the estimate should then be checked against samples the model hasn't seen.
The two work best together. The satellite map shows where the high, medium and low zones are, so samplers can take cores in each zone instead of on a blanket grid, and the cores keep the map calibrated. Our explainer on what soil organic carbon is and how to raise it covers the soil science in more depth.
What MRV means for carbon farming projects
MRV stands for measurement, reporting and verification. In a soil carbon project it usually runs like this. The developer sets a baseline for each enrolled field and documents the practices that will change. Over the project period, soil carbon and practices are measured again, often with a mix of sampling and models. The results go into a monitoring report, and an independent verification body approved by the carbon standard checks it before the registry decides whether to issue credits.
Verifiers look at more than the carbon number. They ask whether the change is additional (it wouldn't have happened anyway), whether it's likely to last, and whether emissions have simply moved elsewhere. Most standards also hold back a share of credits in a buffer against reversals. The whole cycle takes years, and the rules differ between standards.
Our part is the field data: baseline soil carbon maps, satellite evidence of cover crops and bare-soil periods, and tamper-evident records the verifier can check. Whether credits are issued is decided by the standard and the registry, so we don't promise them. If you're weighing up a program, our guides on carbon credits for farmers in the US and selling carbon credits in Australia walk through the market side.
What food companies ask their suppliers for
For a food or beverage company, the emissions on your farm are part of its Scope 3, under purchased goods. Many of these companies have set reduction targets, and those with large land-based emissions are expected to set separate forest, land and agriculture (FLAG) targets under the Science Based Targets initiative. To track progress, more of them are asking for primary data from farms in place of regional averages. A typical supplier request includes:
- field boundaries and the crop and yield from each field
- nitrogen applied, by product and rate
- fuel and electricity use
- practices such as cover crops, tillage and residue management, with evidence
- confirmation that no forest or natural land was converted
That last point is also a legal requirement for some products sold into the EU. Under the EUDR, cattle, cocoa, coffee, oil palm, rubber, soya and wood need plot geolocation and proof of no deforestation after 31 December 2020. Our product traceability system links that field-level evidence to the lots a buyer receives.
Practices that build soil carbon and how they show up from space
Some practices are easy to see in satellite data and some aren't, which affects how much paperwork you'll need to back them up.
| Practice | What satellites show | What still needs records |
|---|---|---|
| Cover crops | Green cover between cash crops in NDVI and EVI | Species and seeding date |
| Reduced or no tillage | Fewer and shorter bare-soil periods | Tillage passes and equipment used |
| Residue retention | Soil not left bare after harvest | Whether residue was baled or burned |
| Perennials or grass leys in the rotation | Year-round green cover | Rotation plan |
| Compost and manure | Little directly | Source, quantity and date applied |
| Trees and hedgerows | New tree canopy, once it's wide enough to show at 10 m | Species and planting date |
Over the years, the soil organic carbon view for each zone shows whether the practices are moving the numbers. Our post on farming practices that store carbon in soil goes through each one in more detail.
Limits worth planning around
Soil carbon changes slowly against a large background stock, so a real gain can take several years to show above the natural variation. Satellites read the surface, and deeper carbon needs cores. Bare-soil readings also need a clear window between crops, which some rotations rarely give. Moisture and a rough, cloddy surface change how soil reflects light too, so readings taken just after rain or tillage are less reliable. Carbon stored in soil can be lost again if a field is plowed up or goes through a long drought, which is why programs care about permanence. Researchers also still debate how much reduced tillage adds below plow depth, so expect a program to be cautious about crediting it.
Decide who the footprint is for. A buyer's Scope 3 request, a bank's sustainability-linked loan and a carbon program each want different detail, and knowing which one you're answering saves a second round of data collection.
Farm carbon footprint FAQ
What is a farm carbon footprint?
A farm carbon footprint is the total greenhouse gas a farm releases, from fuel, fertilizer, livestock and land use, minus the carbon it stores in soil and vegetation. It is usually expressed in tonnes of CO₂-equivalent per farm, per hectare or per tonne of product.
How do you measure the carbon footprint in agriculture?
Part of it comes from farm records: fuel, electricity, fertilizer and livestock numbers. The soil side comes from soil organic carbon measurement. We map soil organic carbon by zone from satellite data, track practices like cover cropping over time, and combine that with your records and soil samples.
Can satellites measure soil organic carbon?
Satellites don't measure carbon directly. They measure light reflected from the soil and crop, and models turn that into soil organic carbon estimates. Those estimates are calibrated against lab soil samples and used alongside them. Where they help most is coverage: you get an estimate for each zone of each field, repeated over time.
How accurate is satellite soil carbon monitoring?
It depends on the soil, the crop cover and how many local soil samples are used for calibration, so we don't quote a single accuracy figure. For carbon projects, satellite maps are paired with sampling under the methodology the project follows.
What are Scope 1, 2 and 3 emissions on a farm?
Scope 1 is what the farm releases directly: fuel burned in machinery, nitrous oxide from fertilizer and manure, and methane from livestock and flooded rice. Scope 2 is purchased electricity. Scope 3 covers the rest of the chain, such as the emissions from making the fertilizer and feed you buy.
What does MRV mean in carbon farming?
MRV stands for measurement, reporting and verification. A project measures soil carbon and practices at the start and over time, reports the change, and an independent verifier checks it before a registry decides on credits. We supply the field-level measurement and practice data for that process.
How long does it take for soil carbon to change?
Usually several years. Soil carbon builds slowly against a large existing stock and varies a lot within a field, so a single season's change is hard to separate from sampling noise. That's why carbon programs run over many years and re-measure at set intervals.
Which farming practices increase soil organic carbon?
Cover crops, reduced tillage, keeping crop residue on the field, adding perennials or grass leys to the rotation, compost and manure, and planting trees or hedgerows. How much each adds depends on your soil and climate. Cover crops and bare-soil periods are the easiest to evidence with satellite data.
Can farmers earn carbon credits with Farmonaut?
Farmonaut provides the measurement and practice data that carbon credits for farmers depend on. The credits themselves are issued by carbon standards and registries after independent verification, so we can't promise that a project will earn them.
Does it help with Scope 3 reporting?
Yes. Food and beverage companies can collect field-level data from supplier farms in one place and connect it to the lots they buy through Farmonaut traceability, which supports Scope 3 supply-chain reporting.
Do I need sensors or drones?
No. You only need field boundaries. Add them by drawing on the map or uploading KML, KMZ or shapefiles. Soil samples for calibration are taken the usual way.
How much does carbon footprinting cost?
It depends on the area, the number of fields and the reports you need. Contact our team for a quote.
Soil carbon baseline
Who needs to see your carbon numbers?
We need your field boundaries and a note on who the report is for. From there we map the soil carbon baseline for each field and set up the records that go with it.
More Farmonaut solutions