

EUDR support and blockchain records
Agricultural traceability from farm plot to shelf
Our agricultural traceability software links each lot you buy to the farm plot it came from. We map the plot and check it by satellite, record each handling step on a blockchain ledger, and give the product a QR code that anyone further down the chain can scan to see where it was grown.
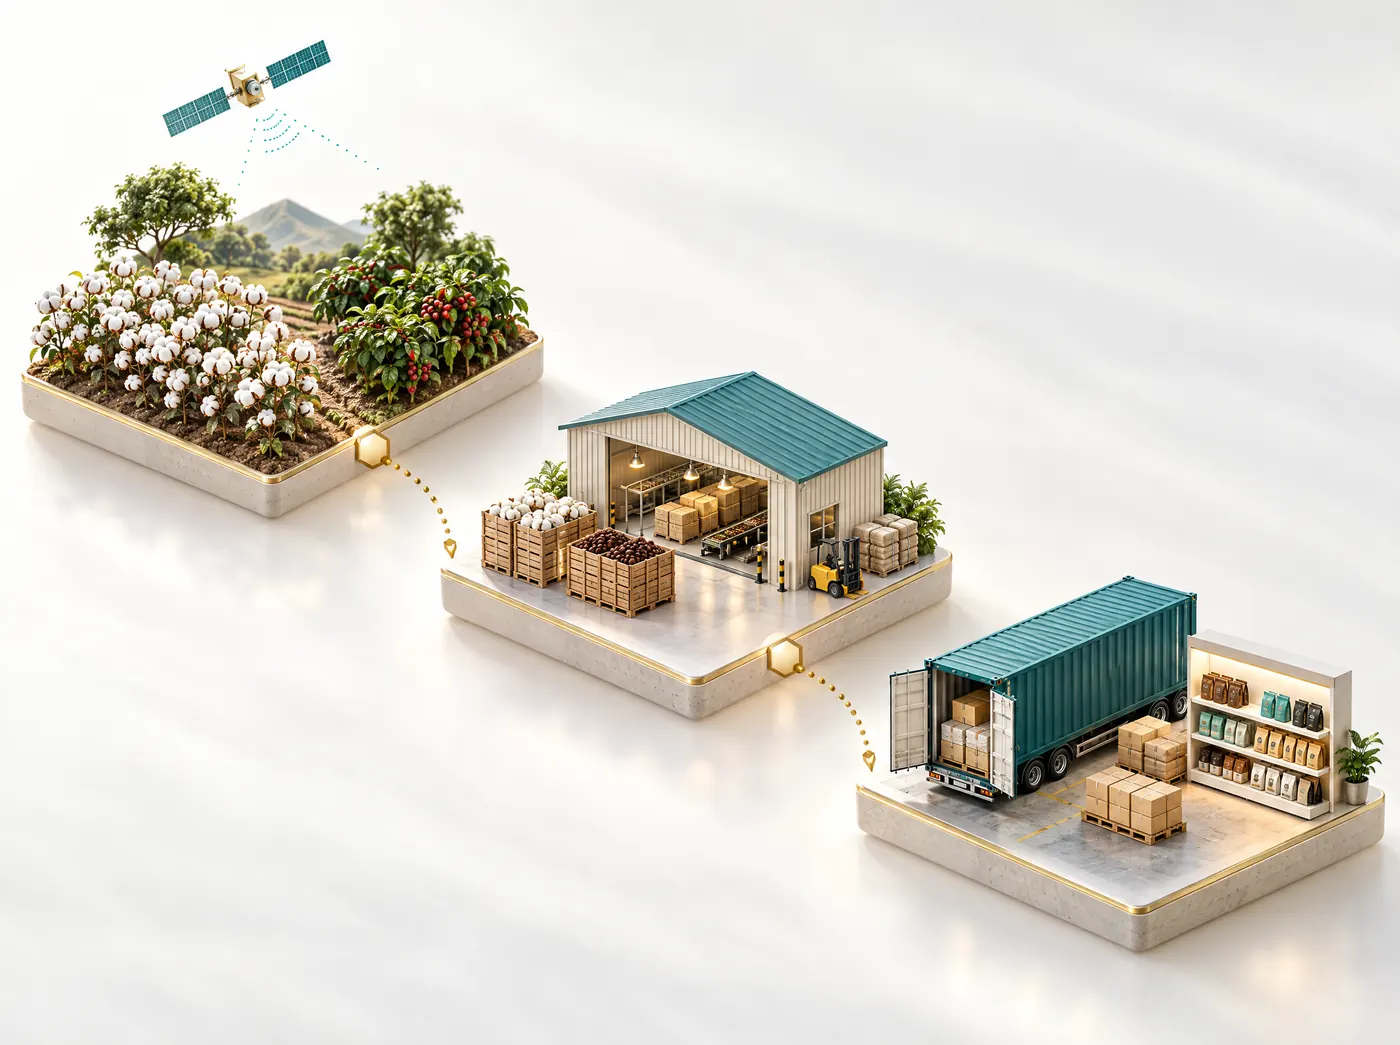
Farm to fork traceability
How a lot is traced back to its plot
We start at the field boundary rather than at the warehouse, where a lot of supply chain traceability software begins. That way each record after it can be traced to a mapped plot that has been checked by satellite.
Map the plot
Each farm plot is drawn or uploaded as a geolocated boundary, linked to the farmer's identity.
Verify by satellite
Satellite images confirm the crop on the plot and check for forest loss since 31 December 2020.
Record each lot
Harvest, collection, processing and packing are written to a Hyperledger Fabric ledger.
Tag and move
RFID tags and QR codes follow the product through storage, transport and retail.
Report and share
Compliance reports for regulators and buyers, and a QR page for consumers.
Applies from 30 Dec 2026
EUDR compliance and plot geolocation
The EU Deforestation Regulation requires anyone placing cattle, cocoa, coffee, oil palm, rubber, soya or wood products on the EU market to prove where they were grown and that the land wasn't deforested after 31 December 2020. The proof has to include the geolocation of every plot.
Our EUDR compliance software helps with your due diligence by supplying the data the regulation asks for: mapped plots, satellite deforestation checks and lots that trace back to those plots.

| What the EUDR asks for | How Farmonaut supports it |
|---|---|
| Geolocation of every plot | Plots are drawn on the map or uploaded as KML, KMZ or shapefiles, and stored with the farmer and the lots they supply. |
| No deforestation after 31 Dec 2020 | EUDR deforestation monitoring compares satellite imagery of each plot from before the cut-off date with today and flags forest loss for review. |
| Traceability from plot to product | Each lot is linked to the plots it came from on a Hyperledger Fabric ledger, through collection, processing and shipping. |
| Due diligence statement | Compliance reports pull plot geolocation, satellite checks and lot records together, ready to support the statement you file. |
| Keeping it current | We keep monitoring the plots after the first check, so any later clearing is flagged as well. |
Regulation (EU) 2023/1115, as amended by Regulation (EU) 2025/2650. Dates and scope from the European Commission's Access2Markets notice; check it for later changes. Farmonaut supports your due diligence. The operator placing the product on the market remains responsible for compliance.
What the blockchain traceability system includes
There are six parts. You can use them together or pick the ones your supply chain needs.
Hyperledger Fabric ledger
Cultivation, harvest, processing, packing and distribution are recorded as time-stamped entries that can't be changed after the fact.
Satellite verification of the plot
Satellite imagery and AI crop analytics confirm what's growing on the plot and how it has been managed, so the supply chain records match what's actually in the field.
RFID tagging
Unique RFID tags identify products and assets in storage, transport and retail, so there's less manual data entry.
Farm-level product identity
Each batch is tied to a specific farm. A QR code shows buyers and consumers the origin, growing practices and certifications.
White-label for brands
Food brands, cooperatives and retailers can run the traceability engine under their own name, with branded QR pages and dashboards.
Compliance reports
Reports built from the traceability record for EU, US, EUDR and organic requirements, which makes audits quicker.
Cotton and honey traceability projects
Two of our longer-running deployments, both on the same platform: a cotton supply chain for a textile client in Europe and honey sourcing for a food brand.
 Cotton traceability · Germany
Cotton records shared from ginner to distributor
For a German textile client, producers, ginners, spinners and distributors all recorded cotton origin, quality and sustainability data in one shared, real-time record, which the brand used to prove responsible sourcing.
Honey traced to the farm and the bucket
For the Dabur group, honey is tracked to the farm it was procured from and down to the individual bucket. A QR scan shows the journey from hive to shelf, which helps guard against adulteration.
Cited in a 2026 research paper
A 2026 paper in the Journal of Enterprise Information Management names Farmonaut as the implementation partner for blockchain-enabled ethical sourcing.
Find it on Google ScholarWho uses our farm traceability software
Everyone in the chain works from the same lot record, but each uses it for something different.
Food and beverage brands
Prove origin and ethical sourcing on pack, and pull a lot back fast if something goes wrong.
Importers, exporters and traders
Collect plot geolocation and deforestation checks from suppliers before goods reach the EU.
Cooperatives and farmer groups
Register members' plots once, then show buyers that each lot comes from a mapped, checked plot.
Textile and fashion brands
Trace cotton from the farm through ginning and spinning to the finished garment.
Retailers
Put a QR code on the pack that shows shoppers which farm the product came from, under your own brand.
Sustainability and compliance teams
Audit-ready records for EUDR, organic and food-safety checks, and data for carbon footprinting.
Which commodities you can trace
The platform is configured per commodity, so the records match how each one is grown, collected and processed.
EUDR commodities
- Cocoa
- Coffee
- Oil palm
- Soy
- Rubber
- Cattle
- Wood
Also supported
- Cotton
- Honey
- Spices
- Fruit
- Grains
- Vegetables

Where paper records fall short
With paper, spreadsheets and certificates, origin usually stops at the collector or the mill. Records can be edited or lost between steps, there's no way to check the land itself, and a recall or an audit means digging through files. Moving the same supply chain onto Farmonaut changes four things:
- Every lot links back to mapped farm plots.
- Ledger entries are time-stamped and can't be rewritten.
- The crop and any forest loss are checked by satellite.
- Tracing a lot or building a report takes a single search instead of a file hunt.
What farm to fork traceability means at lot level
The unit that matters in farm to fork traceability is the lot: a defined quantity of product with its own ID that moves through the chain together. Lot-level traceability means you can take any lot ID, whether it's a bag in a warehouse, a container at port or a jar on a shelf, and list every farm plot that went into it and every handling step since. Tracing forwards, to where a lot went, is what you need in a recall.
Chains handle mixing in three ways: identity-preserved lots stay linked to one farm, segregated chains mix only verified product, and mass balance lets verified and unverified product mix as long as volumes add up on paper. For the EUDR you need the geolocation of every plot behind each lot, and a lot containing product from plots you can't identify can't be shown to be deforestation-free, which is why most EUDR programs work with segregated or identity-preserved lots. Mixing product from many known plots is fine: you carry all their geolocations forward, and our ledger links each lot to every plot it came from.
Plot geolocation requirements
The EUDR asks for the geolocation of every plot where the commodity was produced. Under the regulation's definitions, a plot larger than four hectares (for any commodity except cattle) has to be described as a polygon, with enough latitude and longitude points to trace its perimeter, while a smaller plot can be given as a single point. Coordinates need at least six decimal places. For cattle, the geolocation covers the establishments where the animals were kept. Since the 2025 amendment, micro and small primary producers established in low-risk countries file a one-off simplified declaration instead, so check which category each supplier falls into.
Even where a point is allowed, we'd collect polygons when you can. A deforestation check on a point covers only that spot. A polygon covers the whole field and lets you compare the plot's area with the volume it supplies.
Mistakes we see in plot data
- Points recorded at the farmer's house, the village or the buying center instead of the field.
- Polygons that cross over themselves or overlap a neighbor's plot, usually from walking the boundary with a weak GPS signal.
- Plots that fall inside a protected area or forest reserve.
- Volumes too high for the mapped area, a common sign that product from elsewhere is being passed through.
In Farmonaut, plots are drawn on the satellite map or uploaded as KML, KMZ or shapefiles, and seeing the boundary over current imagery makes misplaced points, self-crossing shapes and overlaps easy to spot when the plot is entered.
Checking plots against the 31 December 2020 cutoff
EUDR deforestation monitoring comes down to one question per plot: was there forest on it at the end of 2020, and is it still there? The regulation uses the FAO definition of forest, meaning land over 0.5 hectares with trees taller than 5 meters and canopy cover above 10 percent, or trees able to reach those thresholds, excluding land mainly in agricultural or urban use.
We compare satellite imagery of each plot from before the cutoff with current imagery and flag tree cover loss inside the boundary for review. Each flag needs a person to review it. Shade trees thinned over old cocoa or coffee, a plantation replanted on its normal cycle, or a fire scar regrowing can all trigger one and turn out fine. A fresh clearing at the edge of a forest block, or a "new" plot that was forest in 2020, is the kind of case that needs action. Record each decision with the evidence.
The EU Observatory on deforestation publishes a global forest cover map for 2020, built by the Commission's Joint Research Centre, which many teams use as one reference layer. It isn't legally binding, and plot-level imagery is still what settles a flagged case. Our seven-step guide to EUDR deforestation monitoring and how remote sensing helps agribusiness meet the EUDR go further into the methods.
What goes into an EUDR due diligence statement
Under the EUDR, a relevant product can be placed on the EU market only if it's deforestation-free, produced in line with the relevant laws of the country of production, and covered by a due diligence statement filed through the EU's information system. In general terms, the statement includes:
- who the operator is;
- the product, its HS code and quantity;
- the country of production;
- the geolocation of every plot the product came from;
- a declaration that due diligence was carried out and found no risk, or only negligible risk.
Behind it sit three steps: collecting information, assessing risk, and reducing any risk that isn't negligible. Because the rules have been amended since 2023, check the Commission's EUDR implementation pages for the current version before you file. Since the 2025 amendment, the statement is filed by the operator who first places the product on the market, and downstream operators and traders keep its reference number instead of filing their own.
Satellite checks answer the deforestation question for a plot. They can't show whether the land was held legally or whether permits were in order, and that part of due diligence needs documents from suppliers. Our compliance reports bring together plot geolocation, satellite checks and lot records to support the statement you file. The operator files it and stays responsible for it.
Where blockchain, RFID and QR codes fit
These three get mentioned together, but they do different jobs.
Blockchain ledger
Our blockchain traceability runs on Hyperledger Fabric, a permissioned ledger. The participants are known organizations such as growers' groups, processors and the brand, there's no cryptocurrency involved, and each entry is time-stamped and shared, so no single party can quietly rewrite it. The limit is worth knowing: a ledger shows a record hasn't changed since it was written, and can't show it was true when it was written. That's why our first record is a mapped plot that has been checked by satellite. How to track food supply chains using blockchain explains ledgers in food chains in more depth.
RFID tags and QR codes
RFID tags can be read without line of sight and many at once, so they suit bins, crates, pallets and bulk bags moving through warehouses and processing plants. They cost more than a printed label, so they usually go on reusable containers or high-value units. A QR code costs almost nothing to print and any phone can read it, which makes it the tool for the consumer end. In the Dabur honey project, a QR scan on the jar shows the journey from hive to shelf; we wrote up how honey traceability with blockchain worked there.
Collecting data from smallholders and cooperatives
Much of the world's cocoa, coffee and rubber comes from smallholders farming a few hectares each and selling through a cooperative, a local collector or a mill. Most of the practical work in a traceability program happens at this stage. What tends to work:
- Register each member and their plots once, through the cooperative, and reuse that record every season.
- Have field staff walk the boundary with a phone or draw it over satellite imagery with the farmer, then check the shape on screen before leaving.
- Record weight, date, farmer ID and collection point at the first sale, so each lot starts life with its list of farms attached.
- Give members something back. The same plot record can feed satellite crop monitoring for their fields, which makes it easier to ask for the data.
The mapping campaign itself is a field-team job. The Agro Admin app assigns plots to staff with deadlines and shows which are done, pending or late.
Choosing agricultural traceability software and rolling it out
Questions to ask any vendor of agricultural traceability software:
- Does the record start at the plot or at the warehouse?
- Can it import the boundary formats your suppliers already have, and flag bad geometry?
- How are deforestation flags reviewed, and is the evidence kept with each decision?
- Does every plot's geolocation stay attached when lots are mixed?
- Who can write to the ledger, and can entries be edited afterwards?
- Can buyer-facing QR pages run under your brand, and does it cover non-EUDR products you trace, such as cotton or honey?
Implementation steps
- Agree the scope: commodities, sourcing regions and the reports you have to file.
- List your suppliers, direct and through cooperatives or collectors.
- Map plots or import existing boundaries, and fix geometry errors.
- Run the satellite deforestation checks and record a decision on every flagged plot.
- Start writing collection, processing and packing steps to the ledger, with RFID where product moves in bulk and QR codes on packs.
- Generate compliance reports and buyer pages, and keep plots under watch so later clearing is caught.
How long this takes depends mostly on step 3: how many plots there are, how many already have usable boundaries, and how easy they are to reach. We usually suggest starting with one commodity in one region and expanding from there.
Questions about agricultural traceability and the EUDR
What is agricultural traceability software?
Agricultural traceability software records where a product was grown and every step it went through afterwards, from harvest and processing to transport and sale. Farmonaut's agricultural traceability software starts at the farm plot, which is mapped and checked by satellite, and records each later step on a blockchain ledger.
How does Farmonaut help with EUDR compliance?
The EUDR requires plot geolocation and proof of no deforestation after 31 December 2020 for cattle, cocoa, coffee, oil palm, rubber, soya and wood. We map each plot, check it against satellite imagery from before and after the cut-off date, link lots to their plots, and produce reports that support your due diligence statement. We support your compliance work, but the operator remains responsible.
When does the EUDR apply?
Under Regulation (EU) 2025/2650, the EUDR applies from 30 December 2026 for large and medium operators and traders, and from 30 June 2027 for micro and small operators. Check the European Commission's EUDR pages for any later changes.
How does satellite deforestation monitoring work?
Satellite images of each plot from before 31 December 2020 are compared with recent images. Loss of tree cover inside the plot boundary is flagged for review, and we keep checking the plot so that later clearing is also picked up.
What is farm to fork traceability?
It's the ability to follow a food product from the plot where it was grown, through harvest, processing and transport, to the shelf, and back again. In practice that means every lot carries an ID linked to its source plots and to each handling step, and "where did this come from?" and "where did it go?" have an answer for any lot.
What plot geolocation does the EUDR require?
Every plot the commodity came from needs geolocation coordinates with at least six decimal places. Plots over four hectares (cattle aside) have to be mapped as polygons; smaller plots can be given as a single point. We'd still recommend polygons where you can get them, because they make the deforestation check far more reliable.
What goes into an EUDR due diligence statement?
In general terms: who the operator is, the product with its HS code and quantity, the country of production, the geolocation of every source plot, and a declaration that due diligence found no or only negligible risk. Our compliance reports bring the plot, satellite and lot data together to support it, and the operator files it.
Does Farmonaut guarantee EUDR compliance?
No software can do that, and we don't claim to. Farmonaut supports your due diligence with plot geolocation, satellite deforestation checks and lot records. Legality checks, the final risk assessment and the statement itself stay with the operator placing the product on the EU market.
Does blockchain prove a product is deforestation-free?
On its own, no. A blockchain ledger shows that records haven't been changed since they were written, but it can't check whether the first record was true. That's why we anchor each lot to a mapped plot that has been checked against satellite imagery from before 31 December 2020.
Why use blockchain for traceability?
A blockchain ledger, Hyperledger Fabric in Farmonaut's case, stores each step as a time-stamped entry shared between participants. Entries can't be quietly changed later, which makes the record more credible to buyers and auditors.
Can consumers see where a product came from?
Yes. Each product or batch can carry a QR code that opens a page with its origin, growing practices and certifications. Brands can show it under their own name with the white-label option.
Which products can be traced?
The platform covers all seven EUDR commodities (cattle, cocoa, coffee, oil palm, rubber, soya and wood) and can be configured for others such as cotton, honey, spices, fruit, grains and vegetables. We've run cotton traceability for a German textile client and honey traceability for the Dabur group.
Can we run it under our own brand?
Yes. The white-label option lets brands, cooperatives and retailers use their own logo, QR pages and dashboards. Contact our team to discuss setup and pricing.
Trace your first lot
Show buyers where it was grown
To scope a project we need your commodity, your sourcing regions and the reports you have to file. From there our team sets up plot mapping, satellite checks and traceable lots.
More Farmonaut solutions

 KJBN Labs
 SFX
SFX BACF Africa
 Doodlakine
 Exurbia Geospatial
 FieldZero
 Indico Company
 Kubota
 FFBS
FFBS Jontra
 Tucor
Tucor
