

Crop monitoring software
Satellite crop monitoring with advice for each field
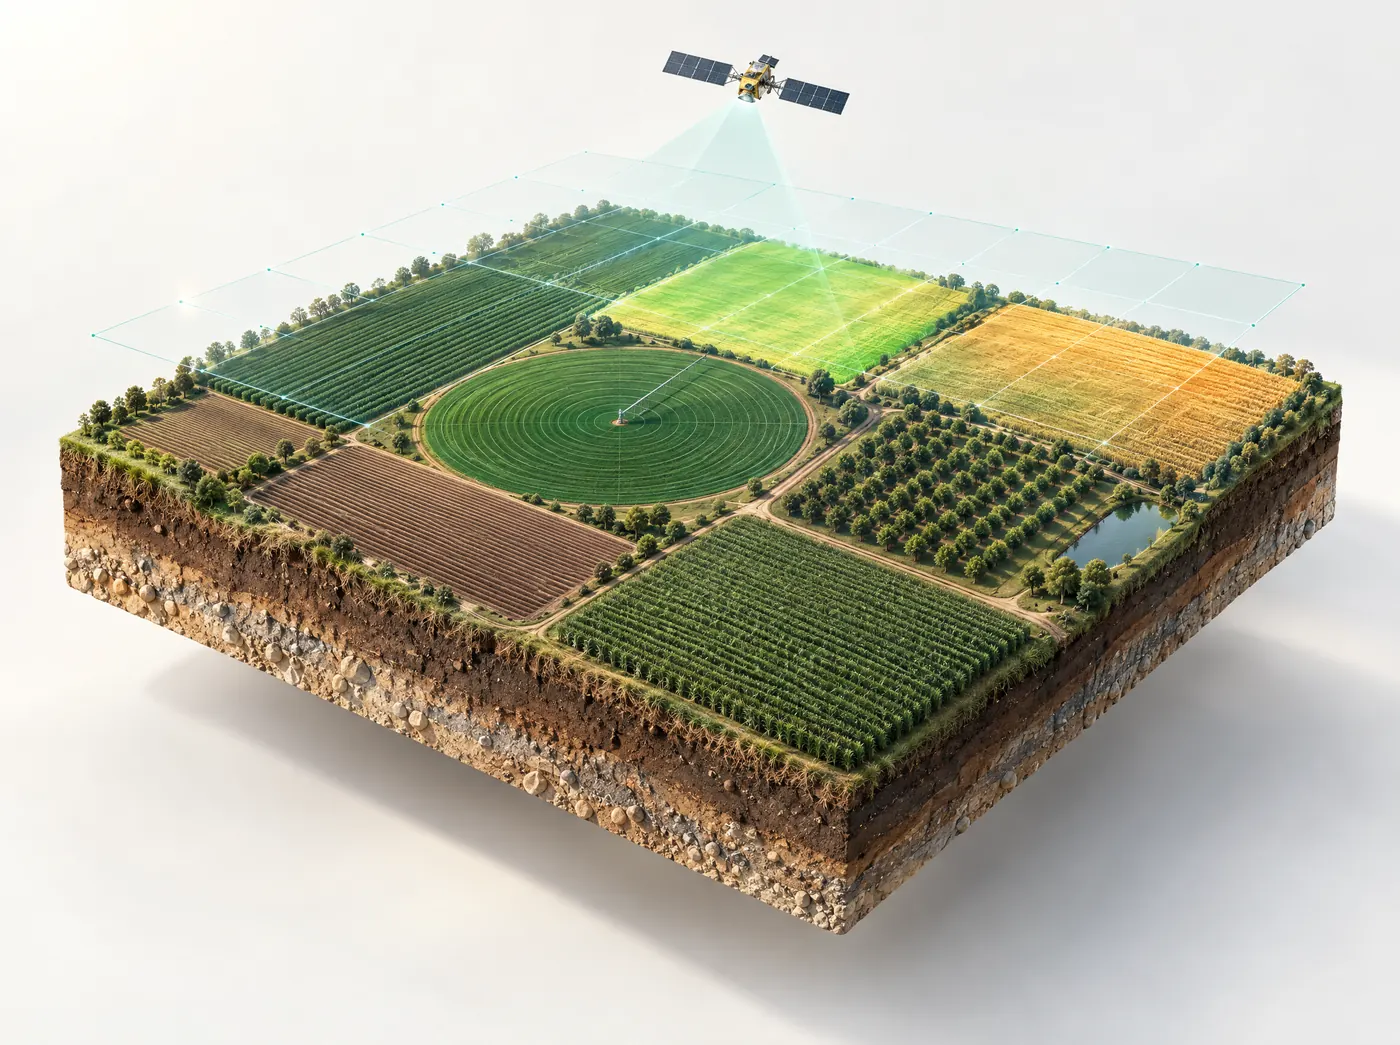
Satellite crop monitoring with Farmonaut starts with your field boundary. You map it once and we keep watching it. Each time a satellite passes over, we update 16 views of the field and turn them into a report on crop health, irrigation in millimeters, soil, expected yield, pest risk and fertilizer. You don't put any equipment in the field, and nobody has to visit it to get the report.
Businesses with fields on the platform
- John Deere
- Kubota
- BayWa
- Elders
- CGIAR
- Esri North East Africa
- Hayleys Agriculture
- Unifrutti Gulf
- Sun Palm Australia
- Dirks Bros Farms
- Gator Blueberries
- Agrotoken
- Pixxel
- Vestlandsforsking
What's in each field report
A greenness map shows where the crop looks weak, but not why or what to do about it. We combine each satellite pass with the field's soil history, the local weather and where the crop is in its season, and work out what the reading means for that field this week. The report has six parts.
How the crop is doing
A health map with five levels, from healthy to very high stress, and the number of acres in each. You can zoom into any patch of the field.
How much water, and when
How many millimeters of water the field needs each day for the next seven days, and the best time to irrigate, worked out from the crop stage and the forecast.
What the soil is like
Readings for acidity, salinity and organic matter, with a short note on what each one means for the crop.
Expected yield and harvest date
Both are estimates. They're updated as the season goes on, and the report explains why they changed.
Pest and disease risk
The pest, disease or weed most likely to show up, with a probability score and two ways to control it (one organic and one chemical).
Which nutrients are short
The status of five nutrients, the dose for each in kilograms, and when to apply it. When a field doesn't need any, the report says "apply nothing".

Optical and radar satellites
How it works
We use two kinds of satellite. Optical sensors pick up color and the near-infrared light that healthy leaves reflect. Radar sees through cloud, smoke and haze, which is why you still get readings in the rainy season.
Add your field
Search for an address and draw the boundary, or upload a KML, KMZ or shapefile. Most people are done in about a minute.
New images come in
Each satellite pass brings a new optical or radar image of the field at 10-meter detail.
We turn pixels into readings
We calculate greenness, early stress, plant water, soil moisture, organic matter and slope, then combine them with the weather and the crop's growth stage.
You get the advice
The report gives water in millimeters, fertilizer in kilograms and pest risk as a probability, along with the reason each item was flagged.
Which satellite view to use when
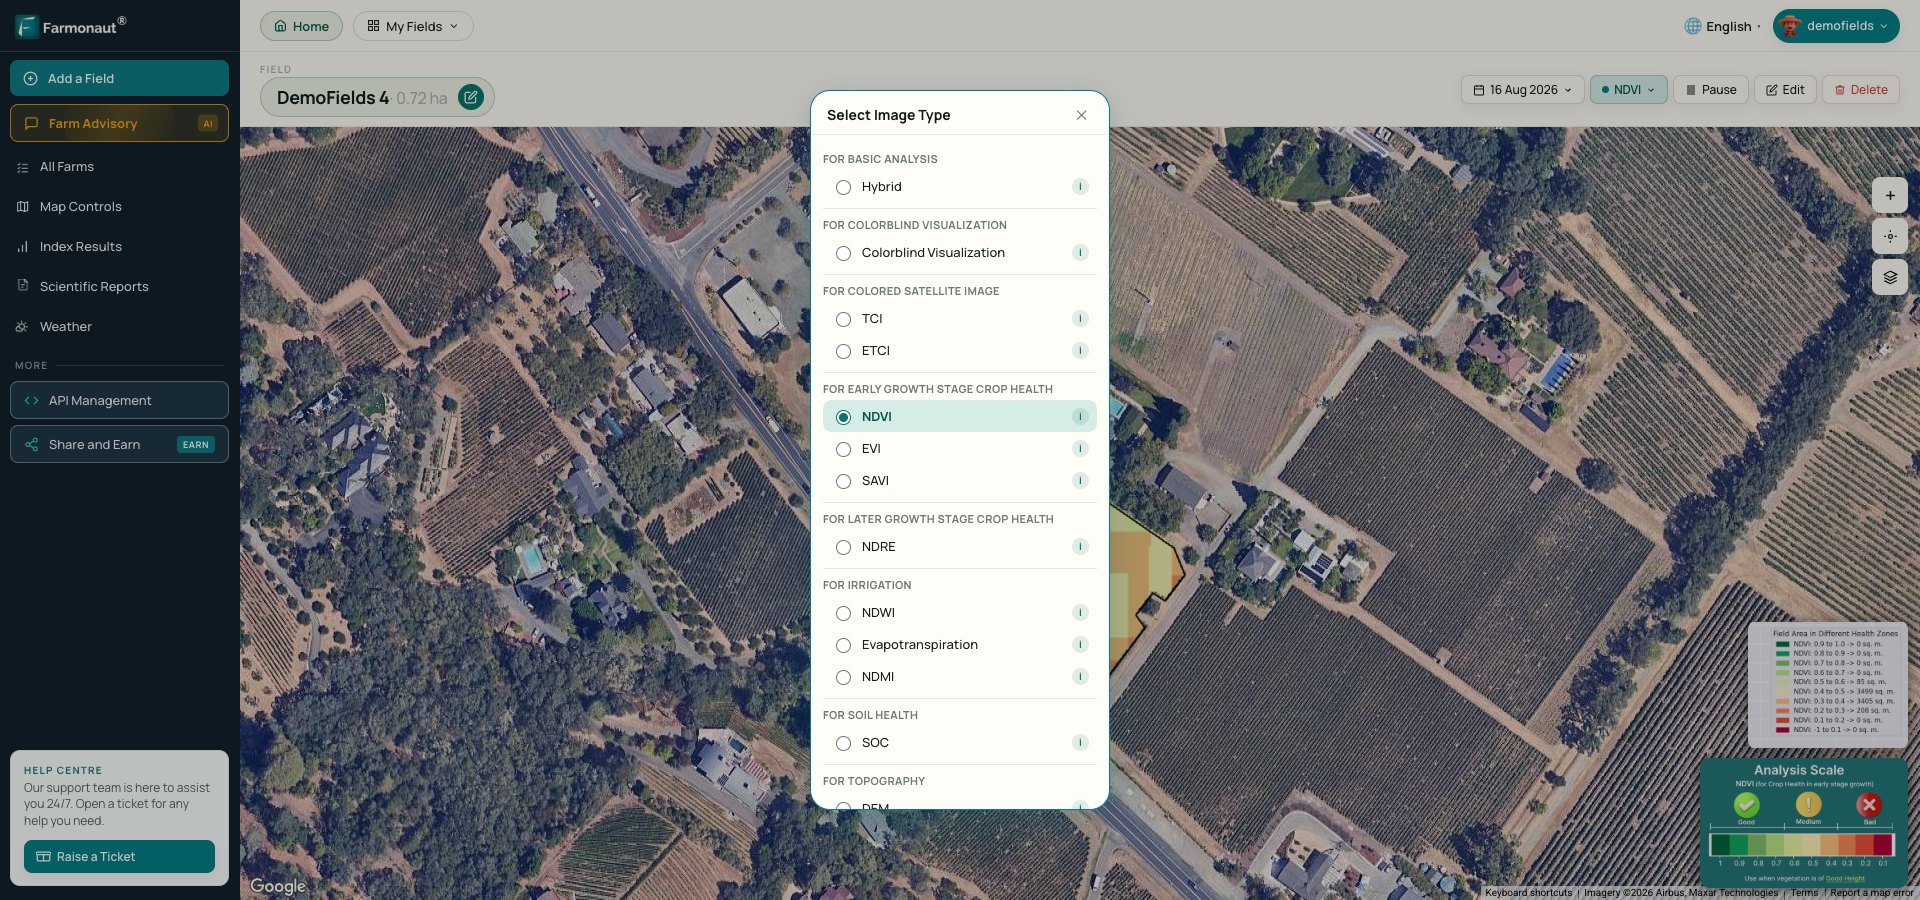
Each field gets 16 satellite views. You can put any two dates side by side or play the whole season back as a timelapse. Different views suit different stages of the crop:
- Young crop: SAVI and EVI pick up early growth even where bare soil throws off a standard NDVI reading.
- Mature crop: NDRE still shows differences in a dense canopy and catches nitrogen stress early.
- Water: NDWI, NDMI and evapotranspiration show how much water the crop and soil hold and how quickly it's being used.
- Soil and terrain: soil organic carbon, elevation and slope.
- Cloudy weeks: radar vegetation index and radar soil moisture.
- NDVI
- NDRE
- EVI
- SAVI
- NDWI
- NDMI
- Evapotranspiration
- Soil organic carbon
- Elevation
- Radar
Used on 166 crops in 135 countries
The same system runs on oil palm estates in Southeast Asia and blueberry farms in Florida, and growers can read the report in their own language.
Results from farms using it
These figures are the customers' own estimates, sent to us through the in-app feedback form. We checked each one against the reports the farm had received.
 Blueberries · Florida, USA
Water and fertilizer cut on 25 blueberry blocks
25 blocks over 124 acres. In one week the reports advised no irrigation on 78 of 175 block-days, and no fertilizer on 8 of the 25 blocks.
Read the story Wheat, barley, alfalfa · Algeria
Less pivot water than a daily schedule
A 190-acre farm got a separate irrigation schedule for each field. On 17 of 28 field-days the advice was not to water, and 40 acres went the whole week without irrigation.
Read the story 70%+Fertilizer advice for a consultancy's 15 client fields
15 fields covering 630 acres of apple, pear, grape, cotton and other crops. The consultancy received 181 reports in 75 days, each based on that crop's growth stage.
Read the storyRemote crop monitoring
How it compares with walking the field
A scout on foot usually covers one line across a block, and only sees stress once the leaf has changed color. How much gets checked depends on who had time that week, and the whole farm tends to run on one irrigation plan. Here's what changes with satellite crop monitoring:
- You get a reading for every 10 meters of the field, on a regular schedule.
- Near-infrared shows stress before the color changes.
- Radar still works through cloud and smoke.
- Each field gets its own daily irrigation plan.
You'll still want to walk the field to confirm what's going on, but the map shows you which part of it to check first.
Who uses satellite crop monitoring
Farmers and growers
Most growers start by checking their weakest field on their phone, then use the water and fertilizer numbers to cut back where the crop doesn't need it.
Agronomists and farm managers
Keep all your clients' fields under one account. You can share a field by link (the other person doesn't need a login) and send each grower a PDF in their language.
Agribusinesses and plantations
Plantations with thousands of plots use the Agro Admin app to manage their field teams.
Lenders and insurers
Check the crop and its expected yield before you lend or settle a claim. More on the crop loan and insurance page.
Software teams
The agriculture data API gives you the same readings to use in your own product.
Web, Android and iOS
How you get the reports
Farmonaut runs in a web browser, and there are Android and iOS apps if you prefer. Most people use the web app and download a PDF when someone else needs a copy.
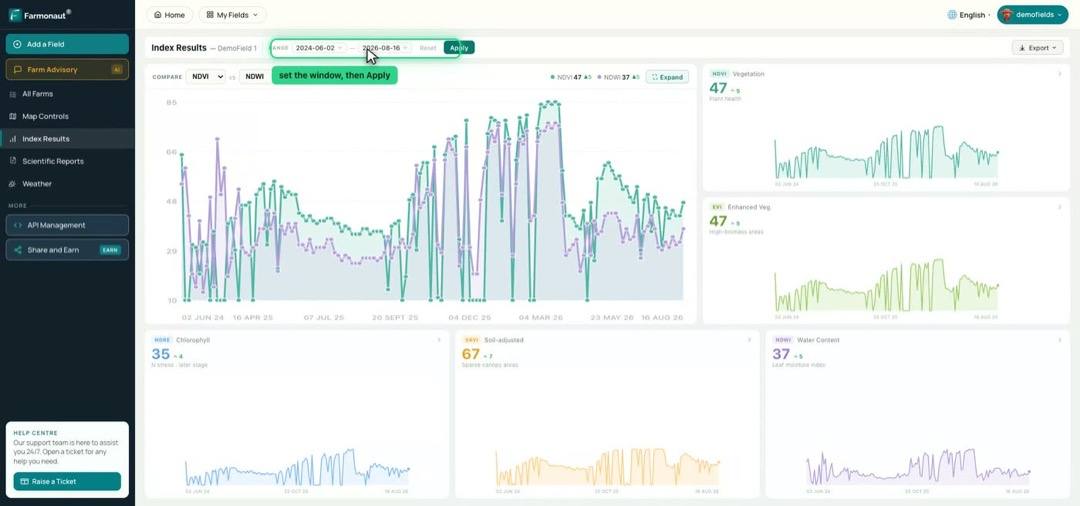
What the satellites measure
Satellite crop monitoring rests on a bit of plant physiology. Healthy leaves absorb most of the red light that reaches them, because chlorophyll uses it for photosynthesis, and they reflect a lot of near-infrared light because of the way the cells inside the leaf are arranged. When a plant runs short of water or nitrogen, or a disease starts to take hold, that balance shifts. The change often shows up in the near-infrared before anyone walking past would see the leaves change color.
Optical satellites
Most crop monitoring software starts from public missions. The European Space Agency's two Sentinel-2 satellites photograph the same spot about every five days between them. Their visible and near-infrared bands have 10 m pixels, and their red-edge and shortwave-infrared bands have 20 m pixels. Landsat 8 and 9, run by NASA and the USGS, add 30 m imagery and a thermal band. Commercial constellations sell near-daily imagery at around 3 m, at a higher price per acre. All optical satellites share one weakness: they can't see through cloud.
Radar satellites
Radar satellites such as Sentinel-1 send out their own microwave pulse and record what bounces back, so they work through cloud, smoke and haze, and at night. The return depends on the structure of the canopy and on the moisture in the plants and the top few centimeters of soil. That's why the radar vegetation index and radar soil moisture are the views to rely on in a wet season.
NDVI, NDRE and the other indices, briefly
An index combines two or more bands into one number per pixel. NDVI is the best known: (NIR − Red) / (NIR + Red), which gives a value between −1 and +1. Bare soil sits near the bottom of the crop range and a dense, healthy canopy near the top. We've written a separate walkthrough of the NDVI formula and how to calculate it, so here is only the short version.
| Index | What it responds to | When to use it |
|---|---|---|
| NDVI | Green biomass and chlorophyll | Comparing zones in a field from emergence to mid-season |
| NDRE | Chlorophyll, through the red-edge band | Dense canopies and in-season nitrogen checks |
| SAVI | Greenness, corrected for bare soil | Young crops and wide-row orchards |
| EVI | Greenness, corrected for haze and soil background | Dense canopies and hazy regions |
| NDMI / NDWI | Water held in the leaves | Catching water stress before plants wilt |
| Radar vegetation index | Canopy structure, seen through cloud | Cloudy or smoky weeks |
The mistake we see most often is reading NDVI late in the season. Once a maize or sugarcane canopy closes, NDVI saturates: most of the field reads high and the differences that matter flatten out. NDRE keeps its range for longer, which is why agronomists switch to it for nitrogen decisions. Our post on NDVI vs NDRE goes through the differences, and the one on EVI vs NDVI explains why the two disagree on thick canopy.
Revisit, resolution and cloud: what to expect
Every vendor quotes a revisit time. The number is real, but a revisit is a chance of an image, and whether you get a usable one depends on the weather. In a dry summer you'll get most Sentinel-2 passes. In a tropical rainy season you can go weeks without a clear optical view, which is the gap radar fills. When you see "real time crop monitoring" advertised from satellites, read it as "updated each time a satellite gets a look at the field". With public satellites that's a few times a week at best.
Resolution matters more than people expect on small fields. A 10 m pixel covers 100 square meters, about a fortieth of an acre, so a 2-acre plot holds roughly 80 pixels. That's plenty to see a weak corner. On a strip narrower than about 30 m, though, many pixels straddle the boundary and mix your crop with a track or the neighbor's field, so treat readings along the edges with care.
A single reading can be thrown off by thin cloud, haze or a field that was irrigated that morning. Before you act on a sudden drop, check whether it holds over the next two passes, and look at the season chart for that field as well as the map.
Reading the field report through a season
What you look for in the report changes as the crop grows. Roughly, by stage:
- Around emergence the field is mostly soil. SAVI and the crop health map show gaps in the stand, waterlogged patches and areas that came up late, which is when replanting decisions get made.
- From rapid growth to canopy closure, compare each pass with the one before. A zone that falls behind its neighbors is the first place to walk. Nitrogen decisions happen here too, so check NDRE alongside NDVI.
- Around flowering and grain fill, water stress costs the most yield. Watch the moisture views and the irrigation plan closely, and check the pest risk after warm, humid spells.
- Toward harvest the canopy dries down and greenness drops on purpose. The yield estimate and harvest date matter more than the health map now.
Acting on the report is mostly a question of where you spend your time. Go to the stressed zone, dig a hole, look at the roots and check the drip line or nozzle. On the farms in our case studies, much of the water saving came from days when the irrigation plan said a block needed none. The AI farm advisory page explains how the water, fertilizer and pest numbers are worked out, and our guide on how to monitor crop health using satellites goes through the health map step by step.
Satellites, drones, scouting and soil probes compared
None of these fully replaces the others, and most well-run farms use two or three of them.
| Method | Detail | How often | Best at | Weak at |
|---|---|---|---|---|
| Satellite | 10 m (around 3 m from commercial providers) | Each pass, cloud permitting for optical | Whole-farm coverage and trends over the season | Single plants and very narrow plots |
| Drone | A few centimeters | Whenever someone flies it | Plant counts, trial plots, a close look at a problem area | Labor, battery life and cost per acre on large farms |
| Scouting on foot | Leaf level | As often as someone walks it | Naming the insect, disease or deficiency | Covers a small share of the field |
| Soil moisture probe | One point, at several depths | Continuous | Root-zone water at that spot, irrigation timing | One location per probe, plus installation and upkeep |
Drones make sense when you need plant-level detail on a small area, such as a research plot or a high-value orchard block, and our piece on drone NDVI mapping covers that side. In the US, commercial drone flights also need an FAA Part 107 certificate. Probes give the most precise root-zone reading at one spot, and IoT crop monitoring systems pair well with satellite maps, which show whether the probe sits in a representative part of the field. Scouting is still the only way to confirm which pest or disease you're dealing with.
How to choose crop monitoring software or a service
Almost every crop monitoring app shows a greenness map now. The differences are in what comes with it. These are the questions we'd ask any vendor, including us:
- Which satellites does it use, and is there radar for cloudy weeks?
- What resolution is each layer delivered at? On Sentinel-2, a 10 m band and a 20 m band show different amounts of detail.
- Does it give an action in units you can use, such as millimeters of water or kilograms of a nutrient, or only a colored map?
- Will it ever recommend doing nothing? Much of the saving comes from weeks when a block needs no water or fertilizer.
- How do fields get in? Drawing works for a few, but KML, KMZ and shapefile uploads save hours on a large farm.
- Can you share a field with an agronomist or buyer who has no account, in their language?
- Is there an API if you want the data in your own farm management system?
- Is it priced per acre, per field or per user, and what happens when you add land mid-season?
If you're comparing options, our roundup of crop scouting and crop monitoring apps covers the wider market. Farmonaut's farm plans are priced by the area you monitor and listed on the pricing page. Agribusinesses, lenders and large estates usually talk to our team about volume.
Getting started with remote crop monitoring
- Pick two or three fields to begin with, ideally one you know well and one that worries you. You'll learn to read the maps faster on ground you know.
- Get the boundaries in. Draw them on the map, or upload a KML, KMZ or shapefile.
- Write down the crop, variety and sowing date for each field. Any advice that depends on growth stage is only as good as that date.
- Look at the first map as a baseline. It often shows old patterns, such as a compacted headland, a wet hollow or the line of a fence that was taken out years ago.
- Walk the weakest zone after the first report and note what you find. That's your own check on the data.
- After a month, compare what the report recommended with what you did, then add the rest of the farm.
Mapping a field takes about a minute, so setup is the quick part. Learning to read the maps against what you see on the ground takes a few weeks.
Questions about satellite crop monitoring
What is satellite crop monitoring?
Satellite crop monitoring uses images from Earth-observation satellites to track how a crop is growing without visiting the field. Optical satellites measure the visible and near-infrared light a crop reflects, which changes when plants are stressed. Radar satellites measure plant structure and moisture, and they work through cloud. We use both to give field-level advice on water, nutrients, pests and yield.
How often is my field updated?
Every few days. Each optical or radar pass over your field produces a new set of readings. On cloudy days, when optical satellites can't see the ground, the radar images keep the record going.
How detailed is the satellite data?
We work at 10-meter resolution, so each 10-meter square of the field gets its own reading. That's enough to see which part of a block is under stress, which is easy to miss on a single walk across the field.
Which crops can be monitored?
166 crops are already monitored on the platform, including oil palm, apple, rice, wheat, cotton, maize, soybean, sugarcane, almonds, cocoa, grapes and avocado. If yours isn't on the list, let us know and we can extend the system to cover it.
Do I need sensors, drones or special hardware?
No. All we need is the field boundary. You can find it by address and draw it on the map, or upload a KML, KMZ or shapefile.
How much does satellite crop monitoring cost?
Plans are priced by the area you monitor. Current prices are on the farm pricing page. For larger estates, or if you're a lender or insurer, contact us for a quote.
Can I add satellite crop data to my own software?
Yes. The Farmonaut agriculture data API returns the same satellite views you see in the web app, the values behind them and the field report as JSON. Seven partners already resell it under their own brand.
Which satellite is best for crop monitoring?
There isn't one best satellite. Sentinel-2 is the workhorse for most crop monitoring software because of its 10 m bands and five-day revisit, Landsat adds a longer record and a thermal band, and radar satellites such as Sentinel-1 keep readings coming through cloud. We combine optical and radar data for each field.
Is satellite crop monitoring useful on small fields?
Yes, down to a field of an acre or two. A 10 m pixel is about a fortieth of an acre, so a 2-acre plot gets around 80 separate readings. Very narrow strips are harder, because pixels along the edge mix your crop with whatever is next to it.
Can satellites monitor crops in real time?
Not continuously. You get a new reading each time a satellite passes and can see the field, which with public satellites is a few times a week at most. Radar helps in cloudy spells, and for minute-by-minute data at one spot a soil moisture probe or weather station is the better tool.
What do I need to start remote crop monitoring?
Only the field boundary, plus the crop you're growing. You can draw the boundary in the web app or upload a KML, KMZ or zipped shapefile, and the first report arrives after the next satellite pass.
Does it replace field scouting?
No, but it makes scouting a lot more targeted, because you know which part of the field to check and what's most likely going on there. Many of the biggest savings come from the days when the report says no water or no fertilizer is needed.
Start with the field you worry about most
Mapping a field takes about a minute. Your first report comes in after the next satellite pass.
More Farmonaut solutions

 CU Foods
 BeyondTech Global
 Consulthink Global
 Rouge VC
 AgroGreen Dynamics
 AgroRisk
 Oath Inc
 Reddane Farming
 Esri North East Africa
 Cresol
 Atur Kuliner
 MDCV UK
 Zerella Group
 Etech Consulting Madagascar
 Vestlandsforsking
 Delicio
 WB Dev
 Sama Premium
 Tres Valles
 LACOS Geoinformation
 Magrifly
 LatConnect 60
