

A practical guide
How to monitor crop health using satellites
This guide covers how to monitor crop health using satellites from start to finish: a clean field boundary, the right imagery and index, reading the maps, how often to look, checking problems on foot and keeping a record. It draws on what we've learned watching fields of 166 crops, and it works whichever software you use.
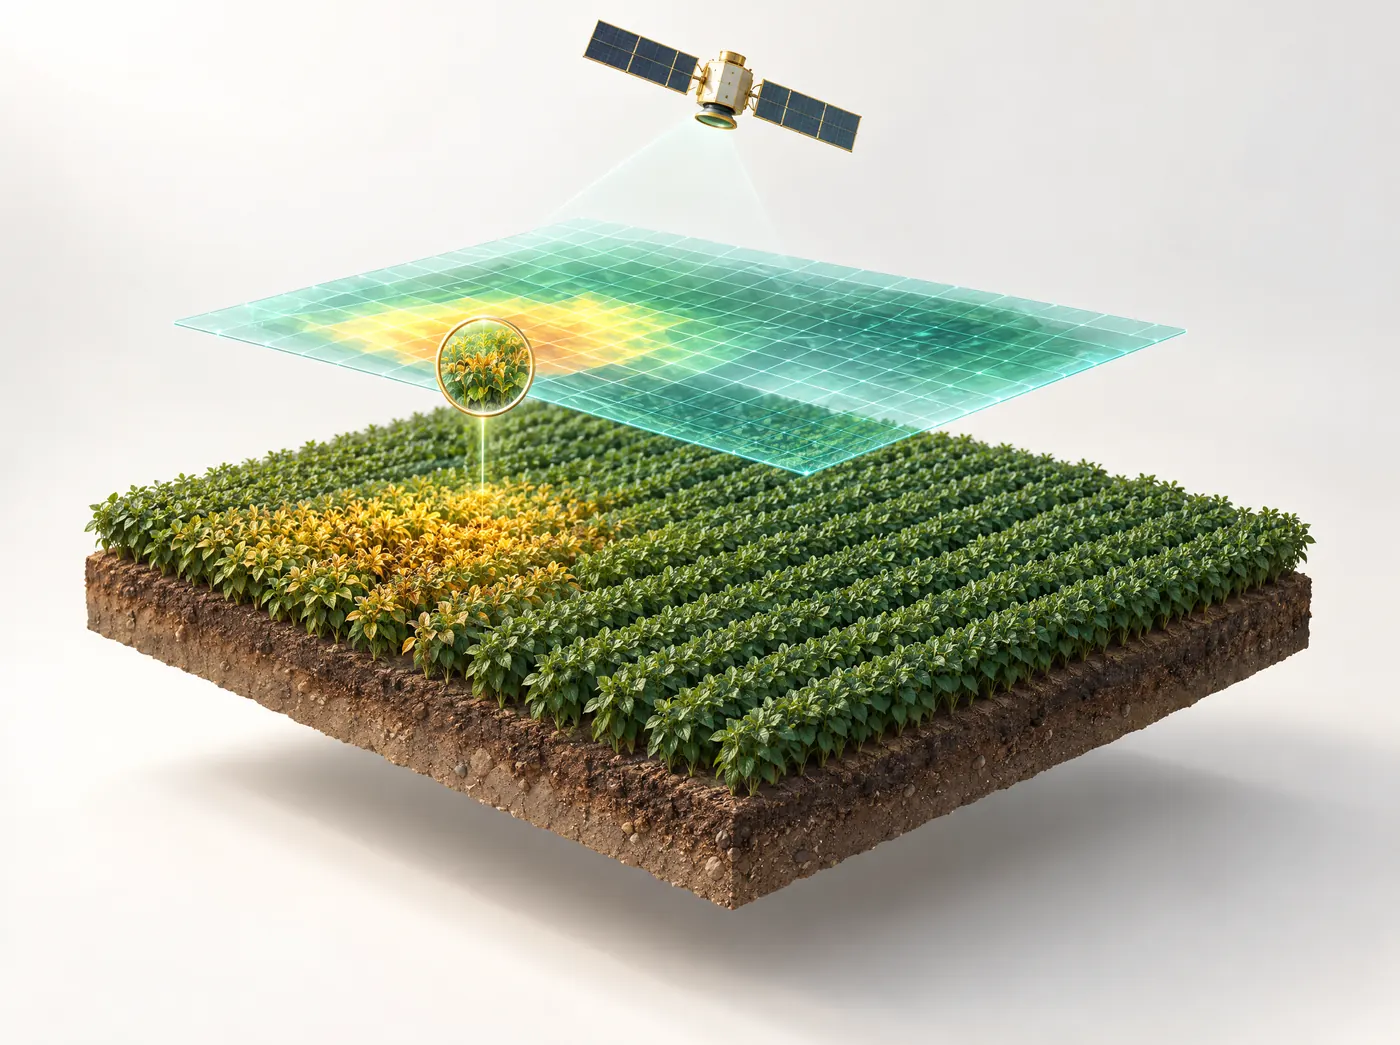
The method in brief
How to monitor crop health using satellites in six steps
Each step has its own section further down.
Map the field boundary
Draw it or upload a KML, KMZ or shapefile. An outline that cuts into a track or the neighbor's crop skews every average later.
Pick imagery and indices
Sentinel-2 for most work, radar for cloudy weeks. Start with NDVI, then add NDRE and NDMI as the season goes on.
Read the map
Look for zones below the rest of the same field. The shape of the pattern often points to the cause.
Set a cadence and alerts
Check every clear pass during fast growth and weekly the rest of the time. Flag a zone only when the drop holds for two passes.
Scout to confirm
Walk the weak zone and a healthy one nearby on the same day, and take a geotagged photo.
Act and record
Treat the area that needs it, note what you found and did, and check the next images.
What a crop health map can show, and what it can't
Healthy leaves absorb most red light and reflect a lot of near-infrared. Stress from drought, hunger or disease shifts that balance, often before the leaves change color, and a satellite records it for every 10 m square. So the map is very good at "where" and "since when", and much weaker at "why".
Still needs someone in the field
- Which insect, disease or weed is causing the damage
- Which nutrient is short, without a tissue or soil test
- Problems on single plants or rows narrower than a pixel
Shown on the satellite map
- Which parts of the field are weaker than the rest
- When a zone started to fall behind, and how fast
- Whether the problem is spreading or holding steady
Step 1: Get the field boundary right
Every number you'll look at later is an average or a comparison inside the boundary, so a sloppy outline costs you accuracy all season. Drawing on a basemap is fine for a handful of fields. For more, export the boundaries from your farm management or machinery software as KML, KMZ or a shapefile (zip the .shp, .shx, .dbf and .prj files together) and upload them in one go.
Keep the edge out of your averages
A 10 m pixel on the boundary line usually mixes your crop with a headland, a track or the next field, which drags down the edge of almost every map. Ignore the outer ring of pixels when you look at field averages, or draw the boundary a few meters inside the real edge. On a 40-acre block you lose very little area.
Split fields that aren't managed as one
If half a field was sown two weeks later, or one end carries a different variety, map the parts separately. Otherwise the later half looks worse all season and the map keeps flagging a difference you already know about. Note the crop, variety and sowing date for each field too, since reading a map against growth stage depends on it.
Step 2: Choose the imagery and the index
For most fields the starting point is Sentinel-2, the European Space Agency's optical mission. It photographs most farmland about every five days, with 10 m pixels in the blue, green, red and near-infrared bands and 20 m pixels in the red-edge and shortwave-infrared bands. Landsat 8 and 9 add 30 m imagery and a thermal band. Sentinel-1 radar covers cloudy weeks, and commercial constellations sell near-daily imagery at around 3 m for high-value crops.
Use atmospherically corrected surface reflectance (Level-2A for Sentinel-2). If you skip that correction, a hazy day shifts your index values and two dates become hard to compare. Then pick the index that answers your question:
| Your question | Index to use | Why |
|---|---|---|
| Where is the crop thinner or weaker? | NDVI | Tracks green biomass until the canopy closes |
| Is a dense canopy short of nitrogen? | NDRE | The red-edge band keeps its range after NDVI flattens out |
| Is it a young crop or a wide-row orchard? | SAVI | Corrects for bare soil showing between the plants |
| Is the crop running short of water? | NDMI | Shortwave infrared responds to water held in the leaves |
| Can't get a clear optical image? | Radar vegetation index | Radar sees through cloud, smoke and haze |
NDVI is (NIR − Red) / (NIR + Red) and runs from −1 to +1; the USGS explanation of NDVI and our walkthrough of the NDVI formula cover the math. For water, see the USGS page on NDMI and our guide to NDWI, NDMI and evapotranspiration. Whatever index you use, keep a true-color image open beside it. That's how you tell a weak crop from a cloud shadow, a flooded hollow or a strip that was just cut.
Step 3: Read the crop health map
Compare zones inside the same field first
Read an NDVI map in relative terms. A wheat field at 0.55 might be fine in early spring and a worry by late May, so the number alone says little. What matters is a zone clearly below the rest of the same field on the same date. Most tools stretch the colors across the field's own range, which makes differences easy to spot but can make a very even field look patchy. Check the scale before you worry: a field running from 0.62 to 0.68 is in good shape even if half of it is orange.
As a rough guide for NDVI, bare soil sits around 0.1 to 0.2, a young or sparse crop around 0.2 to 0.5, and a dense, healthy canopy between 0.6 and 0.9. Water and snow fall below zero, which our note on negative NDVI values explains.
Read the shape of the pattern
The outline of a weak zone is often the best clue to its cause:
| Pattern on the map | Usual causes | What to check |
|---|---|---|
| Straight stripes along the direction of travel | Planter skips, a blocked nozzle, spreader gaps or overlaps | Machine logs and the line on the ground |
| Circles or arcs | Center pivot problems: a stuck tower, worn nozzles, the end gun | Pivot run records and the nozzle chart |
| Blobs that follow low or high ground | Waterlogging in hollows, drought on knolls, a change of soil | Elevation layer, soil map, recent rainfall |
| Patches that grow over several passes | Pests, disease or weeds spreading from an edge or a hot spot | Scout the margin of the patch |
| The whole field drops at once | Haze or thin cloud, a storm, frost, or the crop maturing | True-color image, weather, growth stage |
Look at the trend over several passes
Thin cloud, smoke or a field irrigated that morning can pull a reading down for a day. Before you act, put the latest map next to the previous two passes and look at the zone's season curve. A real problem keeps falling away from the rest of the field. A glitch recovers on the next clear image.
Step 4: Decide how often to look and what triggers a visit
Satellite crop health monitoring works best on a routine. During rapid growth and around flowering, look at every usable pass. Early in the season and near harvest, once a week is enough, and a late-season drop in greenness is usually just the crop maturing.
Alerts help only if they're rare enough that people act on them. A reasonable starting rule: flag a zone that sits 10 to 15 percent below the field median on NDVI or NDRE for two clear passes in a row and covers at least half an acre. Adjust the rule once you see how often it fires for nothing.
Agree who walks the field when an alert fires, and within how many days. In busy weeks, alerts without an owner pile up unread.
Step 5: Scout to confirm what the map shows
The map shows you where to go, but only someone standing in the crop can say what's wrong. Open the map on your phone so your position shows over the weak zone, walk straight to it, and then:
- Visit the weak zone and a healthy zone nearby on the same day. The contrast between the two is what makes the diagnosis.
- Walk the edge of a spreading patch, where pests and disease are usually most active.
- Dig a hole. Look at root depth, any compaction layer and how moist the soil is at 15 and 30 cm.
- Check whether yellowing is on older leaves or new growth; each points to different nutrients.
- Look at the irrigation in that zone: emitters, nozzles, pressure.
- Take a geotagged photo and a short note so the observation sits on the same map as the image.
If you find nothing wrong, note it (a sandy patch that always reads low, say) and stop chasing it. For nutrient questions, separate tissue or soil samples from the weak and healthy zones are often the cheapest way to settle it. Our article on crop stress detection covers the common causes.
Step 6: Act on the zone and keep a record
Once you know the cause, treat the area that needs it where you can: a spot spray on the infested patch, new nozzles on one pivot span, or a variable-rate nitrogen map drawn from the NDRE zones. Then watch the next two or three passes. If the zone catches up, the fix worked. If it keeps falling, go back out.
Keep a simple log for each field (a spreadsheet is fine): image date, what the map showed, what you found and what you did. After one season you'll know which patterns are real problems and which are permanent features, like a sand lens or an old fence line. After two or three you can see whether the poor zones are shrinking. The same history is handy when a lender, insurer or buyer asks how the crop was managed, which is where satellite checks for crop loans and insurance come in.
Timing through the season
What to watch at each crop stage
The same map means different things at different points in the season. This is how we read it through a typical annual crop.
- Emergence
Stand and gaps
The field is mostly soil, so NDVI is low everywhere. Use SAVI and true color to find gaps in the stand, waterlogged rows and late patches before replanting decisions.
- Rapid growth
Zones falling behind
A zone growing more slowly than its neighbors is your first scouting target. Nitrogen decisions fall here too, so bring in NDRE as the canopy closes.
- Flowering
Water and disease
In most crops, water stress around flowering costs the most yield. Watch NDMI and the radar moisture views, and look harder for disease after warm, humid spells.
- Grain fill
Late stress
NDVI is near its peak and stops showing differences, so rely on NDRE and NDMI. A patch that fades early can mean drought, disease or lodging.
- Harvest
Planned decline
Greenness falls as the crop dries down, as it should. Use the timing of that decline to plan harvest order, since the fields that brown first are usually ready first.
Cloud, haze and when to use radar
Cloud is the biggest practical limit on optical crop health monitoring. A five-day revisit is a chance of a picture every five days, and in a tropical rainy season you can go weeks without a clear look. Three things help.
First, mask what you can't trust. Sentinel-2 Level-2A data comes with a scene classification layer that marks cloud, cloud shadow and snow. Shadows are the trap: they make a healthy crop look stressed, so a dark blob next to a bright one in true color deserves suspicion.
Second, use radar. Sentinel-1 carries a C-band radar that sends its own signal and records the echo, so it works through cloud and at night. The echo depends on the canopy's structure and water content and on surface soil moisture. Radar vegetation indices follow crop growth reasonably well but are noisier than optical ones and react to wet leaves and row direction, so read them as a trend over several dates.
Third, combine sources. Landsat and Sentinel-2 together give more chances of a clear image, and merging optical with radar keeps the record going through the wet season. Farmonaut does this for every field it monitors.
Common mistakes when monitoring crop health from satellite images
Most bad calls we see come from a few habits:
- Reading NDVI late in the season. Once a maize or sugarcane canopy closes, NDVI saturates and the whole field reads high. Switch to NDRE for in-season nitrogen decisions; our post on NDVI vs NDRE explains why.
- Comparing fields that aren't comparable. Different crops, varieties and sowing dates give different values on the same day.
- Acting on one image. Wait for the next clear pass, and check true color for cloud shadow before anyone goes out.
- Treating the map as the diagnosis. A red zone is a reason to walk the field. It isn't a reason to spray it.
- Not writing anything down. Without notes you'll scout the same sandy corner every season.
- Expecting real-time data. Public satellites give a new view a few times a week at best. For hourly soil moisture, use a probe; IoT crop monitoring pairs well with satellite maps.
Comparing tools for crop health monitoring using remote sensing
There are five broad ways to get the data, and many farms combine two. The right mix depends on your acreage, who reads the maps and whether you want advice or only imagery.
| Option | What you get | Works well for | Trade-offs |
|---|---|---|---|
| Open data viewers, such as the Copernicus Browser | Raw imagery and standard indices for any date | Checking a few fields and learning to read indices | Everything is manual; no field history or advice |
| Code platforms, such as Google Earth Engine | Full image archives and any analysis you can write | Researchers, analysts and large portfolios | Needs someone who writes and maintains code |
| Crop monitoring software | Saved fields, automatic processing, charts and often advice | Farms, agronomists and agribusinesses | Subscription cost; advice quality varies widely |
| Drones | Centimeter-level images whenever you fly | Trial plots, plant counts and a close look at one problem area | Labor, flight rules and cost per acre on large farms |
| In-field sensors | Continuous readings at one point | Irrigation timing at a representative spot | One location per sensor, plus installation and upkeep |
For whole farms watched all season, satellites are usually the cheaper base layer, with drones (see our piece on drone NDVI mapping) and probes added where they answer a specific question. Our roundup of crop scouting apps covers the wider app market.
What to ask before you choose a crop health monitoring system
Nearly every product shows a greenness map now. These questions separate them:
- Does it mask cloud and cloud shadow automatically, or will you have to spot them yourself?
- Can you see each field's season curve and compare any two dates?
- How far back does the image history go? Past seasons tell a recurring weak zone from a new one.
- Is there radar for cloudy weeks?
- Does it suggest an action in usable units, such as millimeters of water, or only show colors?
Then try it on a field you know well. If the map matches what you know about that ground, you can start trusting it elsewhere.
Doing it in Farmonaut
Following these steps in Farmonaut
Our web app handles steps 1 to 3 and updates each field as new passes arrive. The scouting and the decisions stay with you.

Common questions about monitoring crop health
How do you monitor crop health using satellites?
You map the field boundary, then look at vegetation index maps such as NDVI from each new satellite pass and compare zones within the field. When a zone falls behind and stays behind, you walk it to find the cause, fix it and record what you did. Software can handle the imagery, but the field check is still a person's job.
What is the best index for crop health?
There isn't a single best one. NDVI works well from emergence until the canopy closes, NDRE is better for dense canopies and nitrogen checks, SAVI suits young crops and orchards with bare soil between rows, and NDMI is the one to watch for water stress.
What NDVI value means a healthy crop?
A dense, healthy canopy usually reads between 0.6 and 0.9, a young or sparse crop between 0.2 and 0.5, and bare soil around 0.1 to 0.2. The right value depends on the crop and its growth stage, so compare zones within the same field rather than chasing a fixed number.
What is crop health monitoring using remote sensing?
It means measuring a crop's condition with sensors that don't touch it, usually on satellites, aircraft or drones. They record how plants reflect light or scatter radar, and those readings change when plants are stressed.
What does a crop health monitoring system include?
An imagery source, processing into indices, saved field boundaries, maps and season charts, and a way to flag zones that fall behind. Better systems add cloud masking, radar and advice in units you can act on, such as water in millimeters.
How often can satellites check my fields?
Sentinel-2 passes over most farmland about every five days, and Landsat 8 and 9 together add another look about every eight days. Cloud cuts the number of usable optical images, but radar satellites such as Sentinel-1 see through it.
Can satellites detect pests and diseases?
They detect the stress that pests and diseases cause, often as a patch that grows from one pass to the next. They can't tell you which insect or pathogen it is. Risk models that combine weather with the crop stage help narrow it down, but you confirm it in the field before you spray.
Does it work on small fields?
Yes, down to an acre or so. A 10 m pixel covers about a fortieth of an acre, so a 1-acre field gets roughly 40 readings. Long, narrow strips are harder because edge pixels mix in whatever is next door.
Can satellite data predict yield?
It can estimate it. How green a crop gets and how long it stays green are closely linked to final yield, so estimates improve as the season goes on. Farmonaut's field report includes a yield estimate and expected harvest date that update with each pass.
Do I still need to scout if I use satellite monitoring?
Yes. Satellite monitoring makes each scouting trip shorter and better aimed, but naming a pest, disease or nutrient problem still takes someone in the field, and sometimes a lab test.
How much does satellite crop health monitoring cost?
Sentinel-2 and Landsat images are open data that anyone can download, so the main cost is the time to process them or the software that does it for you. Farmonaut plans are priced by the area you monitor, and current prices are on the farm pricing page.
Try the method on a field you know well
Map one field, compare the first map with what you know about that ground, and decide from there.
More Farmonaut solutions

 Rouge VC
 Yutz Automation
 AgroGreen Dynamics
 Leher
Leher AgroRisk
 Oath Inc
 Reddane Farming
 Esri North East Africa
 Cresol
 Atur Kuliner
 MDCV UK
 Zerella Group
 Etech Consulting Madagascar
 Vestlandsforsking
 Delicio
 WB Dev
 Sama Premium
 Prochecker
 Tres Valles
 LACOS Geoinformation
 Magrifly
 LatConnect 60
 Blickwinkel
