

Reviewed September 2026 against USDA NASS Kansas Statistics and K-State Mesonet climatology.
Try it: Enter your figures above. →
Kansas planted 7.30 million acres of winter wheat for the 2025 crop year and harvested 6.80 million of those acres, producing 346.8 million bushels at a yield of 51 bushels per acre — up 8 bushels per acre from 2024, according to USDA NASS Kansas Statistics. That single dataset answers most of what growers, buyers, and analysts search for around Kansas wheat: how many acres were planted, how many were actually cut for grain, and what the state-average yield came out to. The rest of this article breaks those numbers down further, places them against national winter wheat production, and walks through the Feekes growth-stage scale that determines when those acreage and yield numbers actually get locked in each season.
Kansas Winter Wheat Production: The Core Numbers
Kansas is the largest hard red winter wheat producing state in the country, and its NASS Cooperative Projects report is the primary reference point for planted acres, harvested acres, yield, and total production by crop year. For the 2025 crop year the state’s figures were:
| Metric | 2025 Crop Year Figure | Change vs. 2024 |
|---|---|---|
| Planted acres | 7.30 million acres | See NASS history report for year-over-year comparison |
| Harvested acres | 6.80 million acres | ~93% of planted acres cut for grain |
| Yield | 51 bushels per acre | +8 bushels per acre |
| Total production | 346.8 million bushels | +13% |
The gap between planted and harvested acres — 500,000 acres in 2025 — is normal for Kansas winter wheat and is not automatically a sign of crop failure. Some acres are abandoned to winterkill or drought, some are hayed or grazed out rather than combined, and some are switched to another crop after a poor stand. A harvested-to-planted ratio in the low-to-mid 90% range, as seen in 2025, is a healthy season by Kansas standards; ratios that drop into the 70s or below typically signal widespread abandonment from drought or winter injury.
For the current crop year’s figures, USDA NASS republishes the Kansas wheat history report annually after harvest — the NASS Kansas Wheat History report is the direct source for planted acres, harvested acres, and yield, while the Kansas Annual Crop Summary confirms the harvested-acres and production totals independently. Both are free PDF downloads and both update once the harvest is complete and tabulated, typically by late summer of the harvest year.
Winter Wheat Production Nationally: Where Kansas Fits
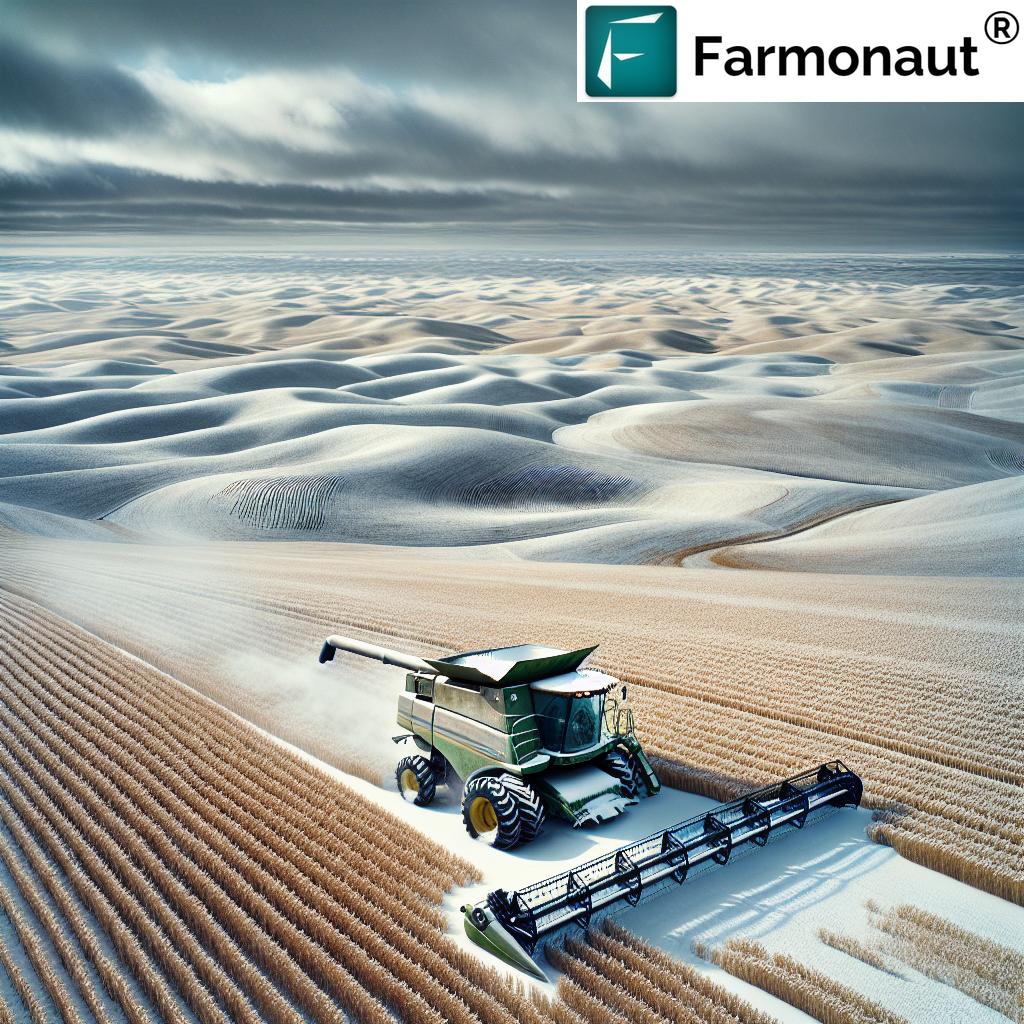
Kansas’s 346.8 million bushels in 2025 makes it the top-producing winter wheat state, but national winter wheat production spans dozens of states from the Great Plains through the Pacific Northwest. USDA’s WASDE report — the World Agricultural Supply and Demand Estimates — is the authoritative source for the national production forecast and the season-average farm price, released on a fixed monthly schedule (typically around the 10th of each month). The January 2026 WASDE put the US wheat season-average farm price forecast at $4.90 per bushel for the 2025-26 crop year.
State-level winter wheat production for the full list of producing states — not just Kansas — is published in NASS’s Small Grains Summary, released annually after harvest is complete nationwide, usually in September. That report is the correct source to check winter wheat production by state rather than relying on any single state’s release, since state reports are published on staggered timelines. If you’re comparing Kansas against Oklahoma, Texas, Nebraska, Colorado, or the Dakotas for a given crop year, the Small Grains Summary is the one document that lines all of them up on the same basis.
Wheat Crop Stages: The Feekes Scale
Every acreage, yield, and condition number above is anchored to a point on the wheat plant’s growth cycle — crop condition ratings, freeze-risk assessments, and fungicide-timing decisions are all expressed relative to growth stage, not calendar date, because the same physiological stage can fall weeks apart in different years depending on planting date and temperature. The Feekes scale is the standard reference used across Kansas and the broader winter wheat belt to describe those stages:
| Feekes Stage | Growth Stage | Why It Matters for Management |
|---|---|---|
| 1 | Seedling emergence, one shoot | Stand establishment check; basis for fall crop condition ratings |
| 2-3 | Tillering begins | Tiller count drives yield potential; herbicide timing window |
| 4-5 | Leaf sheaths lengthen and strengthen (winter dormancy period) | Cold-hardening; snow cover during this window reduces winterkill risk |
| 6 | First node (jointing) visible | Green-up; nitrogen top-dress and herbicide cutoff for most products |
| 7-8 | Second node, flag leaf emerges | Fungicide timing for foliar disease; late freeze most damaging here |
| 10 | Boot stage, head fully enclosed in flag leaf sheath | Final pre-heading fungicide window |
| 10.5 | Heading complete | Flowering follows within days; fusarium head blight risk window |
| 11 | Ripening: milk, dough, then hard kernel | Harvest timing; test weight and moisture determined here |
The jump from Feekes 4-5 (winter dormancy) to Feekes 6 (jointing/green-up) is the single most consequential transition for Kansas wheat, because it marks the end of the plant’s cold tolerance. A crop that breaks dormancy early after a warm spell and is then hit by a hard freeze at Feekes 6-8 can lose yield even if fall establishment and winter survival were both strong — which is why crop condition ratings can swing sharply between a state’s February and April reports even without a change in acreage. Satellite-based NDVI monitoring, such as the field-level vegetation tracking in the Farmonaut app, gives growers a way to watch green-up timing on their own fields in near-real time rather than waiting for the next state condition report.
Kansas Weather and Climate Context
Kansas’s east-west precipitation gradient is wide enough that a single statewide weather summary is close to meaningless for wheat planning — the state’s long-term climate normals (1981-2010) from K-State’s Mesonet climatology program show why. Southeastern Kansas averages up to 45 inches of annual precipitation and a 58°F annual mean temperature, the wettest and warmest corner of the state, while southwestern Kansas averages as little as 18 inches of precipitation a year — a more than twofold difference across the same state in the same crop year. Snowfall follows a different gradient entirely: northwest Kansas receives the state’s heaviest snow, 28 to 42 inches in a normal year, which matters directly for winterkill risk since snow cover insulates dormant wheat crowns during hard freezes.
| Kansas Region | Annual Precipitation (1981-2010 normal) | Annual Snowfall (1981-2010 normal) | Annual Mean Temperature |
|---|---|---|---|
| Southeast | Up to 45 inches (highest) | Lower than northwest | 58°F (warmest) |
| Southwest | 18 inches (lowest) | Lower than northwest | Cooler than southeast |
| Northwest | Mid-range | 28 to 42 inches (highest) | Coolest |
These are long-term normals, not a forecast for any specific December or growing season — the brief behind this article located the 1981-2010 baseline figures from K-State’s climatology program but not day-by-day or month-specific readings for any single recent winter. For current-season weather — including any specific month’s conditions across the Kansas wheat belt — the K-State Mesonet climate data library publishes updated station data and historical comparisons, and is the correct place to check actual conditions against these normals rather than relying on a fixed figure in any article.

Wheat Prices: What Kansas Growers Are Seeing at the Elevator
Production numbers only tell half the story — the other half is what that grain is worth. USDA’s Agricultural Marketing Service publishes daily hard red winter wheat bids out of the Kansas City Board of Trade, the primary cash-price reference for Kansas growers. As of the September 2026 report, Kansas City hard red winter wheat bids ranged from $5.38 to $5.68 per bushel, depending on protein content and delivery point. That’s noticeably above the $4.90 per bushel season-average farm price USDA WASDE forecast for the 2025-26 crop year as a whole, reflecting the spread between a full-season average and a specific point-in-time cash bid.
Because these are daily cash bids, they move constantly with basis, protein premiums, and futures prices. The USDA AMS Kansas City Board of Trade daily wheat report republishes fresh bids every trading day and is the correct reference to check for a current price rather than any fixed number in this article. The research behind this piece did not locate current protein-content premiums or discounts for the 2025-26 Kansas crop specifically; the AMS daily report breaks bids out by protein tier, so growers pricing grain against a specific protein test should check that report directly rather than using a single blended average.
Estimating Your Own Field Yield
State averages are a starting point, not a substitute for a field-level number. The calculator below uses the same acres-times-yield arithmetic behind the state total — 6.80 million harvested acres and 51 bushels per acre producing 346.8 million bushels — but lets you run it against your own acreage, yield estimate, and the current cash price you’re seeing at your elevator.
Enter your figures above.
Assumptions: this calculator does not account for basis, protein premiums or discounts, drying costs, or storage fees — it multiplies net harvested acres by yield and cash price only. Check the AMS daily report linked above for the protein-adjusted price at your specific elevator before using this for a marketing decision.

Grazing and Dual-Purpose Acres
Part of the gap between Kansas’s 7.30 million planted acres and 6.80 million harvested acres is explained by dual-purpose management — wheat planted with the intent of grazing cattle on it through fall and winter before either pulling cattle off for a grain harvest or grazing it out entirely. This practice is more common in Oklahoma and Texas than in Kansas, but it happens across the southern and central Plains wherever wheat pasture supplements cattle forage in the fall and winter months. Well-timed grazing, pulled off before the crop reaches Feekes 6 (jointing), does not necessarily reduce grain yield and can stimulate tillering; grazing that continues past jointing removes the growing point and eliminates that acre’s grain potential for the season.
Monitoring Wheat Fields Through the Season
Because Kansas conditions vary so sharply by region — the precipitation and snowfall gradients above make a single statewide condition rating a rough average at best — field-level monitoring tools give growers a way to track their own acres against the state and county picture. Satellite vegetation-index tracking, weather data layered onto field boundaries, and yield-prediction modeling are available through the Farmonaut web app and mobile apps, with programmatic access available through the Farmonaut API for operations integrating satellite and weather data into their own farm management systems.




How to Check Next Season’s Numbers Yourself
Every figure in this article is a snapshot of a data series that updates on a predictable schedule, and the same sources will carry the next crop year’s numbers when they’re published:
- Kansas planted acres, harvested acres, and yield: published annually by USDA NASS in the Kansas Wheat History report and the Kansas Annual Crop Summary, typically finalized in late summer/early fall after harvest. Check the NASS Kansas Wheat History report for the current release.
- National winter wheat production by state: published annually in NASS’s Small Grains Summary after all states’ harvests are in, generally by September.
- National production forecasts and season-average farm price: published monthly in USDA’s WASDE report, typically around the 10th of each month; the next scheduled update after this article’s review date is October 2026.
- Daily cash wheat prices: published every trading day by USDA AMS in the Kansas City Board of Trade report, linked above.
- Kansas weather and climate data, including any specific month’s conditions: maintained by K-State’s Mesonet climate data library, updated continuously against the 1981-2010 normals cited in this article.
Bookmarking those five sources — rather than this article’s figures alone — is the durable way to track Kansas winter wheat production, price, and weather from one crop year to the next.
Frequently Asked Questions
- How many acres of winter wheat did Kansas plant?
Kansas planted 7.30 million acres of winter wheat for the 2025 crop year and harvested 6.80 million of those acres, per USDA NASS Kansas Statistics. - What was the Kansas winter wheat yield?
51 bushels per acre for the 2025 crop year, up 8 bushels per acre from 2024, according to the NASS Kansas Wheat History report. - What was total Kansas winter wheat production?
346.8 million bushels for the 2025 crop year, a 13% increase over 2024 production. - What are the main growth stages of wheat?
The Feekes scale runs from seedling emergence (stage 1) through tillering (2-3), winter dormancy (4-5), jointing/green-up (6), flag leaf emergence (7-8), boot (10), heading (10.5), and ripening to harvest (11). Jointing (Feekes 6) marks the end of the plant’s cold tolerance and is the key transition for freeze-risk management. - Where can I find winter wheat production by state?
USDA NASS’s Small Grains Summary, published annually after all states’ harvests are complete, lines up planted acres, harvested acres, yield, and production across every winter wheat producing state on the same basis. - What is Kansas wheat selling for right now?
Kansas City Board of Trade hard red winter wheat bids ranged from $5.38 to $5.68 per bushel as of the September 2026 USDA AMS report; check the AMS daily report for the current bid, since cash prices move daily.
Earn With Farmonaut: Affiliate Program
Earn 20% recurring commission with Farmonaut’s affiliate program by sharing your promo code and helping farmers save 10%. Onboard 10 Elite farmers monthly to earn a minimum of $148,000 annually—start now and grow your income!
Farmonaut Subscriptions

 Proto9
 TVS Electronics
 BW Pipelines
 WICO
WICO Gen Chayat
 Chimera Innovation
 SkyHarvest
 Polaris Digitech
 Teledarbas
 Wild Oak Farm
 SFX
SFX BACF Africa
 Doodlakine
 Exurbia Geospatial
 FieldZero
 Indico Company
