

Reviewed September 2026 against the Crop Protection Network’s 2024 loss estimates and USDA NASS’s Agricultural Chemical Use Program.
Try it: Enter your numbers above to see the comparison. →
Precision pest control means scouting, mapping and treating pest pressure at the sub-field level instead of spraying a whole field on a calendar. It matters because pest losses are large and unevenly distributed: invertebrate pests cut US corn yield by 4.0% in 2024, a loss the Crop Protection Network put at 609 million bushels across 29 states and Ontario, and most of a typical field never needed the treatment applied to all of it. This article breaks down where those losses concentrate, what precision tools actually change, and gives you a way to check your own numbers.
Table of Contents
- The Scale of Crop Pest Losses in the US
- What “Spectrum” Means in Pest Control
- Precision Pest Control vs. Calendar Spraying
- Corn: Rootworm and the Nitrogen Connection
- Soybeans and Cotton: Where the Money Goes
- The Toolset: Satellite Monitoring, Scouting, and Variable Rate
- Calculator: Estimate Your Scouting-vs-Blanket Spray Cost
- Building a Precision Pest Program: Step by Step
- FAQ
- Try it: Enter your numbers above to see the comparison.
The Scale of Crop Pest Losses in the US
Pest pressure is not evenly distributed across a field or a season, and the aggregate numbers show why blanket treatment is expensive relative to the damage it prevents. The Crop Protection Network’s 2024 loss estimates, compiled from field trial and extension data across 29 US states plus Ontario, found that invertebrate pests reduced corn yield by 4.0%, equal to 609 million bushels. Corn rootworms alone accounted for 342.4 million bushels of that loss — more than half the total invertebrate damage from a single pest complex.
Soybeans showed a smaller but still costly picture: a 1.4% yield reduction from invertebrate pests across 19 states in 2024, alongside $843.5 million spent on herbicides and insecticides for soybean pest management that same year, according to the Crop Protection Network’s soybean loss report. Cotton losses in 2024 ran higher on the disease side: a 5.4% yield reduction from disease, totaling 827,042 bales nationally.
These figures come from Crop Protection Network’s peer-reviewed, multi-state loss estimate program, which is republished annually. You can pull the current year’s figures directly from their corn invertebrate loss estimate and the parallel soybean invertebrate loss estimate, both indexed under cropprotectionnetwork.org/publications, updated each September or October.
What “Spectrum” Means in Pest Control
Spectrum pest control refers to how narrowly or broadly a treatment acts against target organisms. A broad-spectrum insecticide kills a wide range of insects, including beneficial predators and pollinators, on contact or ingestion. A narrow-spectrum or selective product targets a specific pest group — for example, a Bt-based product active against corn rootworm larvae but with minimal effect on non-target insects.
The spectrum decision interacts directly with precision pest control because narrow-spectrum products only pay off if you know where the target pest actually is. Spraying a broad-spectrum product across an entire field is a hedge against not knowing where the pressure sits. Spot-treating with a narrow-spectrum product only works if your scouting or imagery has already told you which zones justify it. This is the practical link between the “spectrum” question and the “precision” question: precision tools reduce the guesswork that broad-spectrum products are designed to cover for.
USDA NASS’s Agricultural Chemical Use Program gives a sense of how skewed input use already is toward blanket, insurance-style application: in 2018, 97% of US corn acres were treated with herbicides, but only 13% received insecticides. Soybeans followed a similar pattern in 2020 — 98% of acres treated with herbicides versus 18% treated with insecticides. That gap between near-universal herbicide use and much lower insecticide use suggests insect pest pressure, when it does occur, is already treated more selectively than weed pressure — precision pest control extends that same logic to targeting insecticide zones instead of insecticide-treated acres wholesale.
Precision Pest Control vs. Calendar Spraying
The table below compares the two approaches directly, using the figures cited above rather than generic claims.
| Factor | Calendar / Blanket Spraying | Precision Pest Control |
|---|---|---|
| Basis for treatment | Fixed schedule or whole-field decision | Zone-level scouting data, imagery-based stress maps, or economic thresholds |
| Acres actually needing treatment | 100% treated regardless of pressure distribution | Only flagged zones treated; corn insecticide use nationally sits at 13% of acres (2018, USDA NASS) |
| Documented cost impact | No offsetting savings captured | Yield mapping combined with variable rate technology saved an average $25/acre on US corn farms (USDA ERS, 2016) |
| Adoption level (variable rate pesticide) | Remains the majority approach | 8.6% of US crop acres used variable rate pesticide application, 2016–2019; 14% of US farmers used it as of 2015 (USDA ERS) |
| Best fit | Uniform, low-variability fields; early-season broad-spectrum weed control | Fields with known hotspots (rootworm-prone zones, historical flea beetle edges, disease-prone low areas) |
The USDA Economic Research Service’s $25-per-acre figure comes specifically from combining yield mapping with variable rate technology (VRT) on corn — it is a documented cost saving, not a yield gain, and it is the only figure of its kind in USDA ERS’s public data on precision agriculture economics. USDA ERS has not published a more recent update to this specific corn VRT cost-savings figure since the 2016 Amber Waves analysis; check USDA ERS’s precision agriculture cost analysis directly for any newer release.
On adoption, USDA ERS’s most recent public figures for variable rate pesticide application are also several years old: 8.6% of planted crop acres between 2016 and 2019, and 14% of US farmers as of 2015. No 2020–2026 update to this specific adoption rate has been published in USDA ERS’s charts-of-note series as of this review; the current figure should be checked directly against USDA ERS’s variable rate technology adoption chart rather than assumed to have grown at any particular rate.
Corn: Rootworm and the Nitrogen Connection
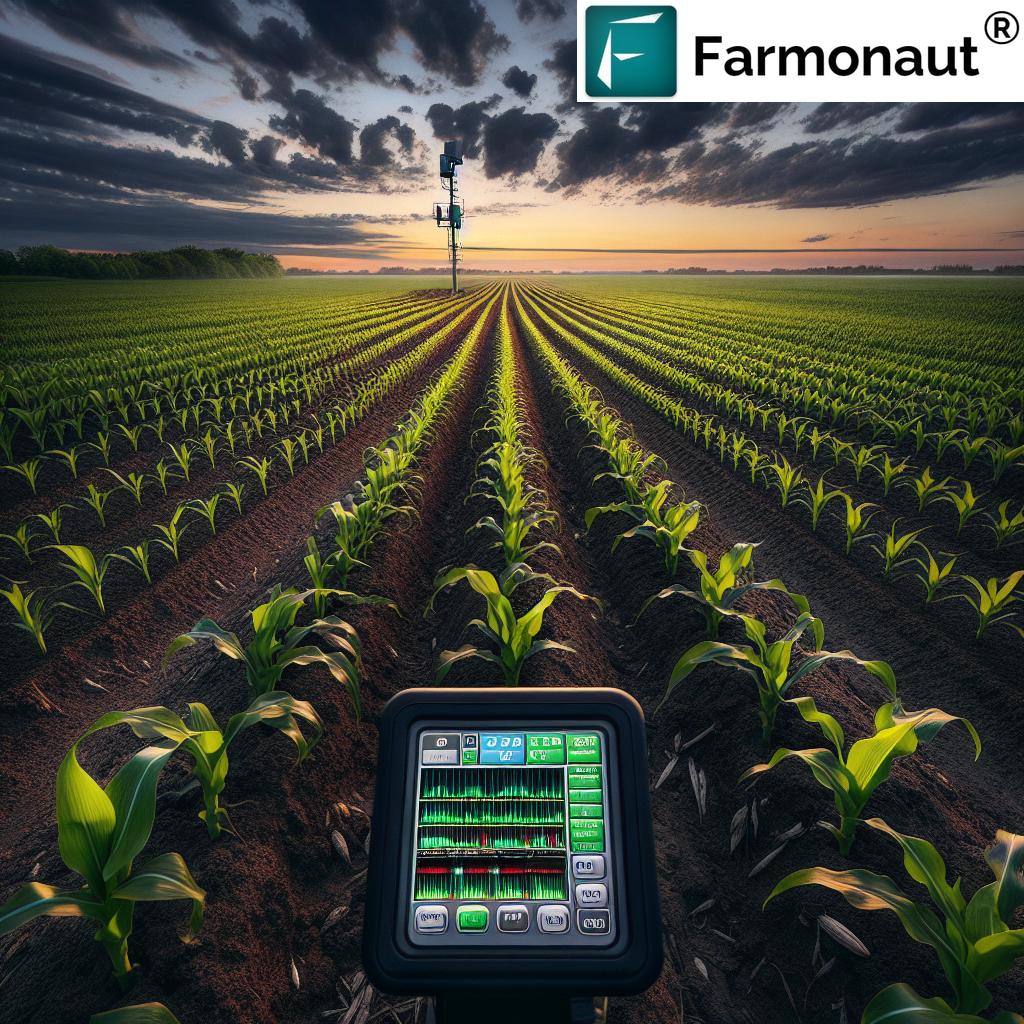
Corn rootworm is the single largest invertebrate pest cost in US corn production, responsible for 342.4 million of the 609 million total bushels lost to invertebrate pests in 2024 — more than every other invertebrate pest combined. Rootworm larvae feed on root tissue below ground, which is part of why the damage is easy to underestimate from surface scouting alone: a field can look uniform above ground while root pruning is already cutting into water and nutrient uptake in specific zones.
This is where pest management and nitrogen management overlap in practice. Root-pruned corn takes up nitrogen less efficiently, so a zone with heavy rootworm pressure will often show up as a nitrogen deficiency symptom — pale, stunted plants — even when soil nitrogen levels are adequate. Diagnosing that correctly matters: applying more nitrogen to a rootworm-damaged zone treats a symptom, not the cause. A structured nitrogen management approach, including a Pre-sidedress Nitrate Test to establish actual soil nitrogen status, helps separate a true nutrient deficiency from a pest-driven uptake problem before more input is applied.
Satellite-based vegetation health monitoring is a practical way to locate these zones before yield is lost. Farmonaut’s platform tracks vegetation indices across a field over the growing season, which surfaces stress zones early enough to investigate on the ground — whether that turns out to be rootworm feeding, nitrogen deficiency, or something else. The broader set of precision agriculture solutions built around this kind of monitoring extends the same zone-detection logic to other pest and disease scouting tasks across the farm.


Soybeans and Cotton: Where the Money Goes
Soybean invertebrate pests caused a comparatively modest 1.4% yield reduction across 19 states in 2024, but the input cost side tells a different story: $843.5 million was spent on herbicides and insecticides for soybean pest management that year, per the Crop Protection Network’s soybean loss estimate. That gap — a small yield loss against a large input bill — is exactly the pattern precision targeting is meant to close: much of that spend goes onto acres where pest pressure never reached an economically damaging threshold.
USDA NASS’s chemical use data backs this up structurally: 98% of soybean acres were treated with herbicides in 2020, compared with only 18% treated with insecticides. Herbicide use is close to universal because weed competition is close to universal; insecticide use is already selective because insect pressure genuinely isn’t. Precision pest control tries to bring that same selectivity to the herbicide side and sharpen it further on the insecticide side, since even an 18%-of-acres treatment rate can still include acres where pressure was below the point where treatment pays for itself.
Cotton’s 2024 numbers point the other direction — disease, not insects, was the dominant loss driver, at 5.4% yield reduction and 827,042 bales nationally, according to the Crop Protection Network’s cotton disease loss estimate. That distinction matters for a “pest control” search because disease scouting and insect scouting use different indicators (lesion patterns and canopy discoloration versus feeding damage and trap counts), even though both benefit from the same underlying zone-mapping approach.
The Toolset: Satellite Monitoring, Scouting, and Variable Rate
Three tool categories make up most working precision pest control programs, and they answer different questions:
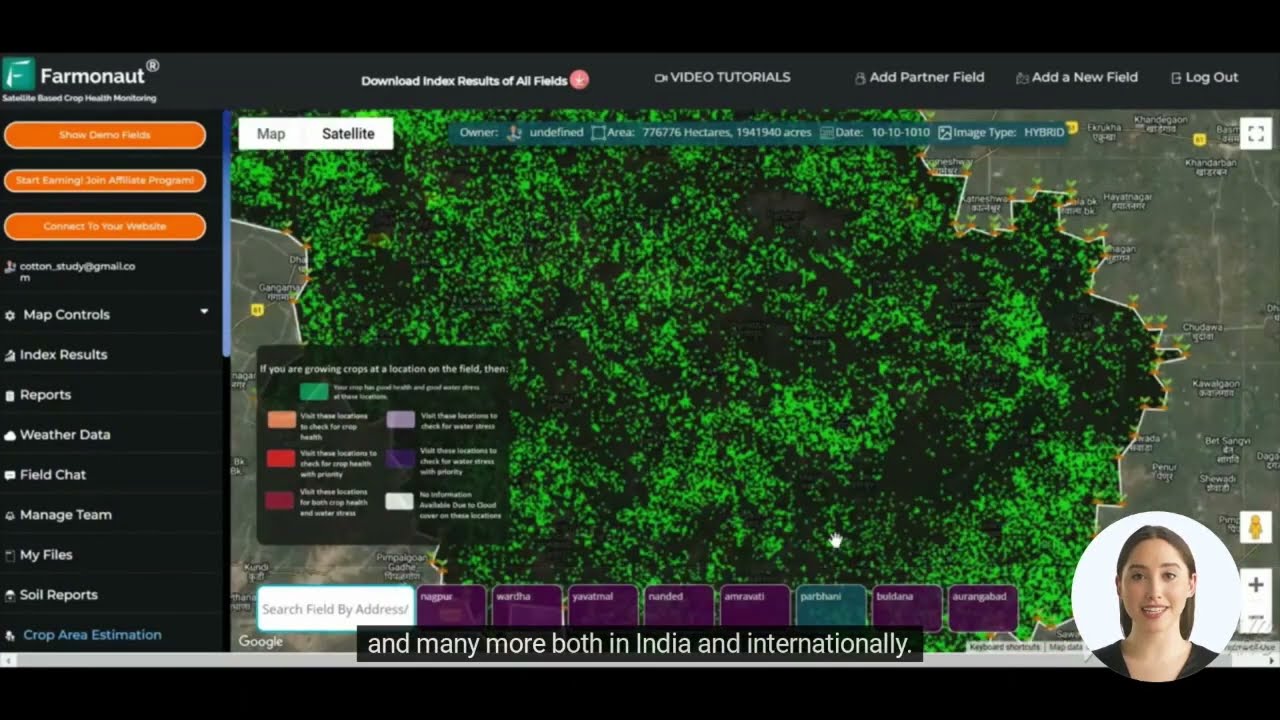
- Satellite and aerial vegetation monitoring — answers “where is stress showing up, and is it spreading or stable?” Farmonaut’s satellite crop monitoring tracks vegetation health indices field-by-field through the season, flagging zones that diverge from the rest of the field for ground-truthing.
- Scouting with economic thresholds — answers “has this pest reached a level where treatment cost is justified by the loss it prevents?” This is unglamorous but is what actually determines whether the 13% of corn acres or 18% of soybean acres treated with insecticides (USDA NASS figures above) is the right acreage this season, or whether it should be higher or lower.
- Variable rate application equipment — answers “given a stress or pest map, how do I apply input only where the map says to?” This is the step where the $25/acre USDA ERS savings figure and the 8.6% VRT-for-pesticides adoption rate actually get realized or left on the table.
Disease scouting for cereals and other crops follows the same logic as pest scouting: regular field inspection for early lesion or discoloration signs, cross-referenced against known fungal disease identification strategies, catches problems before they reach the scale reflected in cotton’s 5.4% disease loss figure.


Calculator: Estimate Your Scouting-vs-Blanket Spray Cost
Use your own field size, per-acre spray cost, and the share of acres your scouting or imagery data flags as actually needing treatment to see the potential difference against a full-field blanket application.
Enter your numbers above to see the comparison.
Building a Precision Pest Program: Step by Step
This is the durable part of the process — the steps below don't expire when this year's loss figures are superseded by next year's Crop Protection Network release.
- Establish a baseline map. Pull two to three years of yield monitor data or satellite vegetation index history for each field to identify zones that consistently underperform. Persistent low zones are more likely to be pest- or drainage-related than random-year weather effects.
- Ground-truth flagged zones. A stress signal from imagery is a lead, not a diagnosis. Walk the zone, dig roots where rootworm is suspected, check undersides of leaves for insects, and confirm before choosing a treatment.
- Apply an economic threshold, not a calendar date. Compare the cost of treatment against the value of the yield it protects, using your own current input costs and expected crop price — this determines whether the 13–18% NASS insecticide-treated-acreage range (corn and soybeans respectively) is right for your specific field this season.
- Match spectrum to the confirmed pest. Once a pest is identified and past threshold, select the narrowest-spectrum effective product to preserve natural predators in untreated zones, rather than defaulting to a broad-spectrum product across the whole field.
- Apply with variable rate equipment where the map supports it. This is the step that converts a stress map into an actual cost difference — skipping it means you've built a precision map but still executed a blanket spray.
- Re-scan post-treatment. Confirm the treated zones recovered and untreated zones stayed stable; feed this back into next season's baseline map.
This loop — map, verify, threshold, match spectrum, apply variably, re-check — holds regardless of which pest, which crop, or which year's loss numbers you're working from. It's the checklist to keep even after the 2024 figures cited throughout this article are replaced by newer data.

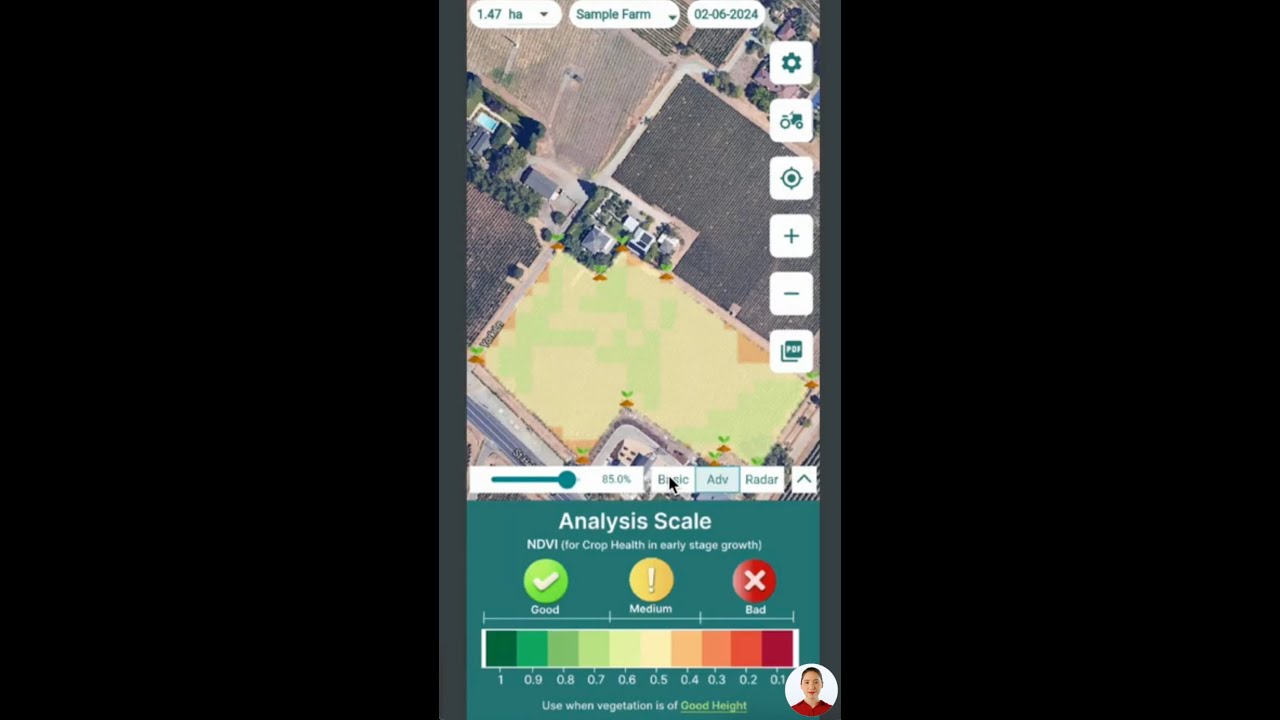
Farmonaut's satellite monitoring and AI-driven advisory system are built for step 1 and step 6 of this loop specifically — building the historical baseline and re-scanning after treatment — while leaving the ground-truthing and threshold decision to the grower, where local knowledge matters most. Businesses and government programs managing pest monitoring across many fields or regions can integrate this data directly through Farmonaut's API for custom integrations, and developers can review the full technical specification in the Farmonaut satellite and weather API developer docs.

FAQ: Precision Pest Control
- Q: What is precision pest control?
A: It's treating pests based on zone-level data — scouting reports, satellite vegetation stress maps, or economic thresholds — rather than spraying an entire field on a fixed schedule. The goal is to apply insecticide or fungicide only where pest or disease pressure has reached a level that justifies the cost. - Q: How much do pests actually cost US row crop farmers?
A: In 2024, invertebrate pests cut US corn yield by 4.0% (609 million bushels) across 29 states and Ontario, with corn rootworm responsible for 342.4 million of those bushels alone. Soybean invertebrate pests cut yield 1.4% across 19 states the same year, alongside $843.5 million spent on herbicides and insecticides. These figures are from the Crop Protection Network and are republished annually — check their publications page for the current year's estimate. - Q: What does "spectrum" mean in pest control products?
A: Spectrum describes how many types of organisms a product affects. Broad-spectrum products act against a wide range of insects, including beneficial ones; narrow-spectrum or selective products target a specific pest. Precision pest control makes narrow-spectrum products more viable because you know in advance which zones actually have the target pest. - Q: What's the actual cost saving from precision technology versus blanket spraying?
A: USDA ERS documented an average $25/acre cost saving on US corn farms from combining yield mapping with variable rate technology, as of its 2016 analysis. This is a cost-side figure, not a yield gain — no separate national yield-gain figure specific to precision pest application has been published as of this review. - Q: How many US farmers actually use variable rate pesticide application?
A: USDA ERS reported 8.6% of planted crop acres used variable rate pesticide application between 2016 and 2019, and 14% of US farmers had adopted it as of 2015. No more recent adoption figure specific to variable rate pesticide application has been published in USDA ERS's charts-of-note series as of this review — check their chart directly for any update. - Q: How does nitrogen management relate to pest control in corn?
A: Corn rootworm feeding damages roots, which reduces nitrogen uptake and can mimic a nitrogen deficiency even when soil nitrogen is adequate. A Pre-sidedress Nitrate Test and tissue testing help distinguish a true deficiency from pest-driven uptake loss before applying more nitrogen. - Q: What role does satellite monitoring play in pest control?
A: Satellite vegetation index tracking flags stress zones early enough for ground-truthing, before visible damage spreads across a field. It doesn't diagnose the cause on its own — scouting confirms whether a flagged zone is a pest, disease, nutrient, or drainage issue.

 Godrej Agrovet
 Hayleys Agriculture
 Linx Agritech
 Adinet
 Save Your Soils
 GalaxEye Space
 Grandstream Algérie
 XOS Realty
 Geospatial Lab Africa
 Agro La Gándara
 HIPSAC
 ZOL Zimbabwe
 Juligerm
 AdBio
AdBio MISE Maroc
 NWNS
NWNS Red August Group
 Farm Inc
 WeMe Global
 Agrotoken
 Blue BearX
 Insignito
 DnCubed
 Indosistim Teknologi
 Liquify Digital
 CU Foods
 BeyondTech Global
 Rouge VC
 AgroRisk
 Oath Inc
 Esri North East Africa
 MDCV UK
 Etech Consulting Madagascar
 Vestlandsforsking
 WB Dev
 Sama Premium
 Tres Valles
 Blickwinkel
 Agricultural Credit Policy Council
 eKGIS
eKGIS Mostas Tech
 Andex
Andex Deluxe Conseil
 WICO
WICO Chimera Innovation
 SkyHarvest
 Teledarbas
 Exurbia Geospatial
 FieldZero
