

Reviewed August 2026 against USDA NASS Farm Labor Survey, USDA Economic Research Service, US Department of Labor wage data, and Florida Department of Agriculture & Consumer Services.
Try it: Run your own numbers →
The US had 637,000 hired farm workers during the USDA’s April 2025 reference week, paid an average $18.46/hour, while roughly 42% of crop farmworkers nationally had no work authorization as of the 2020-2022 average. Florida’s 44,400 commercial farms work 9.7 million acres and generate $9.24 billion in cash receipts, making the state’s labor supply — and any shift in immigration enforcement that touches it — a direct line to national food prices, not just a Florida story.
This piece answers what farm communities, farm labor contractors, and Florida growers are actually searching for: how big the farm worker shortage is, what it means specifically for Florida, and what tools — from H-2A visas to satellite crop monitoring — are available to farms trying to close the gap.
Table of Contents
- How Big Is the Farm Worker Shortage, Really?
- Florida Farm Workers: What’s Different Here
- The H-2A Visa Route and Its Costs
- Wages: What Farm Workers Actually Earn
- Where Technology Fits — and Where It Doesn’t
- Calculator: H-2A vs. Domestic Hire Cost
- What Changes This Picture Next
- FAQ
- Try it: Run your own numbers
How Big Is the Farm Worker Shortage, Really?
“Farm worker shortage” is searched far more often than any hard number gets reported, so start with what USDA actually counts. The USDA NASS Farm Labor Survey found 637,000 hired farm workers across the US during its April 6–12, 2025 reference week — this is a snapshot survey taken twice a year (typically April and October), not a running total, so a single figure understates peak-season hiring in fruit and vegetable states. USDA’s Economic Research Service separately counts 1.18 million wage-and-salary jobs in agriculture and its support industries for 2024, a broader category that includes packing houses, farm labor contractors, and support services alongside on-farm hires.
The undocumented share is the number that drives most of the policy debate: USDA’s Economic Research Service put the share of crop farmworkers with no work authorization at 42% as of the 2020-2022 average. That figure is national and crop-specific — ERS does not publish a Florida-only breakdown, and no official state-level figure for Florida’s undocumented farm labor share currently exists in public USDA data. If you need a Florida-specific estimate, the honest path is to track USDA ERS’s farm labor topic page for future state breakdowns rather than rely on a number nobody has actually published.
The federal government’s own response to the shortage — the H-2A temporary agricultural worker program — has grown sharply as an indicator of how tight domestic labor has become. USDA ERS reports 385,000 H-2A positions certified in FY2024, up from 75,000 in 2010 and just 48,000 in FY2005. That is roughly an eightfold increase in under two decades, and it is the closest thing to a real-time gauge of how many farm jobs employers cannot fill domestically.
Florida Farm Workers: What’s Different Here
Florida’s 44,400 commercial farms (FDACS, 2024) work 9.7 million acres and produced $9.24 billion in cash receipts in 2023, plus $4.8 billion in agricultural exports in 2024. Florida’s growing season and crop mix — citrus, tomatoes, strawberries, sugarcane — mean labor demand is concentrated in harvest windows rather than spread evenly across the year, which is exactly the pattern H-2A contracts are built around.
What the research base does not contain, and what you should not trust any article that states as fact: a specific current count of seasonal farm workers employed in Florida. Older estimates commonly cited in the press range from 150,000 to 200,000 seasonal workers, but there is no official current census figure behind that range — the USDA Census of Agriculture, which would be the authoritative source, runs on a five-year cycle and the next edition is 2029. Similarly, claims about output losses or yield cuts tied to specific enforcement actions (numbers like “$1.5 billion” or “25% yield cut” circulate in secondary sources) are not backed by a located primary study, so this article won’t repeat them as fact. If you need a current Florida farm labor estimate for planning purposes, the FDACS Agriculture Overview and Statistics page is updated annually and is the right place to check before citing a number.
Florida-specific farm worker wage data is a similar gap: NASS publishes national wage rates but does not break out a Florida-specific hourly figure in public reports. The one Florida-specific labor cost figure that is published and current is the H-2A Adverse Effect Wage Rate — covered below — which sets a wage floor for any Florida farm bringing in workers under the program.
The H-2A Visa Route and Its Costs
For Florida growers and for anyone searching “florida farm workers” or “migrant workers in florida” with hiring in mind, H-2A is the legal mechanism that matters most. The program requires employers to pay at least the Adverse Effect Wage Rate (AEWR) — a floor set by the US Department of Labor specifically so H-2A hiring can’t undercut local wages.
Florida’s H-2A Adverse Effect Wage Rate was $16.23/hour as of December 2024. The national average AEWR was $15.96/hour as of August 3, 2026, per the Department of Labor’s wage data page — rates are set by state and reviewed periodically, so a Florida grower budgeting for next season should check the current rate directly rather than use either figure blind, since AEWRs move without a fixed annual schedule.
| Metric | Figure | Period | Source |
|---|---|---|---|
| Florida H-2A Adverse Effect Wage Rate | $16.23/hour | December 2024 | US Department of Labor |
| National average H-2A AEWR | $15.96/hour | August 3, 2026 | US Department of Labor |
| US field/livestock worker wage (all workers) | $18.46/hour | April 2025 | USDA NASS Farm Labor Survey |
| US farm/ranch/aquacultural worker average wage | $17.23/hour | 2024 | USDA Economic Research Service |
| H-2A positions certified nationally | 385,000 | FY 2024 | USDA Economic Research Service |
H-2A comes with costs beyond wages — housing, transportation, and program fees — that a straight hourly-rate comparison misses. The calculator further down this page lets you run those numbers against your own farm’s headcount and season length.
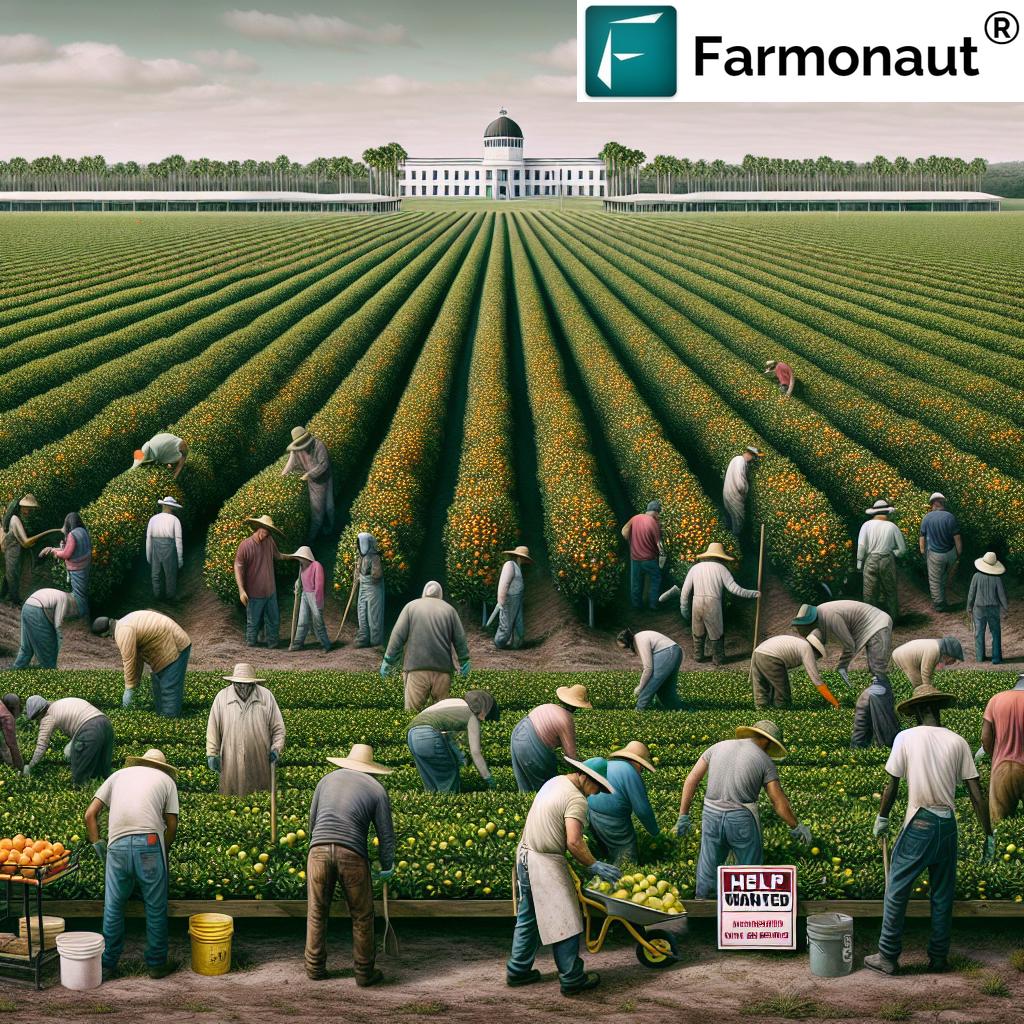
Enforcement policy shapes how reliable this pipeline feels to a grower deciding whether to file H-2A paperwork at all. The oversight questions in play in Tallahassee — where enforcement authority sits, how it interacts with federal agencies — determine how confidently a Florida farm can plan a season around either the H-2A track or its existing crew. For background on Florida’s agricultural footprint that any labor decision sits on top of, see this guide to Florida’s key crops and agriculture map.
Wages: What Farm Workers Actually Earn
Real wage growth for US farmworkers averaged 1.9% per year over 2014-2024, per USDA’s Economic Research Service — a decade of steady but modest gains, not the wage spikes sometimes implied by shortage headlines. Combined with the $18.46/hour national average field and livestock worker rate for April 2025, this tells a consistent story: wages have been rising gradually as the labor pool tightens, but not fast enough on their own to have closed the gap that pushed H-2A certifications from 48,000 (FY2005) to 385,000 (FY2024).
Notice the H-2A wage floors sit below the broader NASS average wage — that gap is exactly why domestic workers and H-2A workers are not perfect substitutes in a farm’s hiring math, and why a shortage in one category doesn’t automatically get filled by expanding the other.
Where Technology Fits — and Where It Doesn’t
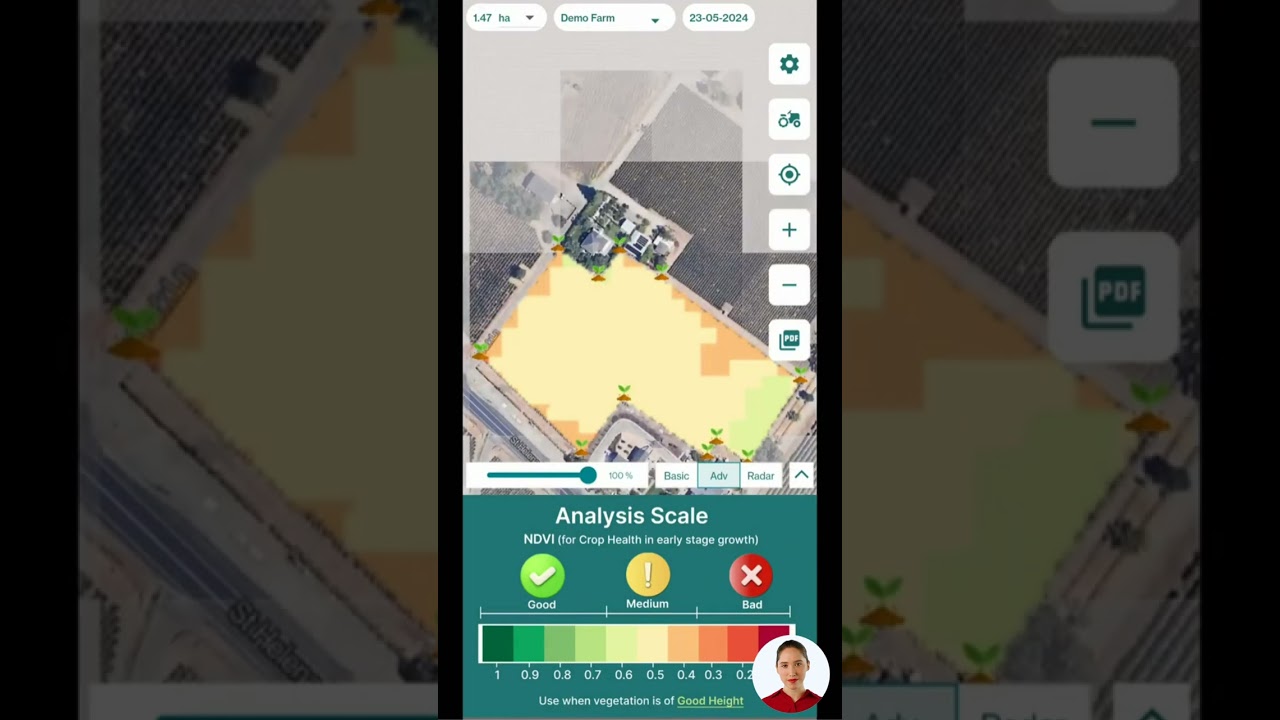
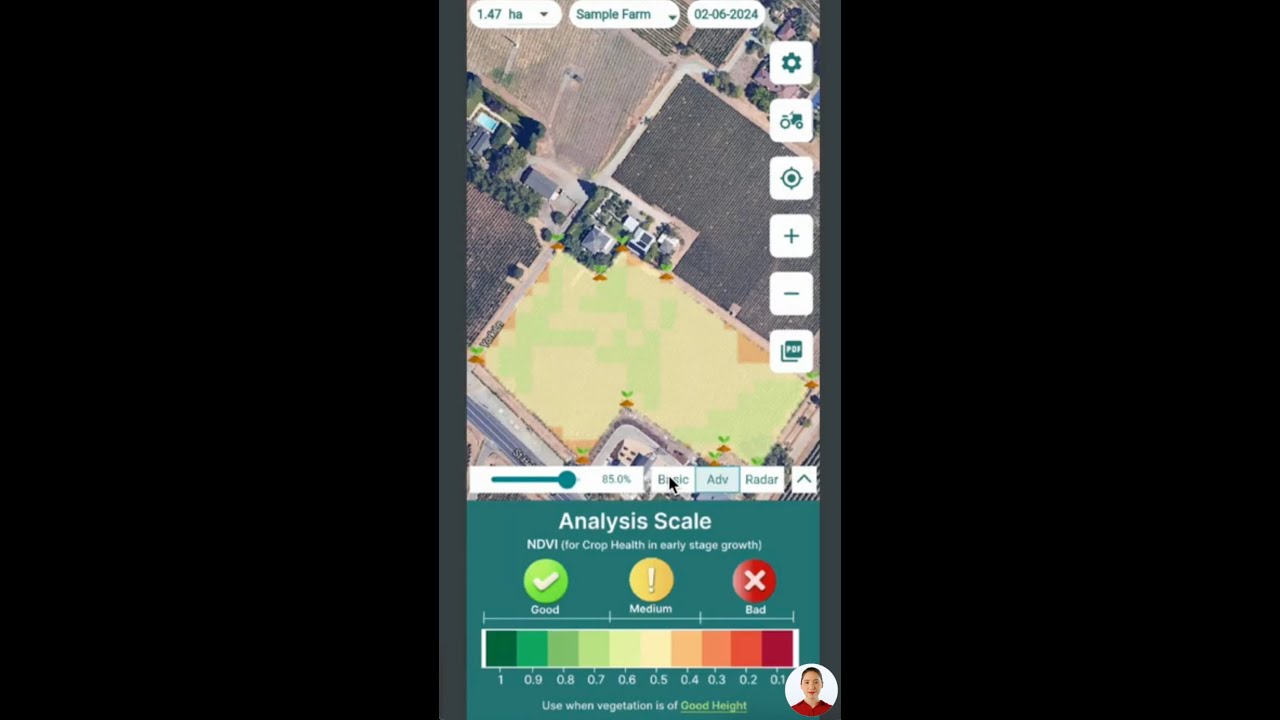
No satellite platform replaces a harvest crew — crops still need hands to pick, sort, and pack. What technology changes is how many labor-hours a given acreage needs for the tasks around harvest: scouting, irrigation timing, and input application. Farmonaut’s satellite crop health monitoring and AI-based advisory tools let a Florida grower cover more acres per available worker-hour on those specific tasks, which matters most when a labor shortage means every hour has to go further.
For growers who already have a labor plan and want to extend it with data, Farmonaut’s developer tools sit behind the same platform: API for developers and API Developer Documentation. And for anyone weighing where the broader farming labor market is headed — including roles that overlap with agtech rather than compete with it — this rundown of agricultural careers and this reference on Florida farm licensing are both relevant next steps.
Calculator: H-2A vs. Domestic Hire Cost per Season
Use your own headcount, season length, and wage assumptions to compare an H-2A crew against a domestic-hire crew at the national field/livestock average wage.
Run your own numbers
Assumptions: this calculator compares wage plus H-2A-required housing/transport costs against a domestic wage-only baseline. It excludes recruitment fees, payroll taxes, workers’ compensation, program filing costs, and any productivity difference between crews — those vary by farm and should be added to whichever total you’re evaluating.

What Changes This Picture Next
Three things move this data, and each has a known refresh point rather than a fixed date:
- NASS Farm Labor Survey: updated semi-annually, in May and November releases, covering April and October reference weeks. Check USDA NASS Farm Labor for the next release.
- H-2A Adverse Effect Wage Rates: updated by state as the Department of Labor reviews them, historically around December and August. Check DOL’s AEWR page before budgeting a season.
- Florida farm census data: FDACS publishes cash receipts and export totals annually; the detailed farm count and acreage figures come from the USDA Census of Agriculture, next due in 2029. Track FDACS’s Agriculture Overview and Statistics for the annual update in the meantime.
The durable method here, regardless of which year you’re reading this: pull the current NASS reference-week figure, the current AEWR for your state, and the current FDACS annual snapshot, then compare them against the historical figures in the tables above to see whether the shortage is widening or narrowing. That comparison — not any single year’s headline number — is what tells you whether conditions are improving.
For a broader look at labor-adjacent shifts across farming — including where mechanization is and isn’t substituting for hand labor — this piece on rice farming innovations and challenges covers a parallel case in a different crop.


FAQ
- Q: How many farm workers does the US actually have?
A: USDA’s NASS Farm Labor Survey counted 637,000 hired farm workers during its April 6–12, 2025 reference week. USDA’s Economic Research Service separately reports 1.18 million agriculture and agricultural-support wage-and-salary jobs for 2024, a wider category. Both are updated on a regular schedule — see the outlook section above for when to check the next release. - Q: What share of farm workers are undocumented?
A: USDA’s Economic Research Service found 42% of crop farmworkers had no work authorization, averaged over 2020-2022 — the most recent published national figure. There is no official Florida-specific breakdown of this share currently published. - Q: How does Florida’s farm labor picture differ from the national one?
A: Florida has 44,400 commercial farms working 9.7 million acres, generating $9.24 billion in cash receipts (2023) and $4.8 billion in exports (2024), per FDACS. Florida’s harvest-driven crop mix (citrus, tomatoes, strawberries) concentrates labor demand seasonally, which is why H-2A — designed for temporary, seasonal work — is especially relevant to Florida growers. - Q: What is the H-2A Adverse Effect Wage Rate, and what is Florida’s rate?
A: It’s a wage floor the Department of Labor sets so H-2A hiring can’t undercut local pay. Florida’s rate was $16.23/hour as of December 2024; the national average was $15.96/hour as of August 3, 2026. Rates are reviewed by state on an ongoing basis, so check DOL’s current AEWR page before relying on either figure. - Q: Are farm worker wages rising?
A: Real (inflation-adjusted) wages for US farmworkers grew 1.9% per year on average from 2014 to 2024, per USDA’s Economic Research Service. The national average field and livestock worker wage was $18.46/hour in April 2025; the broader farm/ranch/aquacultural worker average was $17.23/hour in 2024. - Q: Can technology solve the labor shortage on its own?
A: No — harvesting most Florida crops still requires hand labor. Satellite monitoring and AI advisory tools reduce the labor-hours needed for scouting, irrigation timing, and input decisions, which stretches an existing crew further but does not replace the need for harvest workers.

 Nale Network
 Exurbia Geospatial
 FieldZero
 Indico Company
 Kubota
 FFBS
FFBS Jontra
 Kalustyan
 Tucor
Tucor Geno
Geno Hayleys Agriculture
 Linx Agritech
 Adinet
 Save Your Soils
