

Dutch Agriculture Tech & Hyperspectral Cameras, Explained
Reviewed August 2026 against CBS (Statistics Netherlands), Wageningen University & Research, and USDA’s Economic Research Service.
Try it: Hyperspectral vs. Multispectral Payback Calculator →
Dutch agriculture controls its growing environment by replacing a farmer’s eye with sensors — automated greenhouse climate computers, hyperspectral and multispectral cameras, and soil/weather networks that hand decisions to software instead of instinct. A hyperspectral camera for agriculture is the sharpest tool in that stack: it reads hundreds of narrow spectral bands instead of the three or four an ordinary camera sees, which is why research teams use it to catch crop disease before symptoms are visible. It also costs 5 to 50 times more than the multispectral cameras most farms actually buy, which is the whole story of why adoption looks the way it does on both sides of the Atlantic.
The Numbers at a Glance
These are the sourced figures this article works from, each linked back to the original release, with the check-back path noted where the number moves annually or quarterly.
| Metric | Figure | Source & period |
|---|---|---|
| Dutch agricultural export value | €137.5 billion, +8.4% vs. prior year | CBS, 2025 data, published March 2026 |
| Netherlands utilised agricultural area | 1.79 million hectares | CBS, 2025 (final) |
| Dutch agricultural/horticultural holdings | 49,900, down 1.4% | WUR, 2024 |
| Dutch greenhouse vegetable area | 4,100 hectares | CBS, 2023 |
| Dutch greenhouse vegetable production volume | 1.63 million tonnes | CBS, 2023 |
| Hyperspectral imaging market CAGR | 12.8% | Research and Markets, 2024–2034 forecast |
| Europe share, agriculture sensing/monitoring devices market | 30% | Research and Markets, 2024 |
| US autosteer/guidance adoption, large-scale crop farms | 70% | USDA ERS, 2023 ARMS |
| US autosteer adoption, midsize crop farms | 52% | USDA ERS, 2023 ARMS |
| Precision-ag profit advantage over nonadopters | $66/acre/year | USDA ERS, 2019–2021 |
| Hyperspectral VNIR camera price | $25,000–$75,000 | SurfaceOptics, 2026 cost guide |
How the Netherlands Turned 1.8 Million Hectares Into a €137 Billion Export Machine
The Netherlands ranks among the world’s largest agricultural exporters despite being smaller than the state of Maryland. According to Statistics Netherlands (CBS), Dutch agricultural exports reached €137.5 billion in 2025 — €88.4 billion from goods grown or processed domestically and €49.1 billion from re-exported foreign produce moving through Dutch ports and auctions. More than two-thirds of that year’s growth came from higher prices; the rest came from a genuine rise in exported volume. CBS’s land-use figures put the country’s utilised agricultural area at 1.79 million hectares in 2025 — the base that output is squeezed out of.
Greenhouse vegetables are the clearest example of that squeeze. CBS counted 4,100 hectares under greenhouse tomatoes, peppers, cucumbers and aubergines combined in 2023, producing 1.63 million tonnes of vegetables — 730,000 tonnes of that tomatoes alone — grown across roughly 625 commercial holdings. Dutch horticultural exports were valued at €11.5 billion that same year. That is output density land area alone cannot explain; it comes from the sensor and climate-control layer described below.
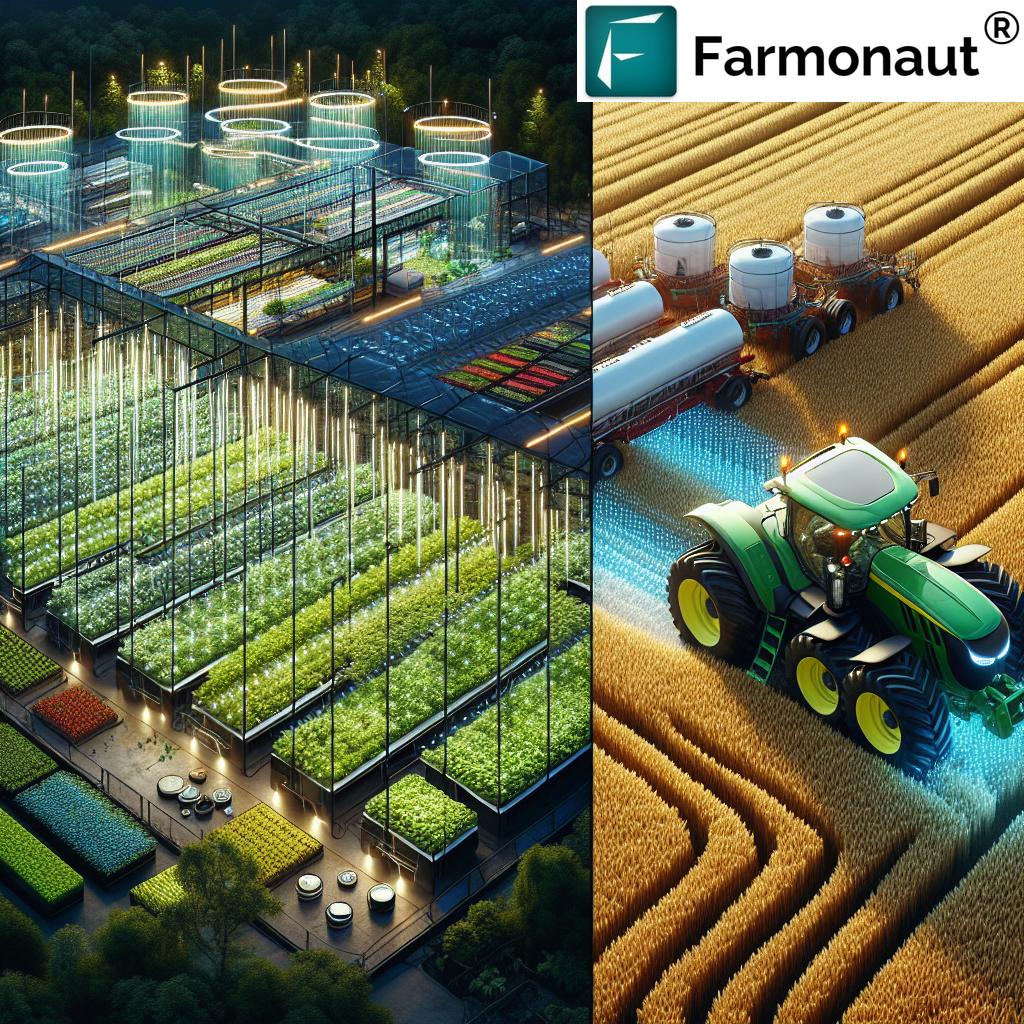
This model depends on tools most US and UK growers would call precision agriculture: soil sensors, GPS-guided implements, and — inside the country’s greenhouse footprint — climate computers that run the growing environment continuously rather than on a fixed schedule. The same building blocks show up in every market this page covers:
- Sensor- and GPS-guided precision agriculture
- Climate-controlled greenhouse technology
- Closed-loop water and nutrient recycling
- Sustainable pest control integrated with sensor monitoring instead of calendar-based spraying
The number of Dutch agricultural and horticultural holdings has been falling for decades as consolidation and automation let fewer operators farm more land with more equipment per hectare. Wageningen University & Research (WUR) counted 49,900 holdings in 2024, a drop of about 700 businesses (1.4%) from 2023, and roughly half the number that existed in 2000. This is the durable pattern to watch, not the exact count in any single year: check WUR’s annual farm-structure release each spring for the current figure, since the direction (fewer, larger, more automated holdings) has held for over two decades and is unlikely to reverse on its own.
Explaining How Dutch Agriculture Fully Controls the Growing Environment
Controlling the growing environment, in practice, means a computer — not a person — decides temperature, humidity, CO2, lighting, and irrigation inside the greenhouse, adjusting continuously based on sensor readings rather than a fixed schedule. WUR, the country’s dedicated greenhouse technology research center, runs the Autonomous Greenhouse Challenge to test how far that automation can go without a human grower in the loop. In the fourth edition, teams grew dwarf tomatoes over a roughly 70-to-80-day harvest window using only algorithmic control of greenhouse climate and crop management. The winning team, IDEAS, achieved the highest profit per square meter per day largely through extensive use of energy screens and a planting density nearly double that of most competing teams — evidence that “full control” here is economic optimization, not automation for its own sake.
That is the throughline connecting Dutch greenhouse control to open-field sensing everywhere else: a sensor network only pays for itself if the resulting decisions — plant density, irrigation timing, spray timing — measurably change the outcome. The same logic applies to hyperspectral and multispectral cameras used outdoors, covered next. One caveat worth stating plainly: no published study quantifies Dutch or wider-European water savings from controlled-environment greenhouse production against an open-field baseline with a peer-reviewed methodology behind it. If you need that number for a specific crop or region, look for a lifecycle-assessment (LCA) study naming the comparison directly rather than a general water-savings claim with no citation attached.
Hyperspectral Cameras for Agriculture: What They See and What They Cost
A standard camera records three color bands — red, green, blue. A multispectral camera records somewhere between four and ten discrete bands, usually including near-infrared and red-edge wavelengths chosen because they correlate with chlorophyll and water content. A hyperspectral camera for agriculture records hundreds of narrow, contiguous bands across a spectrum, typically covering the 400–1000 nanometer visible-to-near-infrared (VNIR) range, sometimes extending further into shortwave infrared. That density lets it detect subtle reflectance shifts — a stressed plant “looks” different across dozens of bands before it looks different to a human eye.
A peer-reviewed 2023 study on drone-based hyperspectral imaging for wheat stem rust, published via the National Library of Medicine’s PMC archive, is a concrete example of what that resolution buys. Using a random forest classifier on hyperspectral data spanning 400–900 nm, researchers separated diseased from healthy wheat with 88% accuracy, and correctly flagged plants at the mildest disease stage — 1 to 15% severity, before visible symptoms are obvious in the field — 76% of the time. The most useful bands clustered in the red-edge region between 690 and 730 nm, with specific wavelengths at 690.2, 706.6, 714.8, 725.1, 760, and 817.5 nm carrying the most classification signal.
Capability like that has a price tag. Per SurfaceOptics’ 2026 hyperspectral camera pricing guide, a VNIR hyperspectral camera using silicon CCD/CMOS detectors runs $25,000 to $75,000. Multispectral alternatives — fewer, wider bands targeting known indicators like the red edge — cost far less: $1,500 to $5,000 for entry-level units and $7,500 to $16,000 for industrial/scientific-grade ones. For most farms, that gap is the entire adoption decision: hyperspectral detail versus multispectral affordability. No manufacturer or buyer survey publishes a per-hectare deployment cost on top of the hardware price, so treat any such figure you see elsewhere as unsourced until you can trace it to a named study.
That price gap also explains the “agriculture sensing and monitoring devices market” line item analysts track separately from precision-ag software and from hyperspectral imaging specifically. Research and Markets’ agriculture sensing and monitoring devices report puts Europe at 30% of the global market as of 2024, the largest single regional share the report tracks. Separately, Research and Markets’ hyperspectral imaging in agriculture forecast projects a 12.8% compound annual growth rate for 2024–2034 specifically for hyperspectral systems — faster growth than the broader sensing-device category, off a much smaller base, which is consistent with hyperspectral remaining a specialist tool (research stations, seed breeders, high-value specialty crops) rather than a mainstream farm purchase. Market-sizing reports reset their base-year valuations and definitions with each new release, so pull the current figure and methodology notes directly from a named report rather than averaging headline numbers across vendors — category definitions rarely match between firms.
Farmonaut’s own satellite layer sits on the cheaper, higher-coverage end of that same sensing spectrum — multispectral satellite imagery rather than a mounted hyperspectral camera — and is available as an API for anyone building on top of it:
Explore the API:
Farmonaut API
API Developer Docs
Hyperspectral vs. Multispectral Payback Calculator
Run your own acreage and flight plan through the price ranges above to see what a camera actually costs per acre scanned over its working life.
Hyperspectral vs. Multispectral Payback Calculator
Compare per-acre scanning cost across camera classes using your own acreage and flight schedule.
Uses the midpoint of each published price range as a stand-in cost; your actual quote will differ by vendor and sensor spec. Excludes drone/flight-platform cost, calibration, data processing and storage, and financing costs — all real add-ons on top of the camera itself. Life and flight assumptions are yours to set; there is no published standard for either.
High-Tech Farming in the US: How Much Precision Agriculture Is Actually in Use
“High-tech farming” and “agriculture technology” get used loosely, so it helps to anchor them to what USDA actually measures. The USDA Economic Research Service (ERS), drawing on the 2023 Agricultural Resource Management Survey (ARMS), found that guidance autosteering systems — GPS-guided steering for tractors and combines — were used on 52% of midsize farms and 70% of large-scale crop-producing farms. A separate ERS analysis of ARMS data tracks how that adoption breaks down further by farm size and technology type; check both Charts of Note pages directly for the current release, since ERS updates them as each new ARMS survey wave is processed.
The economics behind that adoption curve are published too. USDA’s Economic Research Service found that precision-agriculture adopters carried a $66-per-acre annual operating-profit advantage over nonadopters across the 2019–2021 period. USDA’s Agricultural Research Service separately reports that current precision-agriculture adoption is delivering roughly a 5% productivity increase across US agriculture broadly, while tractor guidance systems specifically are credited with about a 20% efficiency improvement — covering fuel, fertilizer, and other input reduction — based on research from the 2019–2023 period. Those three figures answer the “why bother” question that adoption percentages alone don’t: the hardware pays for itself through measurable input savings and profit, not just convenience.
Below the large-farm tier, adoption drops sharply — ERS’s own farm-size breakdowns show guidance-system use falling off well before the smallest operations, which is the gap that makes “high tech farming” a scale-dependent label rather than a universal one. For the current adoption rate on farms of any specific size class, USDA NASS QuickStats publishes machinery-and-equipment guidance-system data that updates annually in late Q1, after each fiscal year’s survey data closes out — that is the fastest path to a number newer than this one. The practices layered on top of that hardware — precision fertilizer application, sustainable crop management methods like variable-rate input timing, and climate-smart techniques such as cover cropping and reduced tillage — depend on that same sensor and mapping infrastructure being in place first. A yield map is only actionable if the farm also has equipment to act on it zone by zone.

Farming Innovators: Where the Next Round of Ag Tech Is Coming From
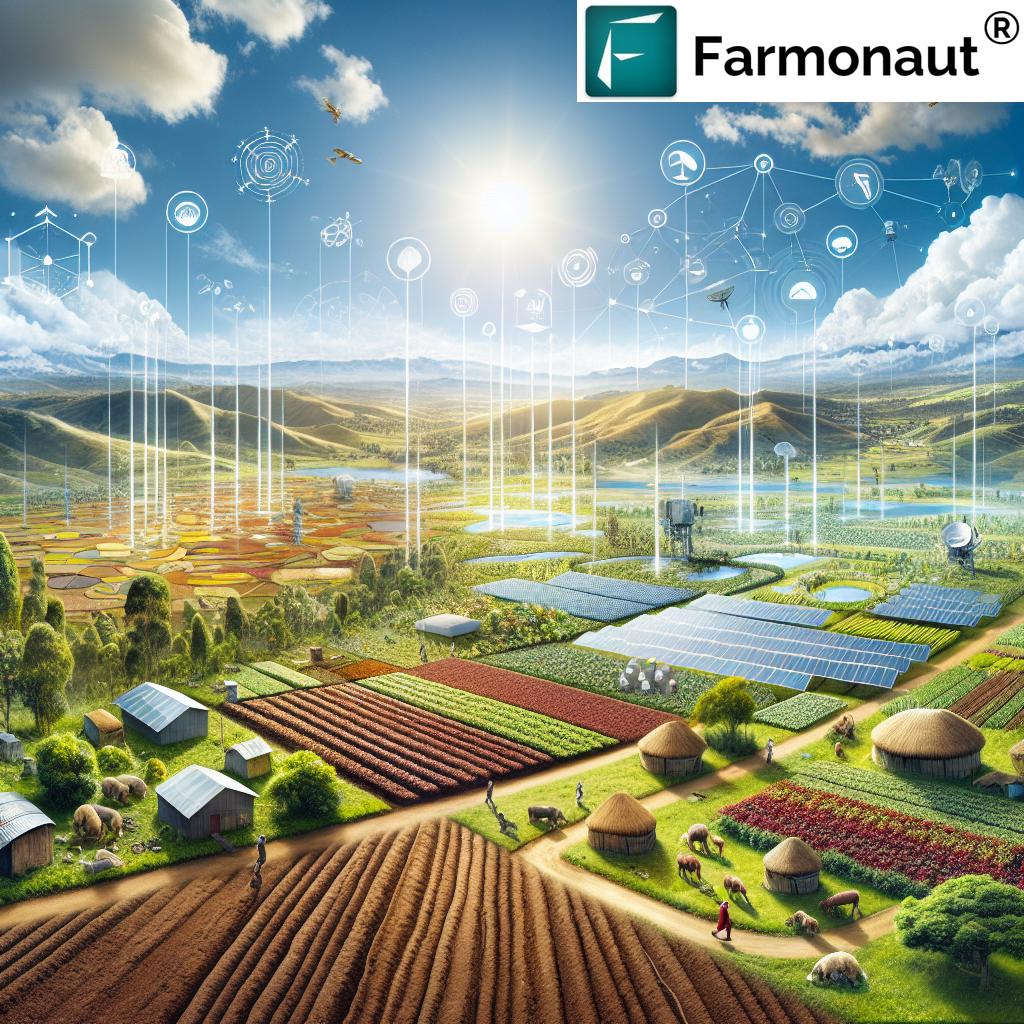
The Netherlands earns its reputation as a home for farming innovators mainly through its university-industry pipeline: WUR’s Autonomous Greenhouse Challenge doubles as a proving ground where student and startup teams test control algorithms against commercial growers’ benchmarks, and winning strategies feed back into commercial greenhouse-control software within a few growing seasons. The same ecosystem produces vertical farming operators applying greenhouse-grade climate control to stacked, indoor production, and a wider push toward regenerative farming practices that pair sensor data with reduced-input strategies rather than treating them as separate goals.
US innovation runs on a parallel but distinct track, shaped more by farm size and equipment-dealer networks than university spinouts — a difference worth its own look if you’re benchmarking US adoption specifically, in our deeper look at US agriculture innovation and trends. What both markets share is the same constraint: a sensor or camera only earns its keep when the data changes a decision. That is the standard hyperspectral imaging has to clear against cheaper multispectral gear, and it is the same standard behind Farmonaut’s own satellite monitoring, AI advisory, and resource-management tools.
Try Farmonaut’s tools:



Frequently Asked Questions
- What actually makes Dutch agriculture different from US or UK farming?
Scale and land constraint. On 1.79 million hectares — a fraction of US or UK farmland — Dutch producers substitute sensor density and automated greenhouse control for land area, which is why the country exported €137.5 billion in agricultural goods in 2025 (CBS) despite its size, and why its 4,100 hectares of greenhouse vegetables alone produced 1.63 million tonnes in 2023. - What does a hyperspectral camera do that a regular or multispectral camera can’t?
It captures hundreds of narrow spectral bands instead of 3–10 wide ones, which is what let a 2023 peer-reviewed study detect wheat stem rust at 88% overall accuracy — and 76% at the mildest, 1–15% severity stage, before visible symptoms appeared. - Is a hyperspectral camera affordable for a typical US farm?
Not usually on its own economics: VNIR hyperspectral units run $25,000–$75,000 versus $1,500–$16,000 for multispectral alternatives (SurfaceOptics, 2026), and the hyperspectral imaging market is forecast to grow 12.8% annually through 2034 largely on research, seed-breeding, and specialty-crop demand rather than mainstream row-crop adoption. - How much of US farming is genuinely “high tech” today?
On large-scale crop farms, 70% use autosteer guidance versus 52% on midsize farms (USDA ERS, 2023 ARMS), and adopters of precision agriculture carried a $66-per-acre annual profit advantage from 2019–2021. Adoption falls off well before the smallest farms, so “high-tech farming” describes a size-dependent segment of US agriculture, not the whole of it — check USDA NASS QuickStats for the current adoption rate by farm size. - Where can I get more current versions of these figures?
CBS republishes Dutch export and land-use data annually each March; WUR publishes its farm-count update each spring; USDA ERS updates its precision-agriculture Charts of Note as new ARMS survey waves are processed, and NASS QuickStats refreshes machinery-adoption data annually in late Q1; hyperspectral and sensor market sizing is reissued by research firms on their own report cycles — check the base year and definitions before comparing two reports.
Whether you’re evaluating a hyperspectral camera for agriculture, sizing up US precision-ag adoption against your own operation, or tracking what Dutch greenhouse control looks like in practice, the sensor economics are the same everywhere: cheaper, lower-resolution data collected constantly beats expensive, high-resolution data collected rarely. Farmonaut’s satellite layer is built around that trade-off — see it applied to data-driven digital agriculture for a walkthrough of how the pieces fit together.
Discussion
Questions, corrections or field experience? Share them below. First-time comments are reviewed before they appear, and your email is never published.
No comments yet. Be the first to add a question or your experience.

 AgriBazaar
 Geno
Geno Hayleys Agriculture
 Linx Agritech
 Adinet
 Save Your Soils
 Grandstream Algérie
 XOS Realty
 Geospatial Lab Africa
 Agro La Gándara
 HIPSAC
 ZOL Zimbabwe
 Juligerm
 AdBio
AdBio MISE Maroc
 NWNS
NWNS Red August Group
 Farm Inc
 WeMe Global
