

Reviewed August 2026 against USDA Economic Research Service and DigitalFoodLab data.
Try it: Run your own numbers →
Agritech Startups: US Adoption Data, Funding & Where They Stand
Agritech startups build the sensors, software, and machinery that let farmers manage fields by data instead of guesswork — and in the United States, adoption of that technology is already well past the experimental stage. USDA’s Economic Research Service found that automated guidance systems (auto-steer) were used on more than 50% of corn, soybean, cotton, rice, and wheat acreage by 2019, while variable rate technology reached 37.4% of corn acreage in 2016 and 22.7% of cotton acreage in 2019. Those figures, not investor hype, are the real measure of how far agritech has moved from pilot project to standard practice.

This article covers what “agritech” actually means as a startup category, how big the ecosystem is in the markets with published counts (the UK and Europe), what adoption looks like on US farms specifically, and how to verify funding and market-size numbers yourself rather than trusting a static figure that ages badly. It also looks at where irrigation automation fits into the category — including the interest in how countries like China are mechanizing irrigation at scale — and closes with a calculator you can use to estimate the payback period on adopting a precision agriculture package on your own acreage.
Table of Contents
- What “Agritech” Means as a Startup Category
- US Precision Farming Adoption: The Numbers
- How Big Is the Agritech Startup Ecosystem
- Agritech Funding: What’s Published and How to Track It
- Irrigation Technology and Automation
- Agrifood Supply Chain Startups: Where They Overlap
- Singapore and the Asia-Pacific Angle
- Satellite-Based Farm Management: Farmonaut’s Approach
- Precision Agriculture Payback Calculator
- FAQ
- Try it: Run your own numbers
What “Agritech” Means as a Startup Category
Agritech (also written agtech, or as part of “agrifoodtech” when supply chain and food-processing companies are included) covers software, hardware, and biological innovation applied to farming and the food system. The category spans several distinct sub-sectors, and confusing them is the most common reason market-size figures don’t match up between reports:
- Precision agriculture: variable rate application, auto-steer guidance, yield mapping, satellite and drone-based crop monitoring
- Farm management software: record-keeping, compliance, and data platforms that aggregate field-level information
- Ag biotech: seed genetics, biologicals, and crop protection products developed with computational tools
- Indoor and vertical farming: controlled-environment agriculture, often marketed to urban and peri-urban markets
- Agrifood supply chain tech: traceability, logistics, and marketplace platforms connecting farms to processors and retailers
Farm management software and precision agriculture hardware are the two sub-sectors with the most robust adoption data in the United States, largely because USDA’s Agricultural Resource Management Survey (ARMS) has tracked precision technology use on major field crops since the mid-2000s. That’s the dataset behind the adoption figures in the next section, and it’s the one part of this article’s evidence base that a reader can go pull for themselves.
US Precision Farming Adoption: The Numbers
USDA’s Economic Research Service publication on precision agriculture (pub. 105893) breaks adoption down by technology type and crop, using ARMS survey rounds collected between 2005 and 2019. The headline figures:
| Technology | Crop / Acreage | Adoption Rate | Survey Year |
|---|---|---|---|
| Automated guidance (auto-steer) | Corn, soybeans, cotton, rice, wheat | 50%+ | 2019 |
| Variable rate technology | Corn acreage | 37.4% | 2016 |
| Variable rate technology | Cotton acreage | 22.7% | 2019 |
| Data-based management recommendations | Corn acreage | 32.4% | 2016-2019 |
Source: USDA Economic Research Service, “Precision Agriculture in the Digital Era”.
The pattern worth noting: guidance systems (the simplest, cheapest technology to retrofit onto existing equipment) have the highest adoption at over 50% of major-crop acreage, while variable rate application — which requires more integration between sensors, prescription maps, and equipment controllers — sits at roughly a third to a fifth of acreage depending on the crop. That gap is the addressable market agritech startups are still working to close, and it’s a more useful way to size the opportunity than any single “agritech market” dollar figure.
Because ARMS is fielded periodically rather than annually, these are the most recent nationally representative figures published as of this review. USDA’s ERS releases updated precision-technology findings through its “Charts of Note” series at ers.usda.gov/data-products/charts-of-note — check there for newer adoption percentages, typically with a two-year lag between data collection and publication.
How Big Is the Agritech Startup Ecosystem
Startup counts are published unevenly by region, and the two figures with a citable source right now are for the UK and Europe rather than the US, where no equivalent national census of agritech companies is published by a government agency. Startus Insights, drawing on Tracxn data, counted 1,740 agritech companies operating in the United Kingdom as of its 2024 report. Separately, DigitalFoodLab’s European agrifoodtech analysis put the number of active agrifoodtech startups across Europe at roughly 3,000 as of 2024-2025.
For US-specific startup counts, no equivalent aggregated figure appears in USDA or Commerce Department publications as of this review — those counts are typically maintained by private data platforms (Crunchbase, PitchBook, AgFunder) rather than government agencies, and they update continuously rather than on a fixed publication schedule. If you need a current US agritech company count, query one of those platforms directly rather than relying on a number printed in an article, since even a figure accurate at time of writing will be stale within months.
For readers researching where startups outside North America and Europe fit into this picture, Farmonaut has covered agricultural innovation trends and eco-friendly farming methods in South Asia on separate pages, since the funding environment, regulatory context, and typical farm size in that region differ enough from the US and Europe that the two shouldn’t be lumped into one set of statistics.
Agritech Funding: What’s Published and How to Track It
DigitalFoodLab’s analysis found Europe captured 28% of global agrifoodtech funding in 2024 — a useful benchmark for gauging how concentrated investment is outside the US, since it implies the remaining 72% is split primarily between North America and Asia-Pacific. That’s a share-of-total figure, not a dollar amount, which makes it more durable: dollar totals for any single year get revised and superseded quickly, but a percentage share is easier to compare across reporting periods even as the total pool of capital moves.
What isn’t in the current evidence base: a specific US agritech venture funding total for the most recent full year, or a breakdown of USDA grant or subsidy spending directed at agritech startups specifically (as opposed to farm subsidies generally). Both are legitimate gaps rather than omissions — here’s how to fill them yourself:
- US venture funding by year: CropLife publishes an annual agtech funding roundup each Q1 at croplife.com, covering the prior calendar year’s deal totals and largest raises.
- Global and regional funding trends: AgFunder’s annual AgriFoodTech Investment Report is the most frequently cited industry source; search “AgFunder agrifoodtech investment report” for the current edition.
- USDA innovation-specific spending: USDA’s National Institute of Food and Agriculture (NIFA) publishes grant award data by program, but it is organized by research area, not by “startup” as a category, so cross-referencing award recipients against startup databases is the only way to isolate that spending.
Treat any funding total you find the same way: note its publication date and the period it covers before citing it, because “agritech funding” as a search term returns results spanning quarterly, annual, and multi-year windows that are easy to mix up. Putting money into the sector can mean anything from land to listed agtech, and the ways to invest in agriculture lays out each route.
Irrigation Technology and Automation
Irrigation is one of the sub-sectors where automation and precision technology adoption is most visible on the ground, because water delivery is one of the few farm inputs that can be fully automated with existing sensor and valve technology. China has invested heavily in large-scale irrigation modernization as part of national water-efficiency policy, mechanizing canal and pivot systems across major grain-producing provinces — a scale of centrally coordinated irrigation infrastructure that has few direct parallels among Western agritech deployments, which tend to be farm-by-farm rather than regionally coordinated.
For US and European readers, the more directly comparable adoption data is the USDA field-crop precision technology figures cited above, since variable rate and guidance systems are frequently bundled with irrigation-adjacent tools like soil moisture sensors and weather-linked scheduling software. A specific US farm-level adoption percentage for irrigation automation and drone/UAV-based water monitoring is not available in the current evidence base — USDA’s Irrigation and Water Management Survey (part of the Census of Agriculture) is the primary source to check for water-specific technology uptake, published on a multi-year cycle. Farmonaut’s own coverage of soil and water management practices goes deeper into the specific methods (drip scheduling, moisture-sensor thresholds, deficit irrigation) that these systems automate.
Agrifood Supply Chain Startups: Where They Overlap
Agrifood supply chain startups — traceability platforms, cold-chain logistics software, blockchain-based provenance systems — sit adjacent to precision agriculture rather than inside it, and the distinction matters for anyone trying to size the “best agrifood supply chain startups” category specifically. Precision ag startups sell to the farm; supply chain startups sell to processors, distributors, and retailers, and their customers, funding sources, and regulatory pressures (food safety traceability rules, for instance) are different enough that treating the two as one market overstates both segments’ size.
The evidence base gathered for this article doesn’t include a dedicated ranking or count of supply-chain-specific startups, so rather than force a list, the honest answer is: DigitalFoodLab’s European agrifoodtech analysis is the closest published source that segments by category (including supply chain and logistics) rather than lumping all agrifoodtech together, and it’s worth reading directly at the link below if that specific sub-sector is what you’re researching.
Singapore, Southeast Asia, and the Asia-Pacific Angle
Singapore has built a policy identity around being a “living laboratory” for agritech, particularly for controlled-environment and alternative-protein ventures, given that the city-state imports the large majority of its food and has limited arable land of its own. Programs connecting European and UK startups with Southeast Asian and broader Asia-Pacific markets — trade missions, accelerator partnerships, and government-to-government innovation agreements — are a recurring feature of Singapore’s agrifood strategy, though the current evidence base doesn’t include a specific, currently active program name or its funding terms, so treat any such program as something to verify directly with Singapore’s Enterprise SG or Economic Development Board before citing specifics like eligibility or grant size.

What is durable about Singapore’s position, independent of any single named program: its combination of research infrastructure (National University of Singapore, Temasek Life Sciences), a startup-friendly regulatory environment for novel food products, and its function as a logistics and financial gateway to Southeast Asian markets. Those structural advantages don’t expire the way a specific grant cycle does, which is why they’re worth understanding even if the program that originally motivated a search brought you here has since wound down or been renamed.
European startups bring specific technical strengths into Asia-Pacific expansion, most notably in precision agriculture technique and AI-driven crop management, developed originally for temperate, mechanized farms and then adapted to the smaller, more fragmented field sizes common across much of Southeast Asia. That adaptation process — not the transfer of the technology unchanged — is where most of the genuine product development work happens, and it’s a longer process than most market-entry programs budget for.
Bridging Innovation: Technology Transfer in Practice
Cross-border agritech technology transfer typically involves adapting four categories of tools to new operating conditions:
- Precision agriculture techniques calibrated for local soil and climate data rather than the datasets they were trained on originally
- AI-driven crop management systems retrained on regional crop varieties and pest pressures
- Sustainable farming practices adjusted for local water rights and input-availability constraints
- Advanced soil and water management solutions rebuilt around locally available sensor and connectivity infrastructure
Smart farming technologies sit underneath all four categories. IoT sensors for real-time field monitoring, drone-based scouting, and AI-powered crop yield optimization tools are the components most frequently re-deployed across markets, precisely because they’re modular: the sensor hardware barely changes, while the analytics layer on top does.

Sustainable Agriculture: Where Startup Investment Concentrates
Sustainability-focused agritech spans several distinct product categories, each with a different maturity level and evidence base:
- Water-efficient irrigation systems, discussed above, with US adoption data pending USDA’s next Irrigation and Water Management Survey release
- Organic pest control methods, increasingly paired with sensor-triggered application timing rather than calendar-based spraying
- Vertical farming solutions for urban and peri-urban markets, a category with high capital intensity and a track record of well-publicized shutdowns alongside successes, which makes single-company case studies a poor proxy for the category’s health
- Waste reduction and circular economy approaches, including feedstock recovery and composting logistics platforms
The variable rate technology adoption figures cited earlier (37.4% of corn acreage in 2016, 22.7% of cotton acreage in 2019) are themselves a sustainability metric in practice, since variable rate application reduces fertilizer and pesticide over-application relative to blanket field-wide rates. That’s a more concrete way to measure sustainable-agriculture progress than counting startups or funding announcements.
Data and Analytics in Modern Agriculture
Data-based management recommendations — prescriptions generated from field data rather than generic agronomic guidelines — reached 32.4% of US corn acreage between the 2016 and 2019 ARMS survey rounds, per USDA ERS. That figure sits below guidance-system adoption but above variable rate technology adoption for the same crop, which tells you something about the adoption curve: farmers appear more willing to receive a data-driven recommendation than to fully automate variable-rate execution on it, at least as of the most recent published survey round.
In the broader context of agriculture big data, the gap between “receiving a recommendation” and “acting on it via automated equipment” is the addressable market most farm-software startups are still trying to close, and USDA’s periodic ARMS releases are the most reliable way to track whether that gap is narrowing over time.
Satellite-Based Farm Management: Farmonaut’s Approach
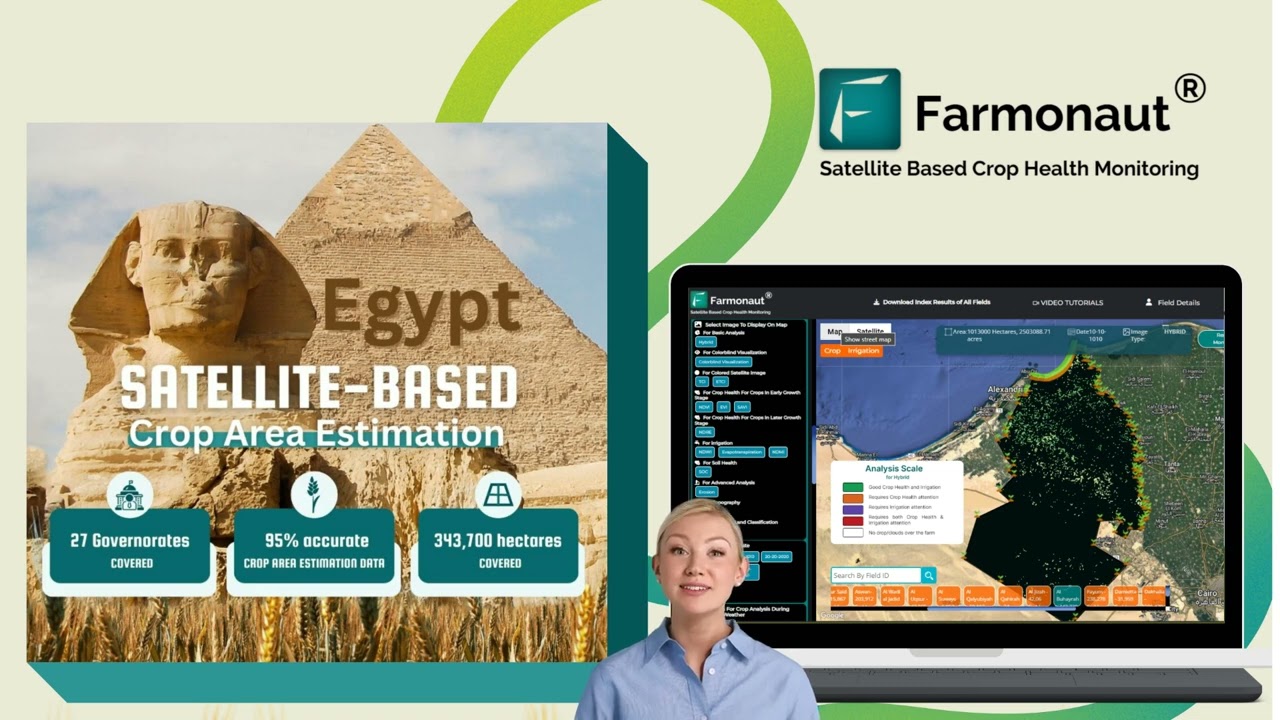
Farmonaut is one example of the precision agriculture technology category discussed throughout this article: a satellite-based farm management platform built around real-time crop health monitoring rather than ground-based sensor networks alone. Its approach sits inside the same broad category as the USDA-tracked technologies above — remote data collection feeding into management recommendations — but uses satellite imagery as the primary data source rather than requiring in-field hardware installation.
Core capabilities include:
- Real-time crop health monitoring via satellite imagery
- AI-based advisory systems for input timing and field management
- Blockchain-based traceability for supply chain documentation
- Resource management tools covering irrigation and input planning
For readers wanting to evaluate the platform directly:


Agritech Market Comparison: US, UK, and Europe
Because startup counts, funding shares, and adoption rates are published by different organizations on different schedules, here’s how the figures in this article line up side by side:
| Metric | United States | United Kingdom | Europe (overall) |
|---|---|---|---|
| Startup / company count | Not published by a government source; check Crunchbase/PitchBook/AgFunder for current count | 1,740 agritech companies (2024) | ~3,000 active agrifoodtech startups (2024-2025) |
| Share of global agrifoodtech funding | Not isolated in current evidence base; see CropLife’s annual roundup | Included within European 28% share | 28% of global agrifoodtech funding (2024) |
| Precision tech adoption (headline figure) | 50%+ auto-steer guidance on major crop acreage (2019) | Not in current evidence base | Not in current evidence base |
| Primary data source | USDA Economic Research Service (ARMS survey) | Startus Insights / Tracxn | DigitalFoodLab |
Source links: DigitalFoodLab European Agrifoodtech Top 50 and Startus Insights Agritech Report.
Challenges Facing Agritech Startups
Startups expanding across the US, UK, European, and Asia-Pacific markets face a consistent set of friction points, regardless of which region they’re entering from or into:
- Regulatory divergence: data privacy rules for farm-level information, novel food approval processes, and equipment certification standards differ by jurisdiction and rarely transfer automatically
- Hardware-to-software adaptation cost: a sensor calibrated for corn and soybean fields in the US Midwest requires retraining or recalibration for different soil types, crop varieties, and field sizes elsewhere
- Capital intensity of field trials: agritech products need at least one full growing season, often several, to generate validation data, which slows funding cycles relative to most software categories
- Fragmented distribution: reaching individual farms requires either a direct sales force or a channel partnership with existing equipment dealers, both slow to build
These are structural, not regional — the same list would apply to a US company trying to enter European markets as to a European company entering the US or Asia-Pacific.
Partnerships and Distribution
Given the distribution challenge above, most successful agritech market entries lean on a partner already embedded in the target market rather than building a sales channel from scratch. That takes a few recurring forms:
- Equipment dealer networks that already have farmer relationships and can bundle software with hardware sales
- University extension programs and agricultural research institutions, which carry credibility with farmers that a new commercial brand doesn’t yet have
- Co-operative and grower-association channels, particularly for crop-specific tools
- Government agricultural agencies running technology-adoption pilot programs, which can fund initial deployment at reduced cost to the startup
None of these substitute for product-market fit, but they materially shorten the time between “have a validated product” and “have farm-level adoption data to show investors” — which matters given how capital-intensive field validation is, as noted above.
Precision Agriculture Payback Calculator
Use the calculator below to estimate the payback period for adopting a variable rate or guidance-system package on your own acreage, based on the input-savings pattern documented in USDA’s adoption data above.
Run your own numbers
Assumptions: savings are calculated only on input costs (fertilizer and chemical), not on yield gains, labor, or fuel, which this calculator excludes. The default 10% savings figure is a starting point for you to adjust — it is not a USDA-published average and should be replaced with your own agronomist’s estimate or your equipment vendor’s quoted figure before making a purchase decision.
Where Agritech Adoption Goes From Here
The clearest forward-looking signal in the current evidence base isn’t a forecast, since no credible forecast belongs in this article without a cited source — it’s the adoption gap documented above: guidance systems above 50% of major-crop acreage versus variable rate technology in the 20-40% range for the same crops. Closing that gap, not any single new product category, is the most measurable trajectory for US precision agriculture over the next several USDA survey cycles.

For readers tracking this over time, the durable method is simple: return to USDA ERS publication 105893 and its successor releases, compare the new adoption percentages against the 2016/2019 figures cited in this article, and treat any market-size or funding claim that doesn’t cite a specific survey round or reporting period with the same skepticism this article has applied to its own gaps.
Further reading:
FAQ
Q: What percentage of US farms use precision agriculture technology?
A: It depends on the technology. USDA’s Economic Research Service found automated guidance systems on 50%+ of corn, soybean, cotton, rice, and wheat acreage in 2019, while variable rate technology reached 37.4% of corn acreage in 2016 and 22.7% of cotton acreage in 2019. There isn’t one single “precision agriculture adoption rate” — each technology and crop combination has its own figure.
Q: How many agritech startups are there in the UK and Europe?
A: Startus Insights, using Tracxn data, counted 1,740 agritech companies in the UK as of its 2024 report. DigitalFoodLab counted roughly 3,000 active agrifoodtech startups across Europe as of 2024-2025.
Q: What share of agritech funding goes to Europe versus elsewhere?
A: DigitalFoodLab found Europe captured 28% of global agrifoodtech funding in 2024, implying the remaining 72% went to North America, Asia-Pacific, and other regions combined.
Q: Is there a published agritech startup count for the United States?
A: Not from a government source as of this review. US counts are maintained by private platforms like Crunchbase, PitchBook, and AgFunder, which update continuously — check those directly for a current figure rather than relying on a static number.
Q: What’s the difference between agritech and agrifood supply chain startups?
A: Agritech (precision agriculture, farm management software) sells primarily to farms. Agrifood supply chain startups (traceability, cold-chain logistics, provenance platforms) sell to processors, distributors, and retailers. The two are often grouped together in market reports, which can overstate either segment’s individual size.
Q: How is China approaching irrigation technology in farming?
A: China has pursued large-scale, centrally coordinated irrigation modernization across major grain-producing provinces as part of national water-efficiency policy, mechanizing canal and pivot systems at a regional scale that differs structurally from the farm-by-farm adoption pattern typical of US and European agritech deployment.
Q: Where can I find updated precision agriculture adoption figures?
A: USDA ERS updates precision technology adoption data through its “Charts of Note” series at ers.usda.gov/data-products/charts-of-note, typically with about a two-year lag between data collection and publication.
Q: What role does Singapore play in agritech beyond its own domestic market?
A: Singapore functions as a research and logistics hub — anchored by institutions like the National University of Singapore and Temasek Life Sciences — and as a gateway for startups entering Southeast Asian and broader Asia-Pacific markets, supported by a regulatory environment favorable to novel food and controlled-environment agriculture ventures.
Discussion
Questions, corrections or field experience? Share them below. First-time comments are reviewed before they appear, and your email is never published.
No comments yet. Be the first to add a question or your experience.

 Linx Agritech
 Adinet
 Save Your Soils
 YelloSkye
 GalaxEye Space
 Grandstream Algérie
 XOS Realty
 Geospatial Lab Africa
 Agro La Gándara
 HIPSAC
 ZOL Zimbabwe
 Juligerm
 AdBio
AdBio MISE Maroc
 NWNS
NWNS Red August Group
 Farm Inc
 WeMe Global
 Agrotoken
 Blue BearX
 Licence holder · Niger · Gold










