

Reviewed August 2026 against USDA’s Economic Research Service, USDA’s National Agricultural Statistics Service, and Kentucky State University’s precision-agriculture adoption research.
Precision Ag Best Practices That Pay Off on U.S. Farms
Precision ag best practices means running GPS guidance, yield mapping, variable-rate inputs, and satellite or sensor-based scouting as one connected system rather than a single gadget. USDA’s Economic Research Service found that 70% of large-scale U.S. crop farms were already running autosteer guidance and 68% were using yield monitors, yield maps, or soil maps, based on 2023 survey data published by USDA ERS in December 2024. The gap that decides whether these tools pay off is farm size: midsize operations trail at 52% guidance adoption, and a tool built for a 3,000-acre corn-soybean operation rarely fits a diversified 80-acre farm the same way.

What Digital Technologies in Agriculture Actually Cover
“Digital technologies in agriculture” is an umbrella term for five distinct tool categories, and mixing them up is why so many farm-tech pitches sound identical. Each one solves a different problem:
- GPS guidance and autosteer — steers tractors, sprayers, and combines along programmed lines to cut pass overlap and reduce operator fatigue.
- Yield monitors and yield/soil maps — record output and soil variability by exact field location, the data layer everything else is built on.
- Variable-rate technology (VRT) — adjusts seed, fertilizer, or chemical rates automatically as equipment crosses zones defined by the maps above.
- Satellite and remote-sensing monitoring — flags crop stress, moisture deficits, and pest pressure between field visits, without new field hardware.
- Farm management software — ties records, input costs, and field history together for compliance and planning.
For a side-by-side rundown of how these compare on cost and complexity, see our guide to modern agricultural technologies. The pattern across every USDA release to date is the same: adoption climbs with farm size, and mapping technology consistently outpaces automated application technology.
Precision Ag Best Practices, Ranked by What U.S. Farms Actually Use
Here is the practice order that matches real adoption data rather than marketing sequence. Start with mapping before automated application — a variable-rate system has nothing to act on without a map telling it where field conditions differ.
| Practice | Large-scale crop farms (2023) | Midsize farms (2023) | What it does |
|---|---|---|---|
| GPS autosteer guidance | 70% | 52% | Steers equipment along programmed lines, cutting overlap and fatigue |
| Yield monitors, yield maps, soil maps | 68% | Not broken out separately in this USDA release | Captures where output and soil conditions differ across a field |
| Variable-rate seed, fertilizer, or chemical application | Lags well behind guidance and mapping in every USDA release published so far | Lags well behind guidance and mapping in every USDA release published so far | Adjusts application rate automatically inside zones the mapping above defines |
USDA ERS republishes this series periodically in its Charts of Note; recheck the source chart each season for the updated share before you budget around last year’s number.

How Adoption Has Grown Since the 2012 USDA Baseline
USDA’s earliest detailed precision-ag survey, covering soybean farms in 2012, found guidance-system adoption at 34% and yield-monitor adoption at 51% (USDA ERS). The most recent release — large-scale crop farms broadly, not soybean farms specifically, so the two populations are not identical — puts guidance at 70% and yield/soil mapping at 68%. Guidance adoption roughly doubled across that stretch; the technology moved from a minority practice to the default on the biggest operations.
Digital Solutions in Agriculture: Software, Sensors, and Satellite Layers
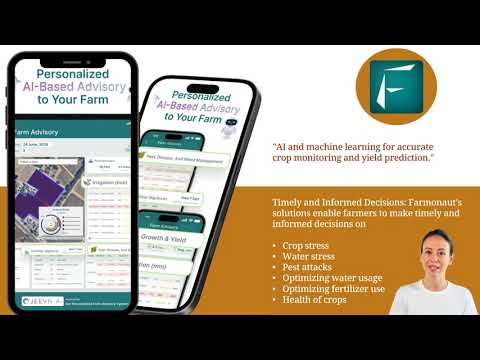
“Digital solutions in agriculture” is usually the delivery layer wrapped around the technologies above — the software, subscription, or advisory service that makes the raw data usable without a data-science team on staff. Three delivery models dominate: standalone farm management software for record-keeping and compliance; in-field IoT sensor networks for soil moisture and nutrients; and satellite-based monitoring paired with AI advisories that need no field hardware at all. Farmonaut’s platform sits in that third category — real-time satellite crop health monitoring, AI-based advisories, and resource-management tools accessible from a phone or browser.
Explore our solutions:



Precision Agriculture Solutions for Small Farms: What Actually Fits
Small family farms — those under $350,000 in gross cash farm income, USDA’s own threshold — made up 86% of all U.S. farms in 2023, operated 41% of agricultural land, and produced 17% of the value of production (USDA ERS). That mismatch between farm count and land share is exactly why hardware-heavy precision ag struggles on small acreage: fixed equipment cost has less area to spread across.
Kentucky State University researchers surveying small-scale Kentucky farmers found that adoption of precision agriculture technology “is shallow” among that group, and that farm size and years of farming experience — not income, education, or gender — were the factors most associated with whether a farmer had adopted any precision tool (Pandeya, Gyawali, and Upadhaya, Kentucky State University). That points small operators toward the category least dependent on acreage:
| Digital ag category | Field hardware required | Fit for a farm under $350,000 GCFI |
|---|---|---|
| Satellite monitoring plus AI advisories | None beyond a phone or computer | Cost does not scale with acreage or machine count |
| Retrofit GPS autosteer guidance | One receiver and steering kit per tractor | Cost spreads over acres worked; favors farms already running larger equipment |
| Variable-rate seeders, sprayers, spreaders | New or upgraded implement plus rate controller | Input savings need enough acreage to exceed the equipment cost |
| In-field IoT soil-moisture or nutrient sensors | Multiple field-installed sensors plus a gateway | Cost scales with sensor count — hardest category to justify on small, scattered parcels |

The land-fragmentation problem is not unique to the United States — for a look at how satellite and digital tools are being layered onto a smallholder-heavy region on the other side of the world, see our related coverage of Uttar Pradesh farming and agritech land insights.

Climate-Resilient Practices and Irrigation That Compound With Precision Ag
Precision tools work best paired with agronomic practices, not instead of them: conservation tillage, cover cropping, and planned crop rotation all reduce input needs before a variable-rate system ever adjusts a rate. For the trade-offs of rotating crops versus continuous single-crop planting, see our crop rotation pros and cons breakdown, and for how sustainable-intensification practices are scaling in other major growing regions, see how African agriculture is applying sustainable farming methods.
Irrigation is where the numbers are sharpest. USDA NASS’s 2023 Irrigation and Water Management Survey counted 212,714 irrigated farms working 53.1 million irrigated acres, applying 81 million acre-feet of water — an average of 1.5 acre-feet per acre, unchanged from 2018, even as total water use fell 2.8% over that five-year span (USDA NASS, published October 2024). Groundwater from on-farm wells supplied 54% of that water; the remainder came from surface and other sources. Sprinkler systems covered 12.6 million more acres than gravity irrigation nationwide.
Estimate Your Own Irrigation Savings
National averages will not tell you what precision scheduling is worth on your own fields, so plug your acreage, application rate, and water cost into the calculator below.
Estimated result:
Assumptions: uses your entered acreage, application rate, and water cost only — it does not model crop-specific water requirements, well-pumping energy cost, or infrastructure investment needed to enable variable-rate irrigation. The 1.5 acre-feet-per-acre and 15% starting values reflect the 2023 USDA NASS national average and a conservative scheduling-only reduction; replace both with your own farm’s numbers.
Farmonaut’s API and Developer Tools for Precision Ag
Farmonaut also offers our satellite and weather data directly to developers building custom farm management or advisory tools, rather than only through the consumer app.
Explore our API for developers:
Farmonaut API
API Developer Docs

FAQ Section
Q1: What are the most important precision ag best practices to start with?
A1: Start with the two technologies already at majority adoption on large U.S. farms — GPS autosteer guidance (70% of large-scale crop farms in 2023) and yield or soil mapping (68%) — before adding variable-rate equipment. Mapping is what tells a variable-rate system where field conditions actually differ, so sequencing it first avoids paying for automation with no data to act on.
Q2: What’s the difference between digital technologies and digital solutions in agriculture?
A2: Digital technologies are the individual tools — GPS receivers, yield monitors, soil sensors, satellite imagery. Digital solutions are how those tools get packaged and delivered to a specific farm’s problem: as standalone software, an in-field sensor network, or a satellite-and-advisory subscription that needs no field hardware.
Q3: Can small farms afford precision agriculture, or is it only for large operations?
A3: Hardware-based categories — retrofit guidance, variable-rate implements, in-field sensor networks — get harder to justify as acreage shrinks, because their cost is fixed per unit while the acreage to spread it across is small. Software and satellite-based monitoring avoid that constraint since cost tracks subscription tiers rather than field hardware count, which is why Kentucky State University researchers found precision-ag adoption shallow among the state’s small-scale farmers even as farm size and experience predicted who did adopt.
Q4: How much water can precision irrigation actually save?
A4: USDA’s 2023 survey shows U.S. irrigated farms averaged 1.5 acre-feet applied per acre. What precision scheduling saves against that baseline is set by your own system’s starting efficiency and how much you cut application by — use the calculator above with your farm’s own acreage, rate, and water cost rather than a single national figure.
The Bottom Line
Precision ag best practices are not one product — they are a sequence: map the field, steer accurately, then automate application once the data justifies it. USDA’s own numbers show that sequence is still incomplete on most U.S. farms, guidance and mapping are well ahead of variable-rate adoption, and farm size remains the single biggest predictor of what a given operation can use. Recheck the linked USDA releases each season; these shares move every time ERS and NASS republish them.
Discussion
Questions, corrections or field experience? Share them below. First-time comments are reviewed before they appear, and your email is never published.
No comments yet. Be the first to add a question or your experience.

 Red August Group
 Farm Inc
 JJM Farms
 WeMe Global
 Pixxel
 Agrotoken
 Blue BearX
 Insignito
 Croptimum
 DnCubed
 Field Capacity
 Indosistim Teknologi
 Liquify Digital
 CU Foods
 BeyondTech Global
 Rouge VC
 AgroGreen Dynamics
 AgroRisk
 Oath Inc
 Reddane Farming
 Licence holder · Niger · Gold










