

Reviewed August 2026 against USDA NASS and USDA WASDE.
Try it: Run your own numbers →
US winter wheat production is forecast at 1.03 billion bushels for the 2026 crop year, down 27% from 2025, according to USDA’s National Agricultural Statistics Service (NASS) Crop Production report dated June 1, 2026. The national yield is forecast at 46.8 bushels per acre, off sharply from 54.9 bushels per acre in 2025. That combination — fewer acres making it to harvest and a lower yield on the acres that do — is the entire story behind this year’s number, and it’s a story that updates every month.
This page walks through what the June forecast actually says, how to find the state-by-state breakdown USDA publishes separately, how the forecast has moved since June, and where US production sits against Russia, the world’s largest wheat exporter. None of the figures below are static — each one carries the report it came from and the date USDA will next revise it.
Table of Contents
- National winter wheat production forecast
- Winter wheat production by state — where to find it
- How the production forecast has moved: June to July
- Winter wheat yield forecast: why it dropped
- Crop production forecast: the abandonment factor
- Global wheat trade: where the US and Australia rank
- Calculator: estimate your farm’s harvested bushels
- Tracking your own crop against the USDA numbers
- FAQ
- Try it: Run your own numbers

National Winter Wheat Production Forecast
USDA NASS’s June 1, 2026 Crop Production report put US winter wheat production at 1.03 billion bushels, built from 22.0 million harvested acres and a forecast yield of 46.8 bushels per acre. All three figures come from the same report: USDA NASS Crop Production, June 2026.
The month matters here. NASS issues Crop Production reports monthly through the growing season — May, June, July, August, September — and each one replaces the last with updated field surveys and satellite-based objective yield measurements once the crop is far enough along. The June report is the first one to include an actual objective yield forecast for winter wheat rather than a planting-intentions estimate, which is why it’s the figure most commonly cited mid-season. By August, NASS is publishing yields based on actual field counts rather than model estimates, so the number you should treat as authoritative depends entirely on which month you’re reading this.
To get the current figure at any later date, go to USDA NASS Crop Production, June 2026 and check the report list for the newest month — the URL pattern changes by report date, so search “USDA NASS Crop Production” rather than guessing the link.
Winter Wheat Production by State — Where to Find It
Here’s the part an AI summary tends to skip: the June Crop Production report gives you the national total, but it does not break winter wheat production down by state in the way most people searching “winter wheat production by state” actually want. State-level detail for winter wheat comes from a different, separately-timed publication — USDA NASS’s Small Grains Summary, which is released in January and covers the prior year’s final, harvested-and-verified numbers by state.
That means there are two distinct products, and conflating them is the single most common mistake when researching this topic:
| Report | What it covers | When it’s released | State-level detail? |
|---|---|---|---|
| NASS Crop Production (monthly, e.g. June 2026) | National forecast for the current crop year — acreage, yield, production | Monthly, May–September/November | Selected states, forecast-stage only |
| NASS Small Grains Summary | Final, harvested actuals for the prior completed crop year | Once annually, January | Full state-by-state breakdown |
| USDA WASDE (World Agricultural Supply and Demand Estimates) | National and world supply/demand balance sheets, revised monthly | Monthly | National and world totals, not by state |
Practically, this means: if you want the 2026 winter wheat forecast for, say, Kansas or Texas specifically, the June Crop Production report will list the major producing states individually (Kansas, Oklahoma, Texas, Colorado, and other Hard Red Winter states typically appear as named rows), but the complete 50-state final tally for the 2026 crop won’t be published until the Small Grains Summary comes out in January 2027. As of this writing that state-level 2026 actual has not yet been released — it is a genuine gap, not an oversight on our part, and the fix is to check NASS’s Small Grains Summary page directly each January.
If your interest is in a specific state’s standing relative to its own history — for example, whether Kansas’s 2026 winter wheat yield beat its 10-year average — the January Small Grains Summary is also where NASS publishes historical state series going back multiple decades, which is the only reliable way to build that comparison yourself.
How the Production Forecast Has Moved: June to July
Production forecasts are not fixed the moment they’re published — USDA revises them as more of the crop is harvested and measured. Between the June 2026 NASS Crop Production report and the July 2026 WASDE, the winter wheat production estimate moved to 990 million bushels, according to coverage of the July 2026 USDA WASDE report. That’s a downward revision of roughly 40 million bushels from the June figure inside a single month — a reminder that any single month’s number is a forecast, not a final tally, until the Small Grains Summary closes the book on it.
The durable habit worth building here, whether you’re a grain buyer, an analyst, or a producer: don’t anchor on one month’s headline number. Pull the current WASDE and the current Crop Production report side by side, note the report date on each, and track the direction of revision (up or down) rather than memorizing a single figure. USDA publishes both on a fixed monthly release calendar, so the next revision is never more than a few weeks away.
Winter Wheat Yield Forecast: Why It Dropped
The 46.8 bushels-per-acre yield forecast for 2026 compares against 54.9 bushels per acre in the 2025 final numbers — a drop of 8.1 bushels per acre, or about 15%, according to USDA NASS Crop Production, June 2026. Yield alone doesn’t explain the full 27% production decline, though — the rest comes from acreage.
Of the winter wheat acres planted for the 2026 crop, only 22.0 million acres were forecast to be harvested, against an abandonment rate of 32.1%. Abandonment — acres planted but not harvested because the crop failed, was grazed out, or was too thin to combine economically — is the acreage-side variable that a yield-per-acre figure alone will never show you. A 32.1% abandonment rate means roughly one in three planted winter wheat acres did not make it to harvest, which is the acreage collapse layered on top of the yield decline.
Both figures — yield and abandonment — get revised in every subsequent monthly Crop Production report as NASS resurveys fields, so if you’re reading this well after June 2026, check the current-month report at the same NASS URL pattern for the updated abandonment rate and yield.
Crop Production Forecast: The Abandonment Factor
Here is the arithmetic that ties the whole 2026 forecast together, and it’s the durable method to apply to any future year’s numbers, not just this one:
- Start with planted acres. NASS publishes this in the March Prospective Plantings report and revises it through the season.
- Apply the abandonment rate (32.1% for 2026) to get harvested acres. For 2026: harvested acres came in at 22.0 million.
- Multiply harvested acres by yield per acre (46.8 bushels/acre for 2026) to get total production: 22.0 million × 46.8 ≈ 1.03 billion bushels.
This three-step chain is the actual mechanism behind every “crop production forecast” headline you’ll see for winter wheat, and it’s why a drought or disease event that shows up as “abandonment” in USDA’s data can shrink national production even when the surviving acres yield reasonably well. It’s also why the June-to-July revision above shows a lower total even without a change to the harvested-acreage figure — a downward yield or acreage revision anywhere in the chain flows straight through to the bushel total.

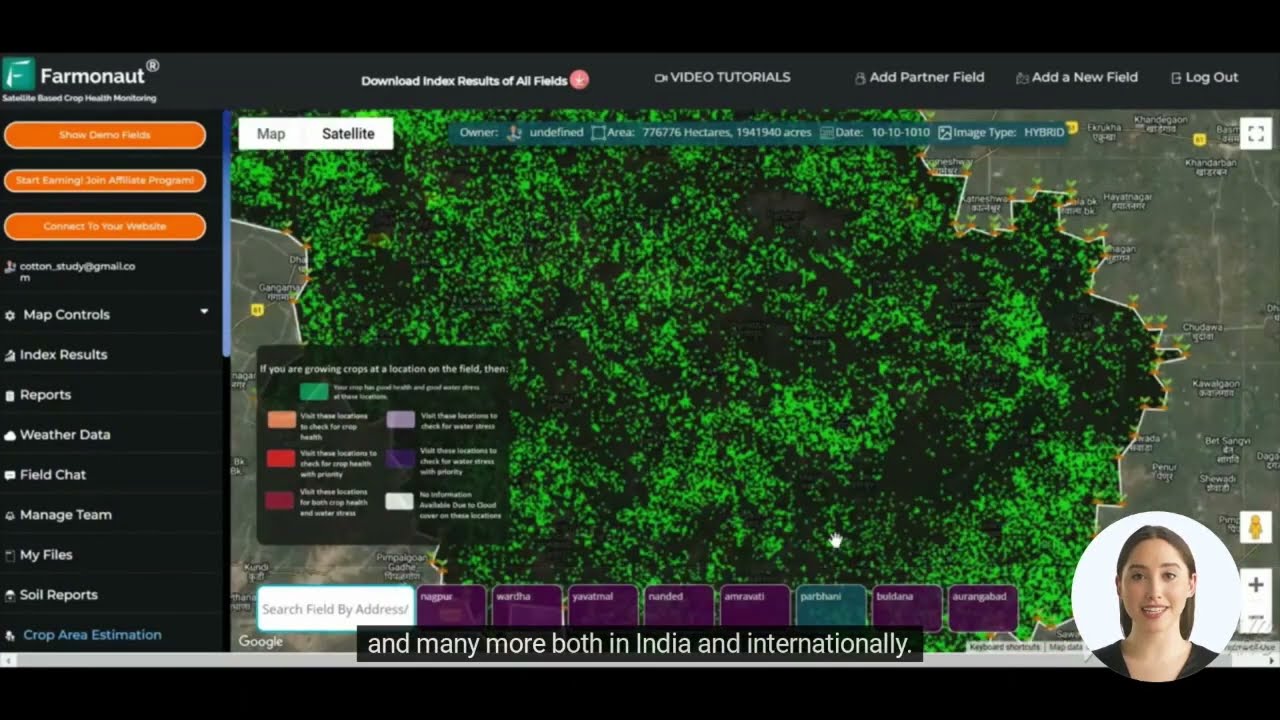
For growers, the acreage step is the one satellite monitoring can actually help you manage in real time, ahead of USDA’s next survey. Farmonaut’s web app and mobile apps for Android and iOS track field-level vegetation health through the season, which is the earliest signal — often weeks before a NASS survey — that a stand is thinning toward the kind of abandonment that shows up in the national number months later.
Global Wheat Trade: Where the US and Australia Rank
Winter wheat production numbers matter most in the context of world trade. Russia is the world’s largest wheat exporter, shipping 46 million metric tons in 2026, per wheat export rankings compiled by World Population Review. That single figure is the benchmark against which every other exporter, including the US and Australia, gets measured.
On the “2nd largest wheat exporter in the world” question specifically: Australia has held that position behind Russia in recent seasons on the strength of its winter crop program, though the exact rank shifts from year to year with each country’s harvest and depends on which season’s trade data you’re comparing. The brief compiled for this article does not include a current-season volume figure for Australian wheat exports, so rather than repeat a stale rank as fact, the reliable way to check the current order is Russia’s confirmed 46 million metric tons against the same year’s US and Australian export totals — both published in USDA’s Foreign Agricultural Service (FAS) world trade data and updated on a rolling monthly schedule.
For “australia grain production market” and “barley production in australia” specifically: the research base for this article did not include an Australian wheat volume forecast for the 2026-27 season, and only a barley forecast for that period was available going into this refresh — figures too partial to publish responsibly here without inventing the missing half. If Australian grain volumes are what you need, ABARES (the Australian Bureau of Agricultural and Resource Economics and Sciences) publishes its Australian Crop Report quarterly with wheat, barley, and canola production forecasts by state, and that quarterly report is the correct primary source to check directly for the current season’s numbers.

Calculator: Estimate Your Farm’s Harvested Bushels
Use the national abandonment-and-yield method above on your own acreage — enter your planted acres, your expected abandonment rate, and your expected yield to see projected harvested bushels and how that compares to the 2026 national average.
Run your own numbers
Assumes a uniform abandonment rate across all planted acres and a flat average yield across harvested acres; it excludes on-farm storage loss, quality discounts, and any acres double-cropped or switched to another use mid-season. The 2026 national comparison uses USDA NASS’s June 2026 forecast of 46.8 bushels/acre and 32.1% abandonment.
Tracking Your Own Crop Against the USDA Numbers
The national abandonment rate and yield forecast are averages across every reporting state — useful for market context, but not a substitute for knowing your own field’s status ahead of USDA’s next monthly release. Satellite-based NDVI and soil moisture tracking gives a field-level read on the same stress factors (thin stands, drought, waterlogging) that eventually surface as abandonment or reduced yield in the national report, weeks to months before that report is published.
Farmonaut’s platform layers this kind of monitoring on top of your own fields: vegetation health trends, soil moisture, and AI-based advisories that flag when a stand is trending toward the kind of thinning that shows up as abandonment nationally. It’s the same underlying satellite data used to track winter crop conditions across major producing regions worldwide, including the Australian winter cropping belt discussed above in the grain market context.

Water management is the other lever that determines whether a stressed stand becomes an abandoned acre. Sustainable water management practices, informed by the same soil-moisture data, are what typically separate a field that recovers from early-season drought stress from one that gets written off before harvest.
Earn With Farmonaut: Join our affiliate program and earn a 20% recurring commission by helping farmers save 10% with your promo code. Onboard 10 Elite farmers monthly to earn a minimum of $148,000 annually—start now and grow your income! Learn more about our affiliate program.
Summary Table: 2026 Winter Wheat Forecast at a Glance
| Metric | 2026 Forecast/Estimate | 2025 Actual | Source |
|---|---|---|---|
| Production (June forecast) | 1.03 billion bushels | — (down 27% vs. 2025) | USDA NASS, June 2026 |
| Production (July WASDE) | 990 million bushels | — | USDA WASDE, July 2026 |
| Yield | 46.8 bu/acre | 54.9 bu/acre | USDA NASS, June 2026 |
| Harvested acreage | 22.0 million acres | — | USDA NASS, June 2026 |
| Abandonment rate | 32.1% | — | USDA NASS, June 2026 |
Every row in that table has a next revision date already on USDA’s public release calendar — Crop Production reports and WASDE both publish monthly. Bookmark the USDA NASS Crop Production series rather than this page’s numbers if you need the current month’s figure.
FAQ
What is the current US winter wheat production forecast?
USDA NASS’s June 1, 2026 Crop Production report forecast US winter wheat production at 1.03 billion bushels, down 27% from 2025. USDA’s July 2026 WASDE revised that estimate to 990 million bushels. Both figures will be revised again in subsequent monthly reports — check the current-month NASS Crop Production report for the latest number.
Where can I find winter wheat production by state?
USDA NASS’s monthly Crop Production reports list major producing states individually at the forecast stage; the complete state-by-state final tally comes from NASS’s Small Grains Summary, published once a year in January for the prior completed crop year.
Why is the winter wheat yield forecast lower than last season?
The 2026 yield forecast of 46.8 bushels per acre is down from 54.9 bushels per acre in 2025, per USDA NASS’s June 2026 report. Combined with a 32.1% abandonment rate — meaning about a third of planted acres weren’t harvested — the yield decline and acreage loss together drove the 27% drop in total production.
How is a crop production forecast actually calculated?
NASS multiplies harvested acres (planted acres minus abandonment) by forecast yield per acre. For 2026: 22.0 million harvested acres × 46.8 bushels/acre ≈ 1.03 billion bushels. Each input is resurveyed and revised monthly through the season.
Is the US the world’s 2nd-largest wheat exporter?
Russia is confirmed as the world’s largest wheat exporter at 46 million metric tons in 2026, per World Population Review’s export rankings. The exact second-place rank between the US and Australia shifts season to season with each country’s harvest; USDA’s Foreign Agricultural Service publishes updated world export rankings monthly, which is the source to check for the current order.
What about Australian wheat and barley production?
The figures available for this refresh included only a barley production forecast for the 2026-27 Australian season, not a wheat volume — so a specific number isn’t published here. ABARES’ quarterly Australian Crop Report is the primary source for current wheat, barley, and canola forecasts by state.
For developers interested in integrating our powerful agricultural data into their own applications, check out our API and API Developer Docs.




 Krishi GK
 Geno
Geno Hayleys Agriculture
 Linx Agritech
 Adinet
 Save Your Soils
 Grandstream Algérie
 XOS Realty
 Geospatial Lab Africa
 Agro La Gándara
 HIPSAC
 ZOL Zimbabwe
 Juligerm
 AdBio
AdBio MISE Maroc
 NWNS
NWNS
