

Reviewed August 2026 against USDA NASS, USDA FAS, and Trading Economics.
Try it: Run your own numbers →
Corn Futures Forum: Prices, Export Trends & Analysis
Corn futures (CBOT cash spot) were trading at $464.85/bushel on August 18, 2026, per Trading Economics, with weekly export inspections running 81.7% above the same week a year earlier. Corn futures are standardized contracts traded on the Chicago Board of Trade that let farmers, grain merchandisers, and speculators lock in a price for corn delivered in a future month; the price moves on U.S. production estimates, export demand, the dollar, and competing feedstuffs like wheat and soybeans. Below is what a spot-price snapshot won’t tell you: how the current number compares to the last three marketing years, where U.S. corn is actually going, and a calculator to translate a price move into dollars for your own bushels.
Table of Contents
- Current Corn Price and What Moved It
- What Are Corn Futures? A Working Definition
- Corn Export Trends: Who’s Buying U.S. Corn
- U.S. Corn Production and Yield Context
- Corn Market Analysis: The Factors That Move Price
- Corn Price-Move Calculator
- Trading and Hedging Approaches
- How Satellite Data Fits Into Corn Market Analysis
- FAQ
- Try it: Run your own numbers
Current Corn Price and What Moved It
As of August 18, 2026, CBOT cash corn was quoted at $464.85/bushel, according to Trading Economics. The same source reports that U.S. weekly corn export inspections in the most recent week on record ran to 1.91 million tonnes, an increase of 81.7% versus the equivalent week a year earlier. Those two data points — price and physical export flow — routinely move in opposite directions in corn, and that gap is exactly why headline price alone is a weak signal on its own.
Price and shipment data both refresh on different clocks: CBOT settlement prices post daily at 4:00pm CT via cmegroup.com/market-data, while export inspections update weekly through USDA FAS at fas.usda.gov/data, with roughly a one-week reporting lag. If you’re reading this more than a few weeks after August 2026, treat the $464.85 figure as a historical marker and pull the live number from Trading Economics or CME Group directly — do not assume it still holds.
The forum-style discussion around “corn futures forum” queries usually centers on one question: is the export strength enough to offset a large domestic crop? The next two sections give you the raw numbers for both sides of that question — U.S. production and where the export bushels are actually landing — rather than a general answer.
What Are Corn Futures? A Working Definition
A corn futures contract is a standardized agreement traded on the Chicago Board of Trade (part of CME Group) to buy or sell 5,000 bushels of corn at a set price on a set future delivery date. Contracts trade in cents per bushel and settle in the delivery months of March, May, July, September, and December. Three groups use them for different reasons:
- Farmers and grain elevators sell futures or use options to lock in a price for corn they haven’t harvested yet, protecting against a price drop before delivery.
- Grain processors and livestock feeders buy futures to lock in an input cost before they need the physical corn.
- Speculators and index funds take positions with no intention of delivering or receiving physical corn, betting on price direction based on supply, demand, and macro factors like the dollar.
The contract price is not the same as your local cash price. Local elevator bids equal the futures price plus or minus a regional “basis” that reflects local supply, transportation cost, and demand — a topic covered further below. Corn futures trade nearly continuously, Sunday evening through Friday afternoon Central Time, with brief daily maintenance breaks, which is why “real-time” quotes are meaningful for this commodity in a way they aren’t for, say, a monthly government report.
Corn Export Trends: Who’s Buying U.S. Corn
Export data is the most direct way to check whether international demand for U.S. corn is holding up, and it’s reported with more granularity than most traders realize. As of May 2026, accumulated U.S. corn exports to Mexico for the 2025/26 marketing year reached 17.8 million metric tons, according to USDA FAS data compiled by IndexBox/USDA FAS. Mexico is consistently the largest single destination for U.S. corn, driven by its livestock feed and food-processing sectors, and that 17.8 million ton figure represents the accumulated total from the start of the marketing year through May, not a single month’s shipment.
On top of the destination-level number, the weekly export inspections figure gives a near-real-time read on the pace of loading: 1.91 million tonnes in the most recent reported week of August 2026, up 81.7% from the same week a year prior. That’s the figure “real-time corn export flow data” searches are actually looking for — and it is genuinely close to real-time, since USDA publishes it weekly rather than waiting for a quarterly or annual roll-up.
How to Track Export Trends Yourself
Export figures are published on a fixed cadence, so you can refresh these numbers without waiting for another article:
- Weekly export inspections and sales — USDA FAS, fas.usda.gov/data, updated weekly with roughly a one-week lag.
- Marketing-year accumulated exports by destination — USDA FAS export sales reports, referenced in the IndexBox summary linked above, updated monthly.
- Daily futures and cash price context for export competitiveness — Trading Economics, updated continuously during trading hours.
A gap worth naming plainly: comprehensive global supply-and-demand context, including competing exporter volumes from Brazil and Argentina, is not published in a single USDA table alongside U.S. figures. That comparison requires pulling from FAO or private agricultural forecasting services separately — we won’t invent a Brazil or Argentina export number here because it isn’t in our source data.
U.S. Corn Production and Yield Context
Export and price numbers only make sense against the size of the crop behind them. The final 2025 U.S. corn yield estimate was 186.5 bushels per acre, per USDA NASS. Total 2025 U.S. corn production came in at 16.8 billion bushels, according to the USDA NASS November 2025 crop production report. That report is the final word for a crop year — NASS revises its estimates through the growing season and locks the number in November.
Yield varies sharply by state. Iowa, the top corn-producing state, projected 219 bushels per acre for 2025 — more than 32 bushels per acre above the national average — per NASS county-level data summarized by farmdocdaily.illinois.edu. That gap matters for basis and logistics: a strong Iowa crop concentrated near ethanol plants and river terminals behaves differently in the cash market than the same bushels would in a state with less processing infrastructure nearby.
Where to Get the Current Crop Year’s Numbers
NASS QuickStats (quickstats.nass.usda.gov) updates yield and production estimates monthly during the growing season, with the final number for a crop year locked in the November report. The USDA’s WASDE report — released monthly, with the August edition traditionally carrying the first survey-based yield forecast for the current crop — is the standard first look at the following marketing year’s production; as of this review in August 2026, USDA’s 2026/27 corn production forecast had not yet been published in our source data, so we’re not going to guess at it. Check the current WASDE release directly for that number once it’s out.
Corn Market Analysis: The Factors That Move Price
Four forces recur in almost every corn price move, and understanding how they interact is more useful than memorizing any single day’s quote.
1. U.S. Production Relative to Trend Yield
A crop that comes in above the trend-line yield (186.5 bushels/acre nationally for 2025) tends to pressure prices lower into harvest, all else equal, because it adds supply against relatively fixed near-term demand. A shortfall does the reverse. This is the single biggest swing factor because U.S. corn output is large enough to move global balance sheets.
2. Export Demand and Destination Concentration
With Mexico alone taking 17.8 million metric tons through May of the 2025/26 marketing year, a change in Mexican demand — driven by its own livestock sector, currency, or trade policy — has an outsized effect on total U.S. export commitments compared to a similar percentage change in a smaller destination market.
3. The U.S. Dollar
A stronger dollar makes U.S. corn more expensive for buyers transacting in other currencies, which can shift purchases toward competing exporters. Dollar strength is tracked via the U.S. Dollar Index, published continuously by ICE and referenced daily in CME Group’s own market commentary.
4. Substitute Grains, Particularly Wheat
Corn and wheat compete as livestock feed in some rations, so a sharp move in wheat prices can spill into corn even without a corn-specific supply or demand change. This substitution effect is real but doesn’t have a single published “spillover index” — it shows up as correlated price movement that traders track by watching both markets side by side rather than through one dataset.
A related but separate factor is regional basis — the difference between the local cash price an elevator pays and the CBOT futures price. Basis in Nebraska, Illinois, and Iowa moves with local rail and barge logistics, ethanol plant demand, and on-farm storage levels, but there is no single USDA aggregate table for basis by region; it has to be pulled from individual grain elevators or state extension services such as Iowa State or Purdue, which also track corn margins against input costs like nitrogen, seed, and machinery — again, not a centralized USDA figure.
Corn Price-Move Calculator
Use your own bushel volume and a price change to see the dollar impact directly, instead of eyeballing a percentage move.
Run your own numbers
Assumptions: this tool applies a flat basis you enter to both prices and does not account for delivery timing, storage cost, quality discounts, or contract fees. It's a directional estimate for comparing two price scenarios on your own bushels, not a substitute for a signed contract quote from your elevator or broker.

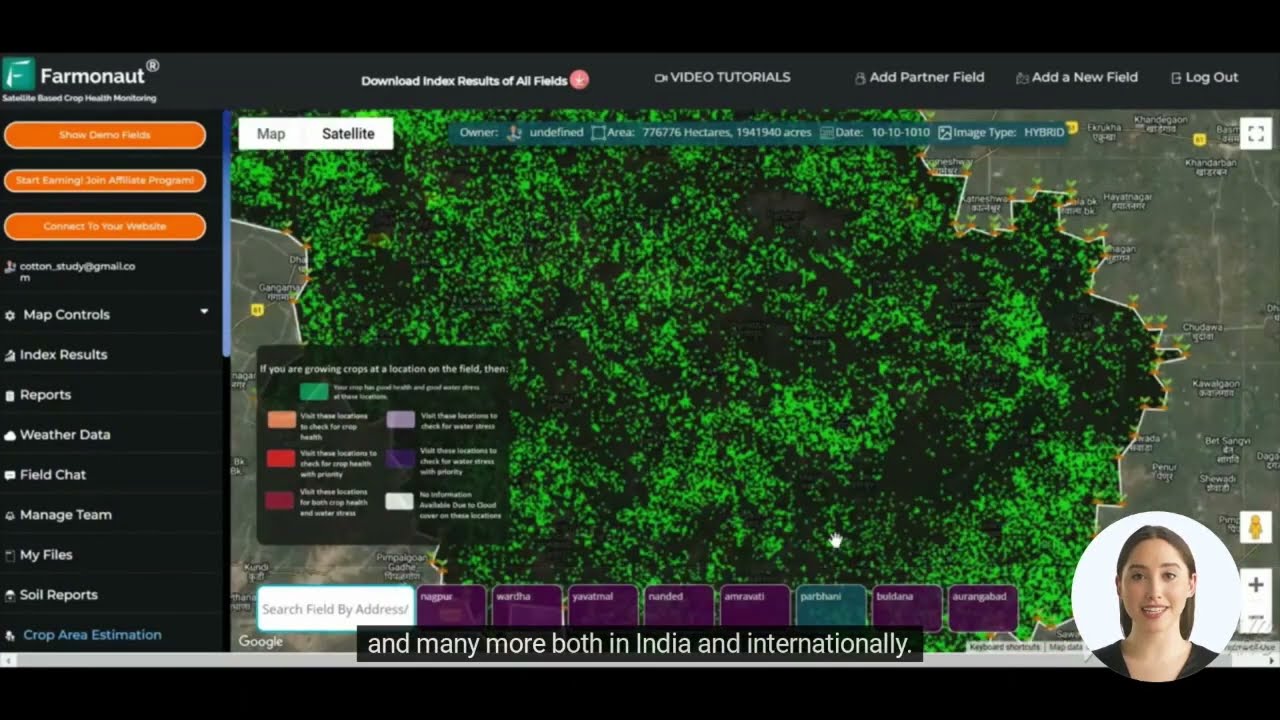
Farmonaut's satellite crop-monitoring platform gives you an independent read on crop condition ahead of the official USDA reports that move this market. Try our web app to see field-level crop health data alongside market context.
Trading and Hedging Approaches
The specific tools available to manage corn price risk haven't changed even as the numbers behind them do. What matters is matching the tool to your actual exposure:
| Approach | Who it fits | What it does | Main trade-off |
|---|---|---|---|
| Forward cash contract with elevator | Farmers with a harvest crop to sell | Locks in cash price (futures + basis) for a set delivery window | No upside if price rises; delivery is typically obligatory |
| Short futures hedge | Farmers, grain merchandisers | Locks in futures price without fixing basis or delivery point | Margin calls possible if price rises before offset |
| Put options | Farmers wanting a price floor | Sets a minimum sale price while keeping upside potential | Premium cost paid upfront regardless of outcome |
| Long futures/calls | Feedlots, ethanol plants, processors | Locks in a maximum input cost | Opportunity cost if cash price falls after locking in |
| Diversification across commodities | Investors and portfolio holders | Spreads exposure across multiple agricultural commodities rather than one crop | Dilutes concentrated upside if corn specifically rallies |
Whichever approach fits your position, the decision should reference current data, not a stale seasonal assumption: the current CBOT price, the current basis at your specific elevator, and the current export pace relative to prior marketing years. Corn price moves are driven by the interaction of these factors, not any single one in isolation.
Reading USDA Reports Without Overreacting
USDA crop reports — the monthly WASDE and the periodic Crop Production and Grain Stocks reports — routinely move futures prices within minutes of release because they update the market's supply picture all at once. A durable way to use them: compare the new number to the prior report's figure and to the average of private trade estimates published beforehand, rather than reacting to the headline number in isolation. The size of the surprise relative to expectations moves price more than the absolute figure does.

Download our Android app or get our iOS app to track field-level crop conditions between report dates.
How Satellite Data Fits Into Corn Market Analysis
USDA's own crop estimates are themselves built partly from satellite and remote-sensing inputs, and independent satellite monitoring services add a second, more frequent data stream on top of the official monthly cadence. Farmonaut's platform tracks vegetation health indices across corn-growing regions between official USDA releases, which is useful specifically because WASDE and NASS reports are monthly-or-slower — a lot can happen to a crop in the gap between reports, particularly during pollination in July and grain fill in August, the two windows where a few weeks of stress does the most damage to final yield.
Explore our API to pull crop health data directly into your own analysis, or review the API Developer Docs for integration details.


A Durable Checklist for Any Corn Market Snapshot
Numbers in this article will age. This checklist won't — use it every time you need a current read on the corn market:
- Get the current spot/futures price from CME Group's market data page or Trading Economics — updated continuously during trading hours.
- Check the latest weekly export inspection number at fas.usda.gov/data and compare it to the same week a year earlier, the way the 81.7% year-over-year figure above was calculated.
- Pull the most recent NASS yield and production estimate from quickstats.nass.usda.gov, noting whether it's an in-season estimate or the final November figure.
- Check whether a WASDE report has been released in the current month, since that's the single event most likely to move price sharply.
- Get your local elevator's cash bid to establish current basis, since national futures prices alone don't tell you what you'd actually receive.
- Cross-check crop condition against independent satellite data if you're evaluating a forecast rather than a final, harvested number.




Farmonaut Subscriptions
Frequently Asked Questions
Q1: What are corn futures, in plain terms?
A1: A corn futures contract is a standardized agreement traded on the Chicago Board of Trade to buy or sell 5,000 bushels of corn at an agreed price for delivery in a specified future month (March, May, July, September, or December). Farmers and grain buyers use them to lock in prices ahead of physical delivery; speculators trade them to bet on price direction.
Q2: What is the corn price today?
A2: CBOT cash corn was $464.85/bushel on August 18, 2026, per Trading Economics. Futures prices update continuously during trading hours (Sunday evening through Friday afternoon Central Time), so check tradingeconomics.com/commodity/corn or cmegroup.com/market-data for the live figure rather than relying on a fixed number from this page.
Q3: What's driving current corn export trends?
A3: Mexico remains the top destination, with accumulated 2025/26 marketing-year exports reaching 17.8 million metric tons through May 2026 per USDA FAS data. Weekly export inspections in August 2026 ran to 1.91 million tonnes, up 81.7% year-over-year, indicating strong near-term shipping pace even against a large domestic crop.
Q4: How does the current corn crop size compare to recent yields?
A4: The final 2025 U.S. average yield was 186.5 bushels/acre on total production of 16.8 billion bushels, per USDA NASS. Iowa, the largest producing state, came in well above the national average at 219 bushels/acre for 2025.
Q5: Where can I find real-time corn export flow data?
A5: USDA FAS publishes weekly export inspection and sales data at fas.usda.gov/data, updated with roughly a one-week lag — this is the closest thing to real-time export tracking available and is the source behind the 1.91 million tonne weekly figure cited above.
Q6: How can Farmonaut's satellite data support corn market analysis?
A6: Farmonaut tracks field-level crop health between official USDA report dates, which is useful because WASDE and NASS releases are monthly at most — vegetation stress during pollination or grain fill can affect the next official yield estimate well before that report is published.

 Geospatial Lab Africa
 KhetiBuddy
 Agro La Gándara
 Global Agrifood
 HIPSAC
 ZOL Zimbabwe
 Juligerm
 AdBio
AdBio MISE Maroc
 NWNS
NWNS Red August Group
 Farm Inc
 WeMe Global
 Agrotoken
 Blue BearX
 Insignito
 Croptimum
 DnCubed
 Field Capacity
 Indosistim Teknologi
