ESTIMATION OF THE YIELD OF POTATOES
INTRODUCTION
India is country which has an economy dependent on the agriculture. The production and distribution of agriculture is very much associated with the economy of India. Crop growth and yield monitoring over agricultural fields is an essential procedure for food security and agricultural economic return prediction. The advances in remote sensing have enhanced the process of monitoring the development of agricultural crops and estimating their yields. Achieving the maximum crop yield at the lowest investment is an ultimate goal of farmers in their quest towards an economically efficient agricultural production. Early detection of problems associated with crop yield can greatly help in reducing the loss and reaching the targeted yield and profit. Potato is classified as being the fourth major staple around the globe, which is still quickly attaining importance. The growing interest in potato, along with the diminishing agricultural lands, introduces the need for germplasm yield enhancement, better crop protection and much more efficient and productive management systems. Prediction of potato crop yield prior to the harvest period can be very useful in pre-harvest and marketing decision making. Many studies showed that traditional methods of crop yield estimation could lead to poor crop yield assessment and inaccurate crop area appraisal. In addition, these methods normally depend on rigorous field data collection of crop and yield, which is a costly and time-consuming process. Remote sensing (RS) and Geographical Information System (GIS) technologies can be used to assess the temporal variation in crop dynamics, including crop yield and its spatial variability. Visible (blue, green and red) and near infrared (NIR) portions of the electromagnetic spectrum have already proven their effectiveness in accessing information on crop type, crop health, soil moisture, nitrogen stress and crop yield. Advancement in RS techniques enhanced the use of multispectral images as an effective tool in determining and monitoring vegetation conditions, crop stress and crop yield prediction. Liu and Kogan revealed that remote sensing data offered exceptional spatial and temporal land surface characteristics, including the environmental impacts on crop growth. Numerous studies have reported that there could be a good correlation between the vegetation indices provided by the RS techniques and the crop yield and biomass. A crop yield research that is conducted at a regional scale, which employs coarse or low-resolution satellite images, can provide a broader information on the crop canopy conditions and crop yield estimates. Hence, decisions in the quantitative export and import of the product within the region could be made in assured way.
What environmental factors affect the yield?
Plant growth and geographic distribution are greatly affected by the environment. If any environmental factor is less than ideal, it limits a plant’s growth and/or distribution. Environmental factors that affect plant growth include light, temperature, water, humidity, and nutrition. It is important to understand how these factors affect plant growth and development. With a basic understanding of these factors, you may be able to manipulate plants to meet your needs, whether for increased leaf, flower, or fruit production. By recognizing the roles of these factors, you also will be better able to diagnose plant problems caused by environmental stress.
i. Light: Three principal characteristics of light affect plant growth are quantity, quality, and duration. Light quantity refers to the intensity, or concentration, of sunlight. It varies with the seasons. The maximum amount of light is present in summer, and the minimum in winter. Light quality refers to the colour (wavelength) of light. Blue and red light, which plants absorb, have the greatest effect on plant growth. Blue light is responsible primarily for vegetative (leaf) growth. Red light, when combined with blue light, encourages flowering. Plants look green to us because they reflect, rather than absorb, green light. Duration refers to the amount of time a plant is exposed to light. Photoperiod controls flowering in many plants. Scientists initially thought the length of light period triggered flowering and other responses within plants. Thus, they describe plants as short-day or long-day, depending on what conditions they flower under. We now know that it is not the length of the light period, but rather the length of uninterrupted darkness, that is critical to floral development.
ii. Temperature: Temperature influences most plant processes, including photosynthesis, transpiration, respiration, germination, and flowering. As temperature increases (up to a point), photosynthesis, transpiration, and respiration increase. When combined with day-length, temperature also affects the change from vegetative (leafy) to reproductive (flowering) growth. Depending on the situation and the specific plant, the effect of temperature can either speed up or slow down this transition. Low temperatures reduce energy use and increase sugar storage. Thus, leaving crops such as ripe winter squash on the vine during cool, fall nights increases their sweetness. Adverse temperatures, however, cause stunted growth and poor-quality vegetables.
iii. Water and Humidity: Most growing plants contain about 90 percent water. Water plays many roles in plants. It is a primary component in photosynthesis and respiration. Responsible for turgor pressure in cells (Like air in an inflated balloon, water is responsible for the fullness and firmness of plant tissue. Turgor is needed to maintain cell shape and ensure cell growth.) A solvent for minerals and carbohydrates moving through the plant. Responsible for cooling leaves as it evaporates from leaf tissue during transpiration. A regulator of stomatal opening and closing, thus controlling transpiration and, to some degree, photosynthesis. The source of pressure to move roots through the soil. The medium in which most biochemical reactions take place.
iv. Plant Nutrition: Plant nutrition often is confused with fertilization. Plant nutrition refers to a plant’s need for and use of basic chemical elements. Fertilization is the term used when these materials are added to the environment around a plant. A lot must happen before a chemical element in a fertilizer can be used by a plant. Plants need 17 elements for normal growth. Three of them carbon, hydrogen, and oxygen are found in air and water. The rest are found in the soil. Six soil elements are called macronutrients because they are used in relatively large amounts by plants. They are nitrogen, potassium, magnesium, calcium, phosphorus, and sulphur.
What soil factors affect the yield?
Potatoes grow best during cooler weather. Plant potatoes 2-4 weeks before the last frost in the spring, when the soil temperature is at least 40 degrees F. In warm climates, potatoes are planted from January to March and harvested between March and June. In cooler areas, potato-planting time is usually between April and June, with harvest between July and September. Plant potatoes where they will receive full sun, and choose and well-drained, acidic soil. Avoid planting in the same spot in which peppers, eggplants, or tomatoes were grown in the previous season, as potatoes are particularly susceptible to diseases carried by those plants. Cut seed potatoes into 1- to 2-inch squares with two to three eyes (bud sprouts) per piece, then allow them to dry for a couple of days before planting. Plant seed potatoes 12 to 18 inches apart and four inches deep. The eyes should be facing up and the cut side facing down. If planting in-ground, space rows 24 to 36 inches apart to leave room for hilling and walking between the plants.
Does harvesting method play a role in increased/decreased yield?
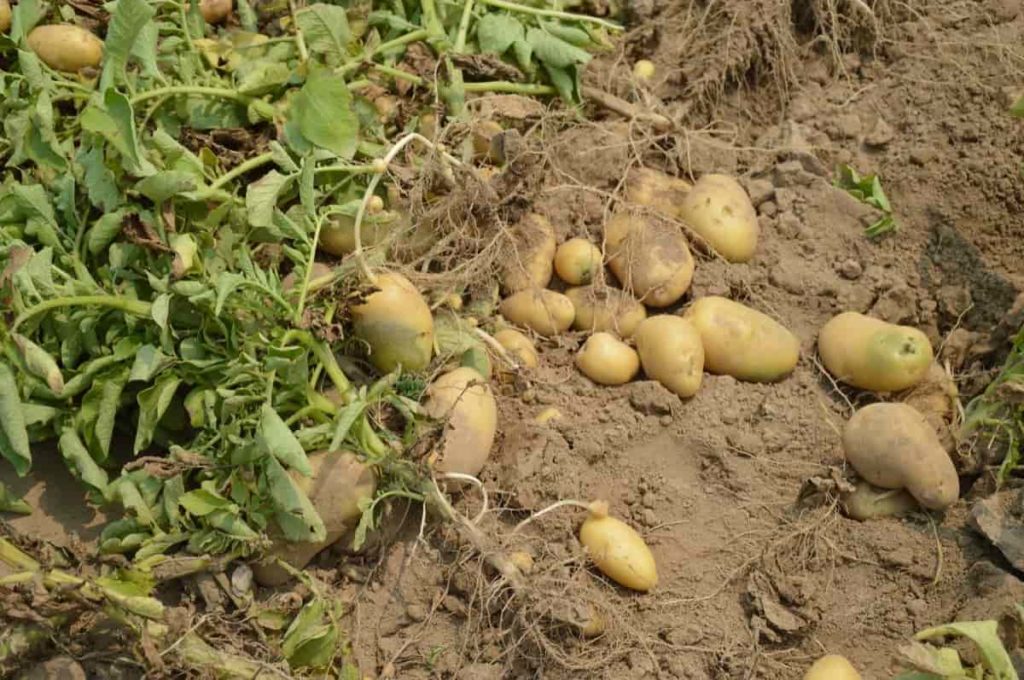
Harvest “new” (immature) potatoes for eating after the plant begins flowering. Gently scratch some soil under the plants aside and feel around for a few small tubers and pull them out, then replace the soil so the plants will keep growing. For full-sized potatoes, wait until after the tops of the plants have died. Carefully dig up the entire plant using a garden fork, doing your best not to bruise or pierce the potatoes. Bring them inside and keep them in a dark, cool, humid spot (such as an unfinished basement or garage) for two weeks to “cure” so the skins will thicken and dry for storing. Store in a covered, ventilated box or bin.
What indices are generally used for this kind of study?
Monitoring of crop growth and forecasting its yield well before harvest is very important for crop and food management. Remote sensing images are capable of identifying crop health, as well as predicting its yield. Vegetation indices (VIs), such as the normalized difference vegetation index (NDVI), leaf area index (LAI), Soil adjusted vegetative index (SAVI), normalised differential water index (NDWI) calculated from remotely sensed data have been widely used to monitor crop growth and to predict crop yield.
RESULTS
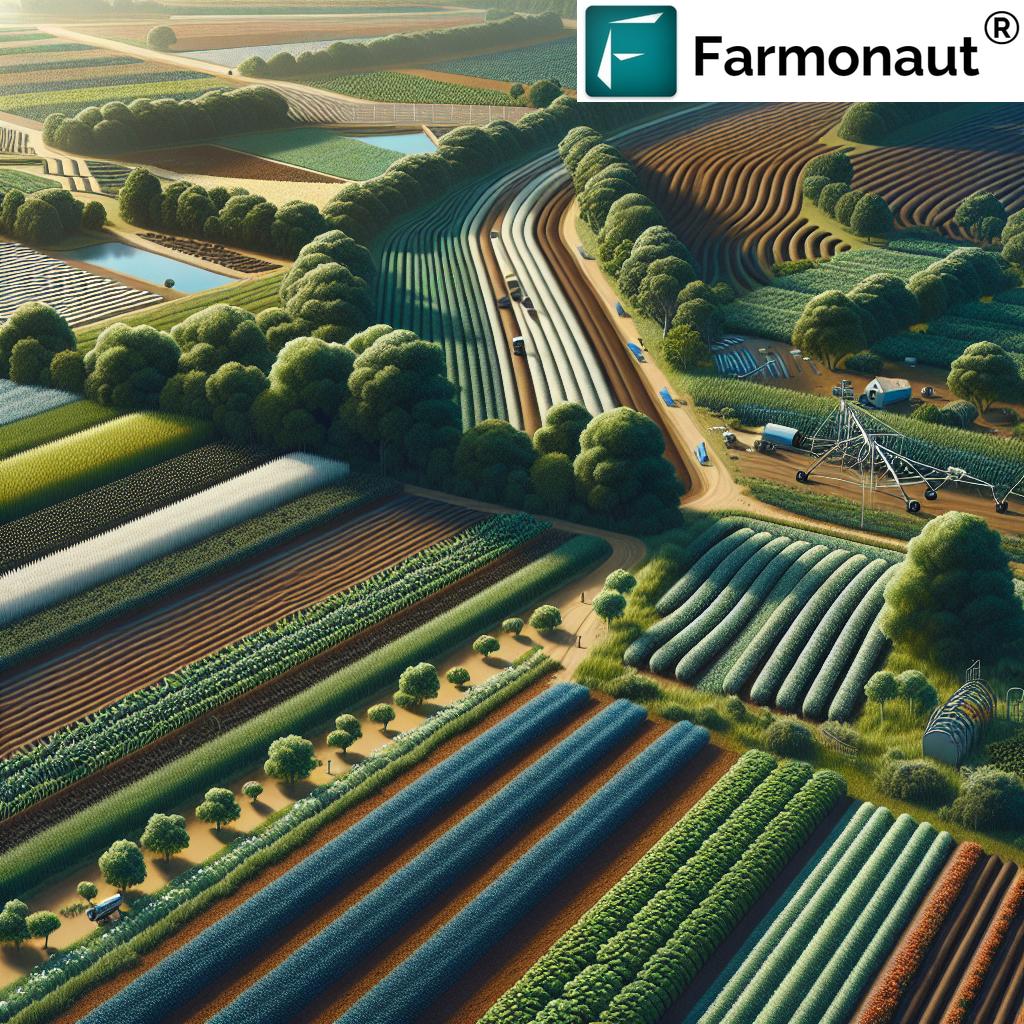
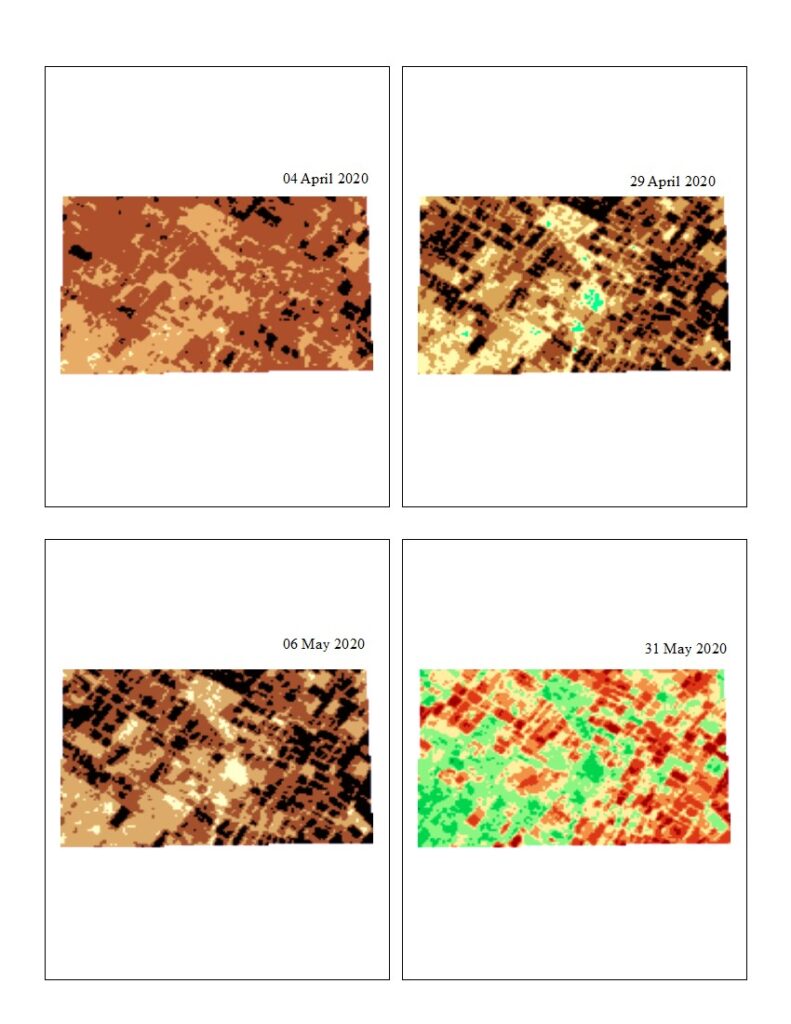
The fields of potato observed and the Normalised Differential Vegetation Index (NDVI), Normalised Differential Water Index (NDWI) Vegetative Condition Index (VCI) are calculated. The values of indices are given below.
The above image shows the NDVI values of the study area. The value of NDVI varies from -1 to +1, as the values increases the amount of vegetation increases. The study area is observed for two months from April to May. From the above image we can identify the changes in the level of vegetation for each period of time.
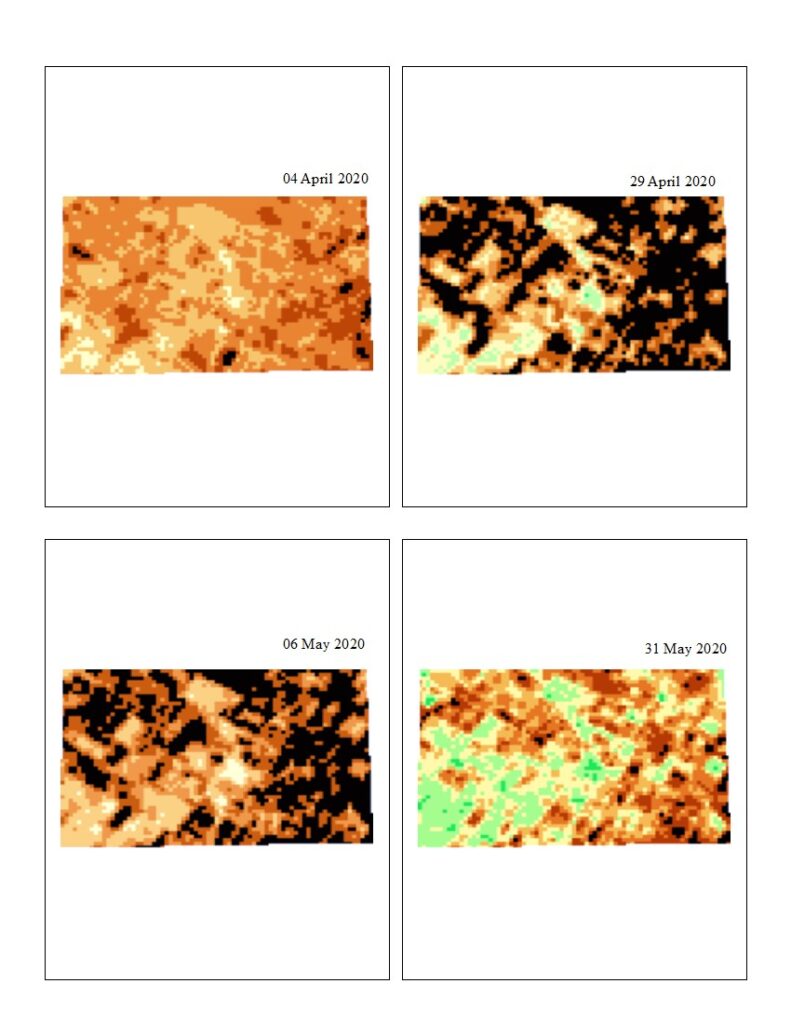
Normalized Difference Water Index (NDWI) is used to differentiate water from the dry land or rather most suitable for water body mapping. Water bodies have a low radiation and strong absorbability in the visible infrared wavelengths range. The value of NDWI varies from -1 to +1.
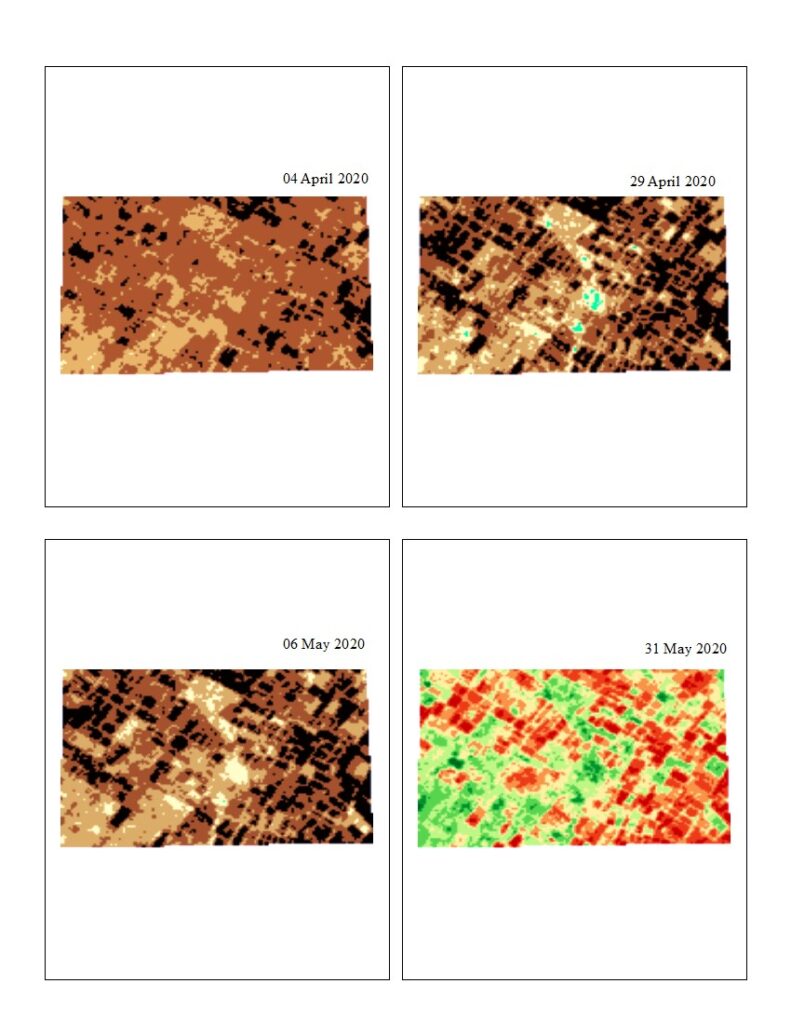
The Enhanced Vegetation Index (EVI) is an optimized vegetation index designed to enhance the vegetation signal with improved sensitivity in high biomass regions and improved vegetation monitoring through a de-coupling of the canopy background signal and a reduction in atmosphere influences. The value range of EVI is between -1 to +1 and with healthy vegetation generally around 0.20 to 0.80.
CONCLUSION
The estimation of yield of potatoes using remote sensing is a very toughest process. The cultivation of potato in the study area was during March 2020 to May 2020 and the satellite data of that period is used for the study. Various indices like NDVI, NDWI, EVI are used to estimate the growth of plants and by that estimate the outcome. The values of NDVI, NDWI and EVI for beginning of April month is 0.33, 0.32, 0.31 respectively. The crops are in the beginning stages of the growth and so NDVI and EVI value are higher. The NDWI value shows some water stress in the soil. Similarly, the values of April last week are 0.34 for NDVI, 0.23 for NDWI and 0.31 for EVI. Also, for first week of May is 0.32 for NDVI, 0.21 for NDWI and 0.31 for EVI. The results for last week of May is 0.48 for NDVI, 0.41 for NDWI, 0.48 for EVI.
The values of May last week shows that the crop has attained a very good condition. The water stress in the field is good, and so the yield of the crop will be better. On analysing the values of the different considered indices, we can conclude that the crop shows a very good health conditions, by that we can expect a very good amount of yield. The potatoes in each field of our study area will give a moderately above amount of yield.

We will keep posting about any such informative information on to our blogs, to help as many people as possible. Farmonaut is built upon a vision to bridge the technological gap between farmers and strives to bring state-of-the-art technologies in the hands of each and every farmer. For any queries/suggestions, please contact us at support@farmonaut.com.
We have some more interesting articles coming up soon. Stay tuned!
Wait!!
Before that…


