

Crop production · How-to guide
How to Improve Crop Yield: 10 Practices With Evidence
Start with a soil test and pH, set nitrogen from a rate guide, rotate crops, water at flowering and spray only above pest thresholds. Fertilizer raises yield by supplying the most limiting nutrient, but each extra pound returns less grain (Iowa State University).
Key takeaways
- Fertilizer raises yield by supplying the nutrient the soil cannot supply in time; each extra pound adds less grain than the one before.
- Iowa State’s suggested N rate for corn after soybean falls from 155 to 110 lb N/acre as the N:corn price ratio rises from 0.05 to 0.20 (main Iowa region).
- On the Morrow Plots, corn after soybean out-yielded continuous corn by 9 to 32 bu/acre in the years reported (Purdue Extension AY-230).
- SARE survey data show 3% higher corn and 4.9% higher soybean yields after five straight years of cover crops.
- Illinois anhydrous ammonia went from an $828/ton average (Sep 2025-Feb 2026) to $1,123/ton on 17 April 2026 (USDA AMS via farmdoc daily).
In this article
- How fertilizers increase crop yield
- 10 ways to improve crop yield, in the order to try them
- 1. Test the soil and correct pH first
- 2. Apply the right nitrogen rate, not the highest
- 3. Rotate crops
- 4. Grow cover crops
- 5. Choose tillage to fit your climate and soil
- 6. Give water at the critical stages
- 7. Manage pests with scouting and thresholds
- 8. Pick varieties from local trial data
- 9. Manage fields by zone
- 10. Keep records and use extension advice
- Fertilizer prices and the yield you need to break even
- Will extra nitrogen pay on your field?
To improve crop yield, find the factor that limits your field most and fix that first: soil pH and nutrients from a soil test, the right nitrogen rate, a crop rotation, water at the critical growth stages, and pest control based on scouting. Fertilizer raises yield because it supplies a nutrient the soil cannot supply in time, but each extra pound returns less grain than the one before, so the best rate is the one that pays, not the highest one (Iowa State University, 2015).
This guide covers ten practices with field evidence from university and government sources. It includes a chart of profitable nitrogen rates, a rotation yield chart from long-term plots, dated fertilizer prices for 2026, and a calculator that tells you whether extra nitrogen will pay on your own field.
How fertilizers increase crop yield
Plants need 17 essential elements. Most come from air, water and soil. Nitrogen (N), phosphorus (P) and potassium (K) are the three that crops use in the largest amounts and that soils most often run short of. When one of them is short, growth slows to the pace that nutrient allows, even if everything else is ideal. Fertilizer lifts that ceiling.
Each nutrient does a different job. Nitrogen builds proteins and chlorophyll, so a short supply shows as pale, yellow lower leaves and smaller ears or heads. Phosphorus drives energy transfer and early root growth. Potassium controls water use and stalk strength. A soil test tells you which of these your field lacks. Ontario’s agronomy guide calls soil testing the most accurate tool to decide how much extra nutrient a crop needs (OMAFRA Agronomy Guide, chapter 9).
The yield gain is not linear. The first 50 lb of nitrogen on a corn field low in N can add a lot of grain. The next 50 lb adds less. Past a point, extra nitrogen adds almost nothing and much of it is lost to water or air. Iowa State’s Maximum Return to Nitrogen (MRTN) method uses many field trials to find the rate where the last pound of N still pays for itself. That rate falls as nitrogen gets more expensive compared with the grain price.
The chart shows the Iowa State suggestions for the main Iowa region. The price ratio is the price of one pound of N divided by the price of one bushel of corn. For example, N at $0.50/lb and corn at $5.00/bu is a ratio of 0.10.
Corn after corn needs more nitrogen than corn after soybean at every price ratio. This is one reason crop rotation pays, as the rotation section shows. Illinois agronomists gave similar advice for the 2026 crop: they suggested about 180 lb N per acre in northern and central Illinois and 200 lb in southern Illinois, with anhydrous ammonia near $800 per ton and corn near $4 per bushel (farmdoc daily, August 2025). Use your own state’s guide, because soils and climates differ.
Chart
Suggested nitrogen rate falls as N gets dearer
Maximum Return to N rate, lb N/acre, main Iowa region, by N:corn price ratio ($/lb N : $/bu)
10 ways to improve crop yield, in the order to try them
The order matters. A new variety or a sensor will not fix low pH or a compacted layer. Start with the soil, then nutrients, then water and pests, then tools that fine-tune by zone.
1. Test the soil and correct pH first
Best for: every field, every three to four years, and any field where yields vary for no clear reason.
Take samples from each area that differs in soil type or history. Ask the lab for pH, P, K, organic matter and the lime requirement. Low pH locks up phosphorus and reduces how well legumes fix nitrogen. On acid soils, liming is a common first fix. Arkansas’ wheat guide notes two common problems with lime: ignoring how lime needs vary across a field, and spreading it unevenly (University of Arkansas Extension).
Healthy soil is the base for all other steps. Soil rich in organic matter holds more water, feeds soil life and resists erosion. Penn State Extension lists crusting, compaction and rill erosion as the soil conditions to check alongside nutrient levels (Penn State Extension). To raise organic matter, add compost or manure, keep residue on the surface and grow roots for more months of the year. Our guide to soil organic carbon explains how to build it.

▶ Why organic matter matters in farm soil and how it supports crops. · 7:33
2. Apply the right nitrogen rate, not the highest
Best for: corn, wheat, canola and other crops that respond strongly to N.
Start from your state or provincial rate guide, then adjust for the previous crop, manure and soil test results. Split the total: some at or before planting, the rest as a side-dress when the crop starts its fast growth. This lowers the risk of losing N in a wet spring. The Illinois economists also note that many farmers apply nitrogen above university rates and keep P and K above maintenance levels, so there is room to cut rates when prices spike (farmdoc daily, May 2026). Always follow the product label and local nutrient rules, and ask a certified crop adviser if you are unsure.
3. Rotate crops
Best for: fields in continuous corn or continuous small grains.
Chart
Corn yield gain from rotation on the Morrow Plots
Extra bu/acre for corn-soybean rotation over continuous corn, selected years, both well fertilized
Rotation breaks pest and disease cycles and leaves nutrients and soil structure for the next crop. Long-term trials show the effect clearly. On the University of Illinois Morrow Plots, corn in a corn-soybean rotation out-yielded continuous corn by 9 to 32 bushels per acre in the years reported, even though both were well fertilized with N, P and K (Purdue Extension AY-230).
Purdue’s own agronomy farm found the same pattern: continuous corn averaged 137 bu/acre in 1972 to 1977, while corn in a corn-soybean rotation averaged 150 bu/acre. These are old trials with old hybrids, so the bushel numbers are lower than today’s. The point is the gap between systems on the same soil, not the yield level.
4. Grow cover crops
Best for: fields with erosion, low organic matter or weed pressure, and farms that can plant right after harvest.
Cover crops such as cereal rye, clover and vetch protect the soil between cash crops. Their yield benefit builds over time. From national cover crop survey data, SARE reports that farmers can expect a 3% rise in corn yield and a 4.9% rise in soybean yield after five years in a row of cover crops (SARE). The first years may show little change, and costs come first, so plan for the long term. SARE’s Cover Crop Economics report looks at when the returns cover the cost of seed and planting.

▶ Seven simple sustainable farming practices that protect soil and water, explained with humour. · 4:34
5. Choose tillage to fit your climate and soil
Best for: dryland farms and sloping fields with erosion risk.
No-till protects soil structure and saves fuel, but it is not a yield boost everywhere. A global review of 5,463 paired yield comparisons from 610 studies found that no-till on its own reduces yields on average. When combined with residue retention and crop rotation, the losses shrink, and in dry climates under rainfed farming the three together raised productivity (Pittelkow et al., Nature, 2015). Ohio State trials summarised by Purdue found no-till corn did better on sloping, low-organic-matter silt loam, while plowed corn did better on flat, dark, poorly drained clay. If your field is cold and wet in spring, strip-till may be a middle path.
6. Give water at the critical stages
Best for: irrigated farms and dryland farms where you can capture more rain.
Crops use different amounts of water at different stages. The FAO method multiplies a reference evaporation rate by a crop coefficient (Kc) that is low after planting, highest around flowering and grain fill, and lower again at maturity (FAO Irrigation and Drainage Paper 56, chapter 6). Stress at flowering costs more yield than the same stress early in the season. Schedule irrigation from soil moisture readings or a water balance, not the calendar. On dryland, residue cover and good weed control keep more stored water for the crop. For more, see our guide to agriculture and water management.
7. Manage pests with scouting and thresholds
Best for: any crop with regular insect, weed or disease pressure.
Integrated pest management (IPM) uses four steps: set action thresholds, monitor and identify pests, prevent problems, then control them when needed. The US EPA explains that seeing a single pest does not always mean control is needed; the threshold is the point at which pests become an economic threat (US EPA, IPM principles). Prevention includes rotation, resistant varieties, clean seed and good timing of planting. When you do spray, rotate modes of action to slow resistance. Follow the product label and local rules for every pesticide.
8. Pick varieties from local trial data
Best for: every planting decision.
The right hybrid or variety for your maturity zone, disease risks and soil can make a large difference in yield. Use state university and provincial variety trials, which test many entries on the same sites. Look at results across several sites and years, not one plot. Match maturity to the length of your growing season, and favour disease ratings that fit the diseases you see on your farm. Seed treatment and planting at the right depth and population protect that choice.
9. Manage fields by zone
Best for: large or uneven fields with clear high and low areas.
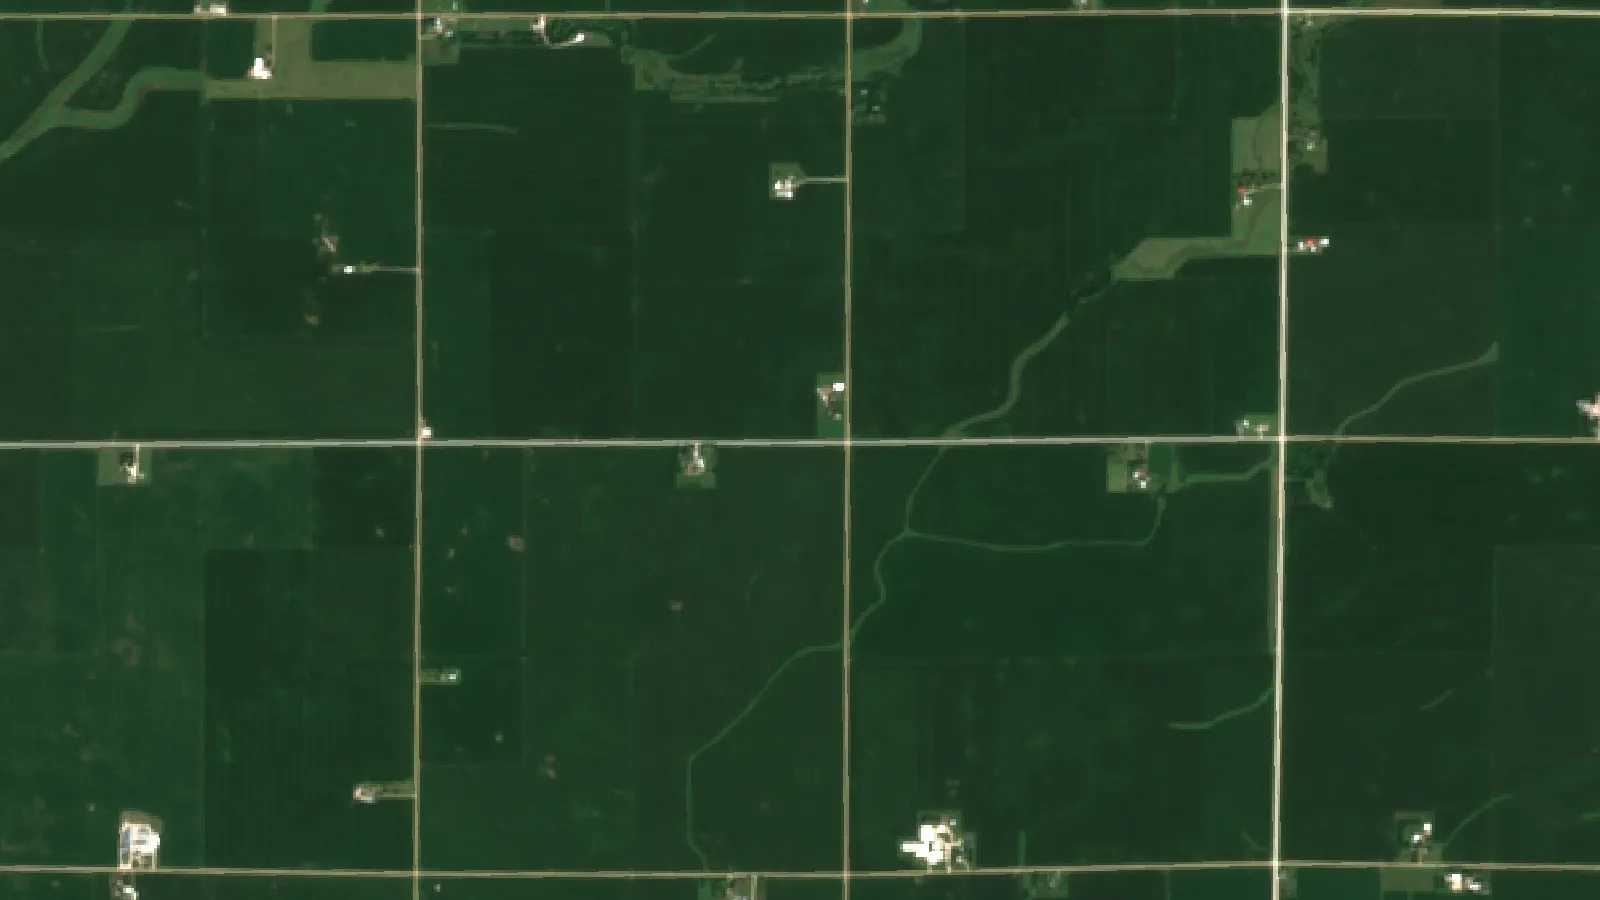
Most fields are not uniform. Yield maps, soil maps and satellite crop images show which zones always do well and which lag. You can then sample by zone, vary seed and fertilizer rates, and look for causes such as drainage, compaction or pH in the weak areas. Satellite vegetation maps help you spot where a crop is falling behind during the season so you can scout that spot first. Farmonaut provides satellite crop health maps for fields you draw on its web and mobile app. A map shows where plants differ; scouting on the ground tells you why.

▶ How precision agriculture, satellites and AI help farmers manage fields. · 23:42
10. Keep records and use extension advice
Best for: every farm that wants to know which changes paid.
Write down rates, dates, varieties, rainfall and yields by field. Leave a few untreated or standard-rate check strips when you try something new. After two or three seasons you will know what works on your farm. Local extension services and certified crop advisers can read your soil tests and trial results with you. Many universities publish guides and rate calculators online; Iowa State and Illinois are two examples used in this article.
Fertilizer prices and the yield you need to break even
Fertilizer prices changed fast in 2026. The University of Illinois reported that anhydrous ammonia averaged $828 per ton from September 2025 to February 2026, then reached $1,123 per ton by 17 April 2026 in the USDA Illinois Production Cost Report. These are Illinois retail prices reported by USDA, not a national average (farmdoc daily, May 2026).
Chart
Illinois fertilizer prices before and after the price jump
US$ per ton, Illinois retail; spring value is 17 April 2026 for ammonia, 1 May 2026 for the others
Phosphate and potash rose much less over the same period. Globally, the World Bank fertilizer price index rose more than 12% in the first quarter of 2026, and urea passed $850 per metric ton in April 2026, up 80% since February (World Bank, 2026).
When fertilizer costs more, the extra yield must be larger to pay for it. That is why the Iowa State rate falls as the price ratio rises. Check prices with more than one dealer, and use the calculator below with today’s numbers.
Will extra nitrogen pay on your field?
Enter the extra nitrogen you are thinking of adding, its price, the extra yield you expect from it, and your crop price. The calculator shows the net return per acre and for the whole field. The default values are examples set close to break-even, not a forecast. Use your own trial strips or your state’s rate guide to estimate the yield gain.
Try the numbers for your own farm below.
Calculator
Will extra nitrogen pay for itself?
Enter your own nitrogen price, expected yield gain and crop price.
- Extra nitrogen cost per acre (US$): $18
- Extra crop value per acre (US$): $18
- Net return for the whole field (US$): $0
- Yield gain needed to break even: 4.0 bu/acre
Example values only, set near break-even; not a benchmark or a forecast. Every number is your input. The yield gain should come from your own check strips or your state’s rate guide. Price inputs are examples, use today’s price.
Practices compared
The table sums up when each practice tends to pay and how soon. The evidence column names the source behind each line.
| Practice | Main effect | Time to see it | Evidence |
|---|---|---|---|
| Soil test and lime | Fixes pH and nutrient limits | First season | OMAFRA; University of Arkansas |
| Right N rate | Best return per pound of N | First season | Iowa State MRTN; farmdoc daily |
| Crop rotation | Higher yield than monoculture | Second crop | Morrow Plots and Purdue trials |
| Cover crops | Soil cover, organic matter | Three to five years | SARE survey: +3% corn, +4.9% soy after five years |
| Tillage choice | Soil and water protection | Varies by climate | Pittelkow et al., Nature (2015) |
| Water timing | Avoids stress at flowering | First season | FAO Paper 56 |
| IPM | Spray only when it pays | First season | US EPA |
| Zone management | Fixes weak areas | One to three seasons | Field maps and records |
Other ways to protect yield
Some farms gain from controlled environment growing, such as greenhouses for high-value vegetables, where light, heat and water can be set for the crop. Others add trees, hedges or grazing to the system, an approach called agroecology, which can reduce wind and water loss. For woodland on the farm, see our page on sustainable forestry. These choices depend on your market, capital and climate, so test them on a small scale first.
Climate risk is also part of yield. Heat, drought and wind at flowering cut grain set. Spreading planting dates, choosing tolerant varieties, keeping crop insurance and storing soil water all reduce the swings from year to year.
How we checked the numbers
Every number in this article comes from a university, government or peer-reviewed source named next to it. Rates and prices carry their date. The rotation data are long-term trial results, not today’s yields. Fertilizer prices are Illinois retail reports and World Bank global prices, so local prices will differ. We did not use claims about yield gains that had no named source.
FAQ
How do fertilizers increase crop yield?
They supply nutrients, mainly nitrogen, phosphorus and potassium, that the soil cannot release fast enough for the crop. When the most limiting nutrient is supplied, the plant can grow to the limit set by water, light and its genetics. Each extra unit adds less yield than the one before.
What is the fastest way to improve crop yield?
Fix the biggest limit first. On many fields that means correcting soil pH and nutrient shortfalls found by a soil test, setting the nitrogen rate from your local guide, and controlling weeds early. These act in the first season. Rotation and cover crops take longer.
Can too much fertilizer lower yield or profit?
Yes. Past the economic rate, extra nitrogen adds little or no grain, costs money and can be lost to water. Too much nitrogen can also cause lodging in small grains. Use a rate guide such as the MRTN and follow local rules.
Do cover crops reduce yield?
They can in the first years if they use water or tie up nitrogen at planting. SARE survey data show yield gains of 3% for corn and 4.9% for soybeans after five years in a row. Terminate them on time and adjust nitrogen for a rye cover before corn.
How can satellite images help yield?
They show where the crop is weaker than the rest of the field during the season, so you can scout and act sooner. They do not show the cause; you still need to check the field and test the soil.
Related pages on our site: home page · admin app for large farms · satellite and weather API docs · product traceability · carbon footprint tracking · crop loan and insurance support · fleet management
Farmonaut crop monitoring
See which parts of your fields lag
Draw your fields once and Farmonaut shows satellite vegetation maps for them through the season, on web, Android or iOS.




Sources
- Iowa State University, Nitrogen management with tight margins, ICM Conference (2015): agronext.iastate.edu
- farmdoc daily, Fertilizer decisions for the 2026 crop year (August 2025): farmdocdaily.illinois.edu
- farmdoc daily, Fertilizer cost increases resulting from the Iran conflict (May 2026): farmdocdaily.illinois.edu
- World Bank, Fertilizer prices surge as Strait of Hormuz disruptions tighten supplies (2026): blogs.worldbank.org
- OMAFRA, Agronomy Guide for Field Crops, chapter 9 Soil Fertility (2022): ontario.ca
- University of Arkansas Extension, Wheat production handbook, chapter 5: uaex.uada.edu
- Penn State Extension, Agronomic crop soil fertility: extension.psu.edu
- Purdue Extension, AY-230 Value of Crop Rotation Under Various Tillage Systems: extension.purdue.edu
- SARE, Cover Crops: sare.org
- SARE, Cover Crop Economics: sare.org
- Pittelkow et al., Productivity limits and potentials of the principles of conservation agriculture, Nature (2015): nature.com
- FAO, Irrigation and Drainage Paper 56, chapter 6 Single crop coefficient: fao.org
- US EPA, Integrated Pest Management (IPM) Principles: epa.gov
Discussion
Questions, corrections or field experience? Share them below. First-time comments are reviewed before they appear, and your email is never published.
No comments yet. Be the first to add a question or your experience.

 Saraswati Agro
 Geno
 Hayleys Agriculture
 Linx Agritech
 Adinet
 Save Your Soils
 Grandstream Algérie
 XOS Realty
 Geospatial Lab Africa
 Agro La Gándara
 HIPSAC
 ZOL Zimbabwe
 Juligerm
 AdBio
 MISE Maroc
 NWNS

 Licence holder · Niger · Gold
 Client · Somalia · Gold
 Client & affiliate partner · Ghana · Gold










