

Crop protection · IPM guide
Crop Disease Prevention: 6 IPM Steps and Spray Calculator
Integrated pest management stacks cheap prevention first: rotation, resistant varieties, clean seed and scouting. Sprays come last, and only when the expected loss is bigger than the cost. Loss data from Nature Ecology and Evolution and the Crop Protection Network, a disease table and a spray calculator.
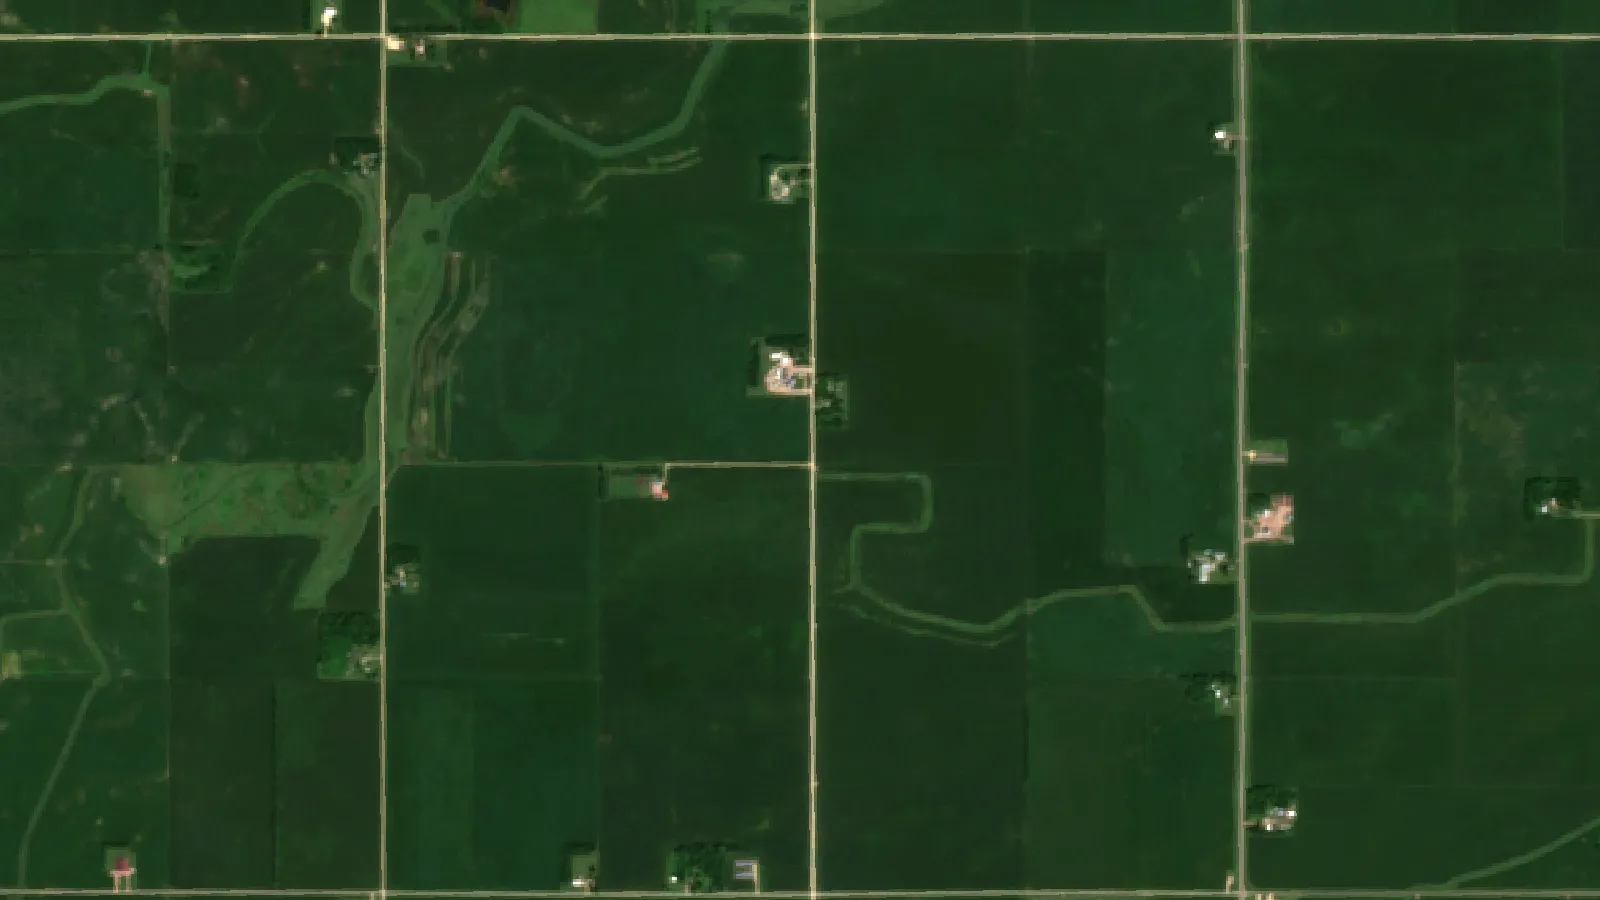
Key takeaways
- Pathogens and pests cut global yields by about 21.5% for wheat, 22.5% for maize, 21.4% for soybean, 17.2% for potato and 30.0% for rice (expert estimates, Savary et al., Nature Ecology and Evolution, 2019).
- Disease cut US corn yield by an estimated 2.9% and Ontario corn by 3.9% in 2023, about 465 million bushels, against a 9.0% average for 2012-2021 (Crop Protection Network).
- Frogeye leaf spot losses in Midwestern soybean rose from about 0.46 million to 7.6 million bushels a year between 1996-2000 and 2013-2017 (Crop Protection Network).
- The EPA’s IPM sequence is: set thresholds, monitor and identify, prevent, then control, with broadcast spraying of non-specific pesticides as a last resort.
- Spray only when the yield you expect to save is worth more than the cost of the pass; test it with the calculator on this page.
In this article
- Crop disease prevention in six IPM steps
- How much crop is lost to disease and pests?
- Step 1 and 2: prevent disease before it starts
- Step 3 and 4: scout and identify the problem
- Step 5: set an action threshold
- Step 6: choose the control method
- Common crop diseases and pests to watch
- Nutrient disorders that look like disease
- A seasonal crop disease prevention checklist
- FAQ
Crop disease prevention works best as a system, not a single spray. Pests and pathogens cut global yields of wheat by about 21.5%, maize by 22.5% and soybean by 21.4%, according to a global survey of plant health experts published in Nature Ecology and Evolution in 2019. Integrated pest management (IPM) lowers those losses by stacking cheap, preventive steps first and keeping pesticides for when scouting shows a real threat.
This guide sets out six IPM steps built on the US EPA’s four-step IPM sequence, with dated loss data, a table of common diseases and pests, and a calculator that tells you whether a fungicide or insecticide pass is likely to pay on your own numbers.
Crop disease prevention in six IPM steps
The US Environmental Protection Agency sums up IPM as a sequence: set action thresholds, monitor and identify pests, prevent, then control. Its guidance on IPM principles says that sighting a single pest does not always mean control is needed. The Food and Agriculture Organization describes IPM as combining biological, chemical, physical and crop-specific methods to grow a healthy crop and keep pesticide use low. We group the work into six steps.
- Know your field history. Write down which diseases, insects and weeds showed up in each field in past seasons, and where.
- Prevent with rotation, resistant varieties and clean seed. These steps usually cost little and help every season.
- Scout on a schedule. Walk fields weekly in the risk window, and check the same spots each time.
- Identify the problem correctly. Many leaf spots look alike. Use extension fact sheets or a diagnostic lab.
- Compare the problem with a threshold. Act only when the expected loss is larger than the cost of control.
- Control with the least risky option first, then record what you did and check whether it worked.
The steps sound simple. The gains come from doing them every season, on every field, and keeping notes.

▶ Our handbook video on spotting plant health problems and using integrated pest management. · 19:39
How much crop is lost to disease and pests?
Losses differ by crop, region and year. The Nature study by Savary and colleagues put average global losses to pathogens and pests at 17.2% for potato and 30.0% for rice, with wheat, maize and soybean in between. These are expert estimates, not measured harvest losses, and they cover pests and diseases together.
Chart
Global yield loss to pathogens and pests by crop
Percent of attainable yield lost, global average of expert estimates
North American data are more detailed. The Crop Protection Network, a group of university and extension plant pathologists, publishes yearly loss estimates for corn, soybean, wheat and cotton. Its report on corn found that in 2023, disease reduced corn yield by an estimated 2.9 percent across the U.S. and by 3.9 percent in Ontario, a total of about 465 million bushels. That was far below the 9.0% average loss for 2012 to 2021. The report notes that dry weather in many corn states lowered the risk from leaf diseases.
Some diseases grow over time. The Crop Protection Network loss calculator notes that frogeye leaf spot of soybean cost Midwestern states about 460,000 bushels a year in 1996 to 2000, but about 7.6 million bushels a year in 2013 to 2017. A disease that was minor can become a main problem within two decades, which is why field records matter.
Chart
Corn yield lost to disease
Estimated percent of yield lost, US and Ontario, Canada
Step 1 and 2: prevent disease before it starts
Most plant diseases need three things: a host, a pathogen and the right weather. Plant pathologists call this the disease triangle. Prevention removes one side of it.
Chart
Frogeye leaf spot losses in Midwestern soybean
Average yearly loss, million bushels
Rotate crops
Many fungi and nematodes survive on crop residue or in soil and wait for the same host. A break crop starves them. The Ontario field crops agronomy guide says a rotation where dry edible beans are grown only once in 3 years (or longer) helps limit root rots and white mould, which short rotations encourage. In corn and soybean areas, a two-crop rotation still helps with residue-borne leaf diseases, but longer breaks help more with soil-borne ones.
Choose resistant varieties
Resistant varieties are often one of the cheapest controls available. Seed companies and state variety trials rate hybrids and varieties for key local diseases. Cornell vegetable researchers, for example, released New York adapted tomatoes with resistance to several fungal and bacterial diseases. Check the ratings for the diseases that showed up in your own field history, not just the yield ranking.
Start clean
- Use certified seed and healthy transplants.
- Clean equipment between fields with a known problem, such as soil-borne nematodes.
- Manage residue where a disease overwinters on it, if your soil and erosion plan allows.
- Control volunteer plants and weed hosts that carry viruses and insects between seasons.
Manage the field environment
Leaf diseases spread in wet canopies. Wider rows, sensible plant density, balanced nitrogen and irrigation timed so leaves dry before night all reduce leaf wetness. Good drainage limits root rots. Balanced fertility also keeps plants strong, but extra nitrogen can make some leaf diseases worse.
Step 3 and 4: scout and identify the problem
Scouting means walking a field in a set pattern, such as a W or a zigzag, and checking a fixed number of plants at each stop. Note the crop stage, what you found, how many plants were affected and where in the field. Penn State Extension stresses that you need first-hand knowledge of the crop’s condition to choose the right controls. It also notes that many yield-limiting corn diseases do not cause problems until the reproductive stages.
Correct identification is the step most people rush. A nutrient shortage, herbicide injury or drought can look like disease. Use your state or provincial extension fact sheets, and send samples to a plant diagnostic clinic when you are not sure. The Clemson fact sheet on tomato diseases and disorders is a good example of a guide that separates infectious diseases from disorders like blossom end rot.
Where phone apps and satellites help
Image tools can help with identification and with deciding where to scout. In a 2016 study, a deep learning model trained on 54,306 leaf images reached 99.35% accuracy on a held-out test set. The images were taken under controlled conditions, so field accuracy is lower, and a person should still confirm the diagnosis.
Satellite vegetation maps show which parts of a field are growing more slowly than the rest. They do not name a disease, but they tell you where to walk first. Farmonaut provides these maps for fields you draw on the Farmonaut web and mobile app. The USDA Economic Research Service has reported that precision agriculture tools are spreading on US farms, but adoption still varies by farm size and tool.

▶ Can AI really spot crop pests? A plain test of four ways to look for them. · 6:32
Step 5: set an action threshold
An action threshold is the point at which a pest or disease is likely to cost more than controlling it. Extension guides publish thresholds for many insects as counts per plant, per sweep or per trap. For leaf diseases, thresholds are often based on disease on certain leaves at a certain crop stage, plus the weather forecast and the variety’s resistance rating.
A simple way to test a spray decision is to compare the expected yield saved with the cost of the pass. The calculator below does that for you. Price and efficacy are the inputs that matter most. University fungicide efficacy tables, such as the Crop Protection Network ratings for soybean foliar diseases, show that the same product can be excellent on one disease and poor on another.
Try the numbers for your own farm below.
Calculator
Will a fungicide or insecticide pass pay?
Enter your own area, yield, price, expected loss saved and cost per acre.
- Value of yield saved per acre: $24.00 $/ac
- Net return per acre: -$1.00 $/ac
- Loss you must prevent to break even: 3.1 %
Example values only, set near break-even; they are not a forecast or a recommendation. The yield saved is your own estimate of the loss the pass prevents, which depends on disease pressure, weather, variety and product efficacy. Include product, application and any yield lost to wheel tracks in the cost. Always follow the label and local rules, and get advice from an agronomist.
Step 6: choose the control method
The EPA guidance says that less risky controls are chosen first, such as pheromones to disrupt mating, trapping or weeding, and that broadcast spraying of non-specific pesticides is a last resort. Control options fall into four groups.
| Method | Examples | Best for |
|---|---|---|
| Cultural | Rotation, planting date, residue, spacing | Every field, every year |
| Biological | Beneficial insects, microbial products | Insects and some soil diseases |
| Physical | Traps, row covers, roguing sick plants | Small areas and orchards |
| Chemical | Fungicides, insecticides, seed treatments | Problems above threshold |
Slow down resistance
Pathogens and insects adapt. Fungicides and insecticides carry group numbers on the label (FRAC for fungicides, IRAC for insecticides). Rotate or mix groups with different modes of action, use full label rates, and do not rely on one product all season. The Crop Protection Network keeps a fungicide resistance FAQ for field crops that explains how this works.
Safety note: always read and follow the product label, check which products are registered for your crop in your country or state, and get advice from an extension agronomist or certified crop adviser before you spray. Rules differ between the US, Canada, the UK, the EU and Australia.
Common crop diseases and pests to watch
This table lists widespread problems in our readers’ main markets. It is a starting list, not a full guide. Each crop has its own disease pages on extension sites.
| Problem | Crops | Signs | Main prevention |
|---|---|---|---|
| Powdery mildew | Grapes, cucurbits, wheat | White powder on leaves | Resistant varieties, airflow |
| Downy mildew | Vines, cucurbits, lettuce | Yellow patches, grey growth below | Leaf drying, forecasts |
| Early blight | Tomato, potato | Brown spots with rings | Rotation, mulch, clean seed |
| Tar spot | Corn | Raised black dots | Hybrid choice, scouting |
| Frogeye leaf spot | Soybean | Grey spots, dark rims | Resistant varieties, rotation |
| Fusarium head blight | Wheat, barley | Bleached heads | Rotation away from corn |
| Aphids | Most crops | Curled leaves, sticky honeydew | Natural enemies, thresholds |
| Asian citrus psyllid | Citrus | Spreads citrus greening | Area-wide control, clean trees |
| Corn nematodes | Corn, soybean | Patchy stunting | Soil tests, rotation |
The University of California IPM program publishes detailed guidelines on pests such as the Asian citrus psyllid, including monitoring methods and treatment timing. Penn State Extension has fact sheets on diseases such as powdery mildew.
Nutrient disorders that look like disease
Not every sick-looking plant has a disease. Nitrogen shortage turns older leaves pale yellow. Potassium shortage scorches leaf edges. Calcium problems cause blossom end rot in tomatoes and peppers. Herbicide drift twists or cups new leaves. These disorders do not spread from plant to plant, and fungicides will not fix them. A soil or tissue test is the right next step.
A seasonal crop disease prevention checklist
- Before planting: review field history, pick resistant varieties, plan rotation, test soil.
- At planting: clean seed, sensible seed rate, seed treatment only where the risk justifies it.
- Early season: scout weekly, check stand counts, look for seedling disease and insects.
- Mid season: watch the weather, scout high-risk fields first, compare findings with thresholds.
- Late season: rate stalk and ear health, record what worked and plan next year’s rotation.
Keep the records in one place. Next year’s prevention plan starts with this year’s notes.
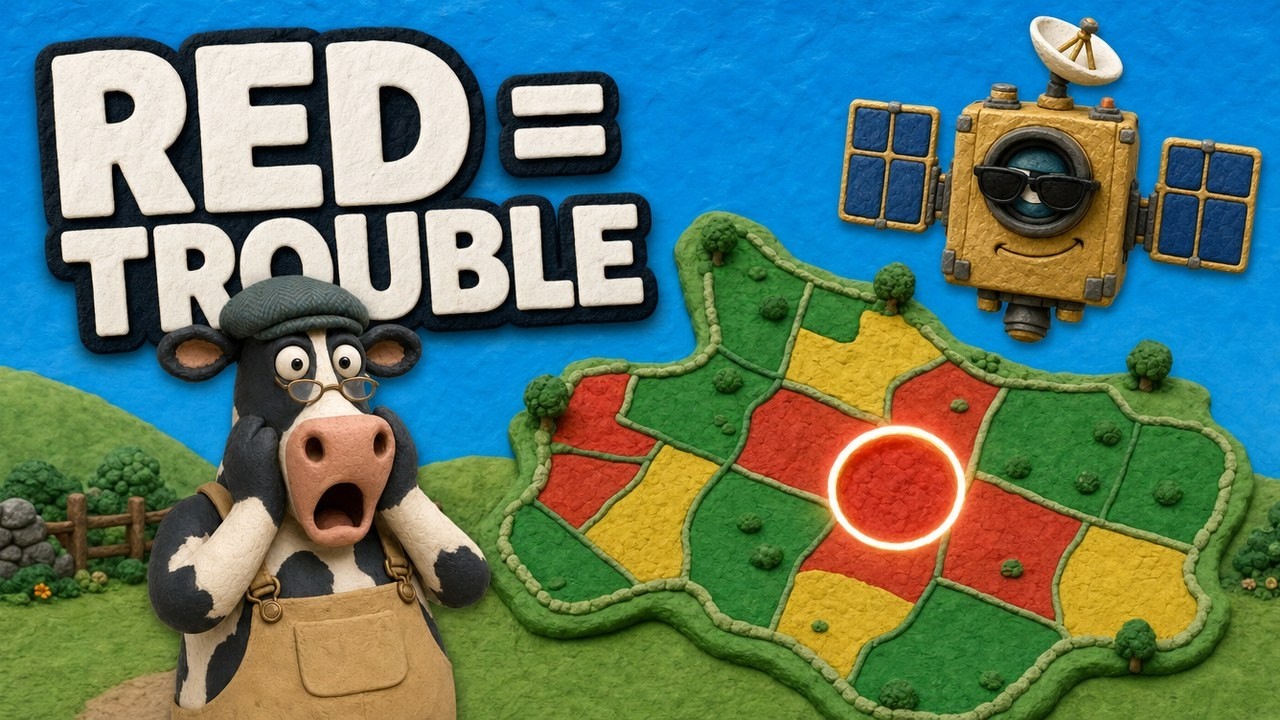
▶ How satellite NDVI maps show crop stress, so you know where to scout first. · 4:09
If this topic matters to you, read AI Plant Disease Detection & Diagnosis for Healthier Crops next.
FAQ
What is the best way to prevent crop disease?
Combine several steps: crop rotation, resistant varieties, clean seed and good field drainage. Then scout on a schedule so you catch problems early. No single step works on its own.
What does IPM stand for in farming?
Integrated pest management. It uses prevention, monitoring, thresholds and a mix of cultural, biological, physical and chemical controls, with pesticides used only when needed.
How often should I scout my fields?
Many extension guides suggest weekly checks during the main risk period, and more often in wet weather or when a disease is close by. Check your local extension guide for your crop.
Do I need to spray fungicide every year?
No. Whether a pass pays depends on disease pressure, the variety’s resistance, the weather and the crop price. Use thresholds and the calculator on this page to test the decision.
Can satellite images detect crop disease?
Satellite images show stressed areas but cannot name the cause. Use them to decide where to scout, then confirm what you find on the ground.
Related pages on our site: soybean plant diseases, corn diseases and their management, how to prevent downy mildew, early blight in tomatoes and potatoes, black Sigatoka in bananas, blossom end rot treatments, citrus greening fixes, why crop protection matters, pros and cons of modern farming, farming goals for sustainable agriculture and satellite and weather API docs.
Farmonaut crop monitoring
Know where to scout first
Draw your fields once and Farmonaut shows satellite vegetation maps through the season, so you can see which areas are falling behind, on web, Android or iOS.




Keep reading
Sources
- Savary et al., The global burden of pathogens and pests on major food crops, Nature Ecology and Evolution (2019): nature.com
- US EPA, Integrated Pest Management (IPM) Principles: epa.gov
- FAO, Integrated Pest Management: fao.org
- Crop Protection Network, Corn disease loss estimates from the United States and Ontario, Canada, 2023: cropprotectionnetwork.org
- Crop Protection Network, Field Crop Disease and Insect Loss Calculator (2026): loss.cropprotectionnetwork.org
- Crop Protection Network, Fungicide efficacy for control of soybean foliar diseases: cropprotectionnetwork.org
- Ontario Ministry of Agriculture, Food and Rural Affairs, Agronomy Guide for Field Crops, chapter 5 (2022): ontario.ca
- Cornell Vegetables, New York adapted tomatoes with resistance to multiple fungal and bacterial diseases: vegetables.cornell.edu
- Penn State Extension, Plant diseases and control: powdery mildew: agsci.psu.edu
- Clemson HGIC, Tomato diseases and disorders: hgic.clemson.edu
- Mohanty, Hughes and Salathé, Using deep learning for image-based plant disease detection, Frontiers in Plant Science (2016): frontiersin.org
- USDA ERS, Precision Agriculture in the Digital Era: Recent Adoption on U.S. Farms, EIB-248 (2023): ers.usda.gov
- UC Statewide IPM Program, Asian citrus psyllid pest management guidelines: ipm.ucanr.edu
Discussion
Questions, corrections or field experience? Share them below. First-time comments are reviewed before they appear, and your email is never published.
No comments yet. Be the first to add a question or your experience.

 KhetiBuddy
 Agro La Gándara
 Global Agrifood
 HIPSAC
 ZOL Zimbabwe
 Juligerm
 AdBio
 MISE Maroc
 NWNS
 Red August Group
 Farm Inc
 WeMe Global
 Agrotoken
 Blue BearX
 Insignito
 Croptimum
 DnCubed
 Field Capacity
 Indosistim Teknologi

 Licence holder · Niger · Gold
 Licence holder · Nigeria · Gold + lithium










