Mastering NDMI and NDWI: Advanced Satellite-Based Crop Moisture Monitoring for Precision Agriculture
In the ever-evolving world of precision agriculture, we at Farmonaut are constantly striving to provide farmers and agronomists with cutting-edge tools for effective crop monitoring and management. Two of the most powerful indices in our arsenal for assessing crop moisture content and water stress are the Normalized Difference Moisture Index (NDMI) and the Normalized Difference Water Index (NDWI). These sophisticated satellite-based indicators have revolutionized the way we approach water management in agriculture, forestry, and environmental monitoring.
Understanding NDMI and NDWI
Before we delve into the intricacies of these indices, let’s establish a clear understanding of what NDMI and NDWI are and how they differ:
Normalized Difference Moisture Index (NDMI)
NDMI is a satellite-derived index that measures the moisture content within vegetation. It is particularly useful for assessing the water content in leaves and canopy cover. The NDMI is calculated using a specific combination of near-infrared (NIR) and short-wave infrared (SWIR) spectral bands.
NDMI Formula: NDMI = (NIR – SWIR) / (NIR + SWIR)
Where:
- NIR typically corresponds to Band 5 (B05) in Landsat 8 imagery
- SWIR typically corresponds to Band 6 (B06) in Landsat 8 imagery
Normalized Difference Water Index (NDWI)
NDWI is another satellite-derived index, but it focuses more on the water content in water bodies and the moisture in soil. It’s particularly effective for mapping open water features and changes in water content of leaves. The NDWI uses green and NIR bands in its calculation.
NDWI Formula: NDWI = (Green – NIR) / (Green + NIR)
Where:
- Green typically corresponds to Band 3 (B03) in Landsat 8 imagery
- NIR typically corresponds to Band 5 (B05) in Landsat 8 imagery
The Science Behind NDMI and NDWI
Both NDMI and NDWI rely on the unique spectral properties of vegetation and water to provide valuable insights into moisture content and water stress. Here’s a deeper look at the scientific principles underlying these indices:
Spectral Reflectance Properties
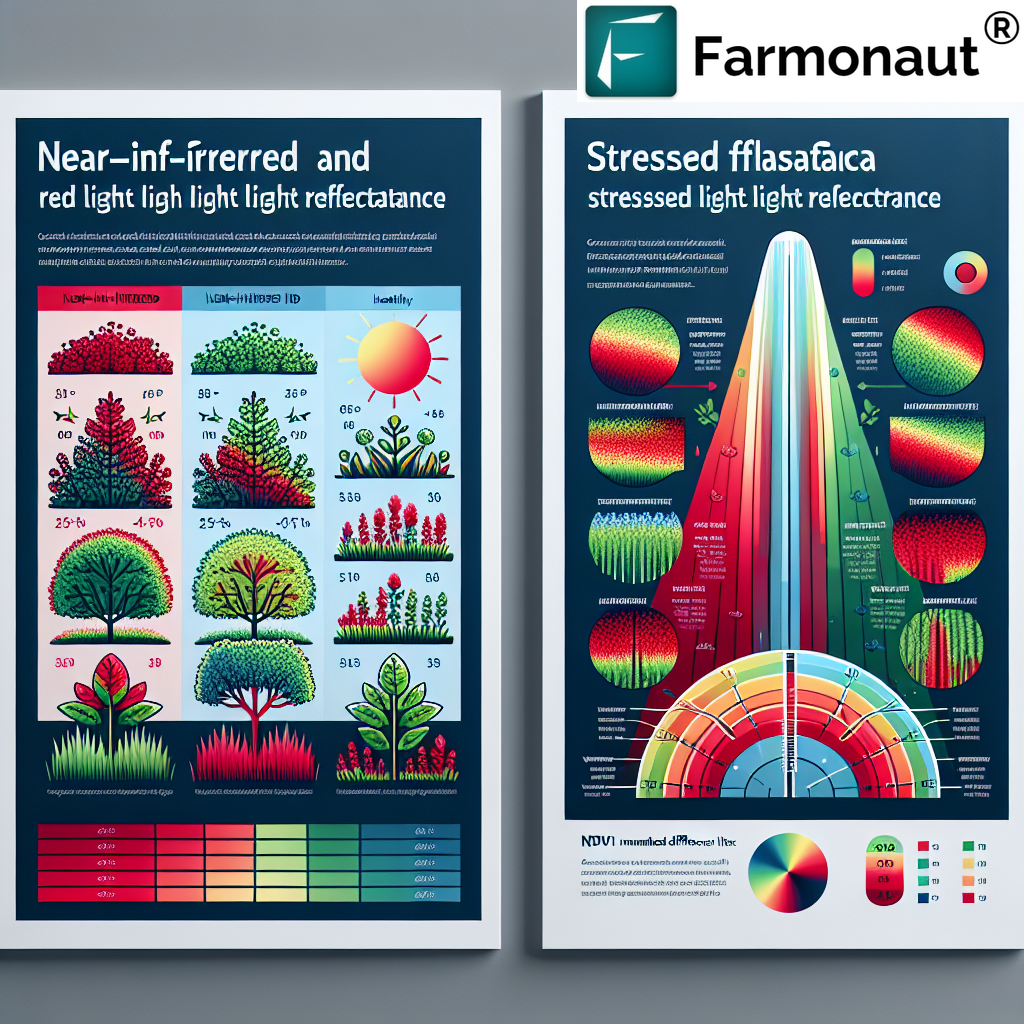
Different materials on Earth’s surface reflect and absorb light differently across the electromagnetic spectrum. Vegetation, water, and soil each have unique spectral signatures that can be detected by satellite sensors:
- Vegetation: Healthy vegetation strongly reflects NIR light and absorbs visible light for photosynthesis. The SWIR band is sensitive to moisture content in vegetation.
- Water: Water absorbs NIR and SWIR light more strongly than visible light, especially green light.
- Soil: Dry soil generally reflects more in the SWIR region compared to wet soil.
Band Combinations for Moisture Detection
By combining specific spectral bands, we can enhance our ability to detect moisture content:
- NDMI: The combination of NIR and SWIR bands is particularly effective for vegetation moisture content. As leaves become dehydrated, they reflect less in the NIR region and more in the SWIR region.
- NDWI: The green band is sensitive to chlorophyll reflectance, while the NIR band is sensitive to leaf cellular structure. This combination helps in detecting water content in leaves and distinguishing water bodies.
Interpreting NDMI and NDWI Values
Understanding how to interpret the values of these indices is crucial for effective crop monitoring and water management:
NDMI Interpretation
- NDMI values range from -1 to +1
- Higher positive values indicate higher vegetation moisture content
- Lower or negative values suggest drier vegetation or non-vegetated areas
- Typical NDMI values for healthy vegetation range from 0.2 to 0.4
NDWI Interpretation
- NDWI values also range from -1 to +1
- Positive values generally indicate open water bodies
- Values close to zero or slightly negative often represent soil or terrestrial vegetation
- Higher positive values suggest higher water content in vegetation or more open water
Applications in Precision Agriculture
At Farmonaut, we leverage these powerful indices to provide farmers with invaluable insights for precision agriculture. Here are some key applications:
1. Crop Water Stress Detection
By monitoring NDMI values over time, we can detect early signs of water stress in crops. This allows farmers to take proactive measures to prevent yield loss:
- Identify areas of the field that may require additional irrigation
- Optimize irrigation schedules based on actual crop water needs
- Detect irrigation system malfunctions or uneven water distribution
2. Drought Monitoring
NDMI and NDWI are excellent indicators for tracking drought conditions:
- Monitor regional drought patterns and severity
- Assess the impact of drought on crop health and yield potential
- Support decision-making for drought mitigation strategies
3. Crop Health Assessment
These indices provide valuable information about overall crop health:
- Identify areas of poor crop establishment or growth
- Detect pest and disease outbreaks that may affect plant water content
- Monitor crop development stages and maturity
4. Precision Irrigation Management
By integrating NDMI and NDWI data with other agronomic information, we enable precise irrigation management:
- Create variable-rate irrigation prescriptions
- Optimize water use efficiency across different field zones
- Monitor the effectiveness of irrigation practices
5. Yield Prediction and Forecasting
Moisture content is a critical factor in yield potential. By analyzing NDMI and NDWI trends, we can:
- Develop more accurate yield prediction models
- Identify areas of potential yield loss due to water stress
- Support harvest planning and logistics
Farmonaut’s Implementation of NDMI and NDWI
At Farmonaut, we’ve integrated NDMI and NDWI analysis into our comprehensive suite of precision agriculture tools. Here’s how we leverage these indices to provide actionable insights for our users:
1. High-Resolution Satellite Imagery
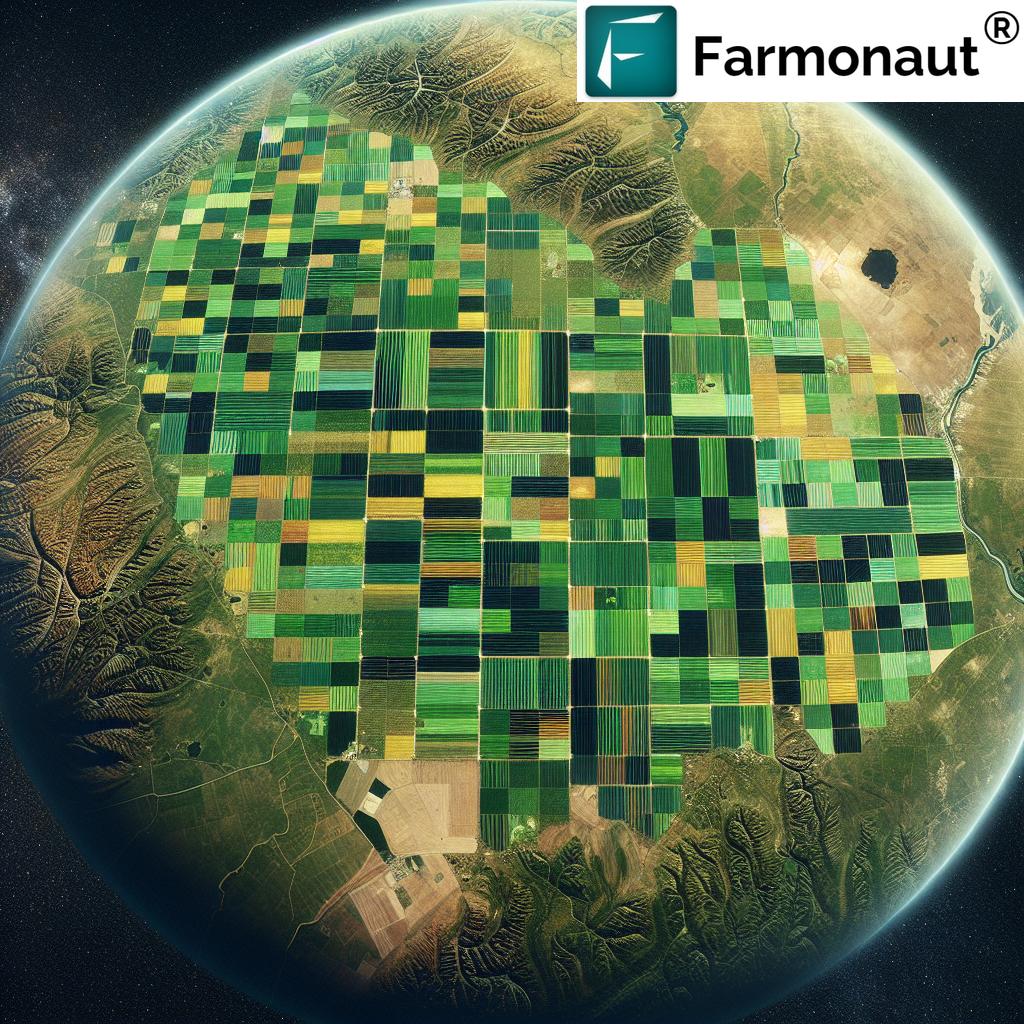
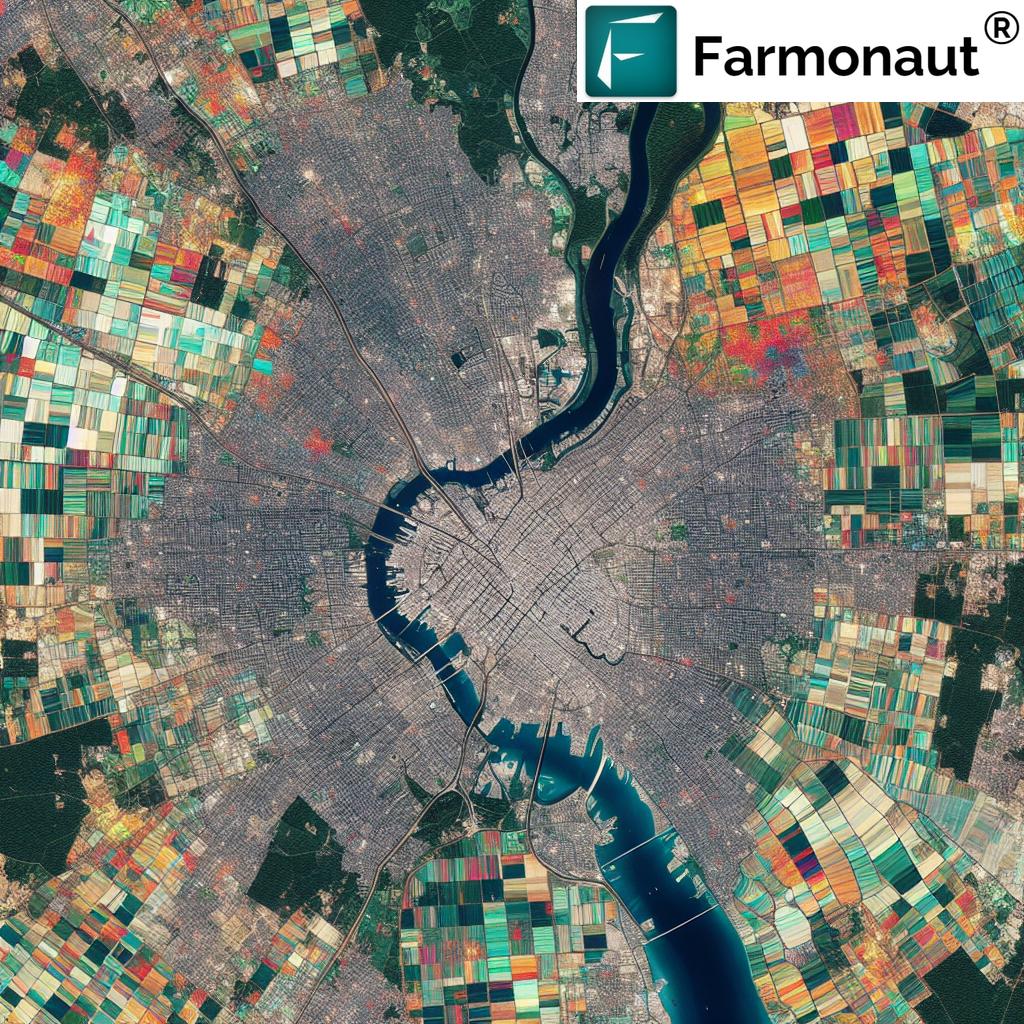
We utilize multi-spectral satellite imagery from various sources, including Landsat, Sentinel, and commercial satellites, to calculate NDMI and NDWI at field-level resolutions. This allows us to provide detailed moisture maps for individual fields and entire farming operations.
2. Temporal Analysis
Our platform automatically processes and analyzes satellite imagery over time, creating time-series data of NDMI and NDWI values. This enables us to:
- Track changes in crop moisture content throughout the growing season
- Identify trends and anomalies in water stress patterns
- Provide early warnings for developing moisture-related issues
3. Integration with Other Indices
We combine NDMI and NDWI data with other vegetation indices like NDVI (Normalized Difference Vegetation Index) to provide a comprehensive view of crop health and development. This multi-index approach allows for more nuanced and accurate assessments of crop conditions.
4. Machine Learning and AI
Our advanced algorithms use machine learning techniques to analyze NDMI and NDWI data alongside other agronomic factors. This enables us to:
- Predict areas at risk of water stress before visible symptoms appear
- Generate automated alerts for potential irrigation issues
- Provide personalized recommendations for water management
5. User-Friendly Visualization
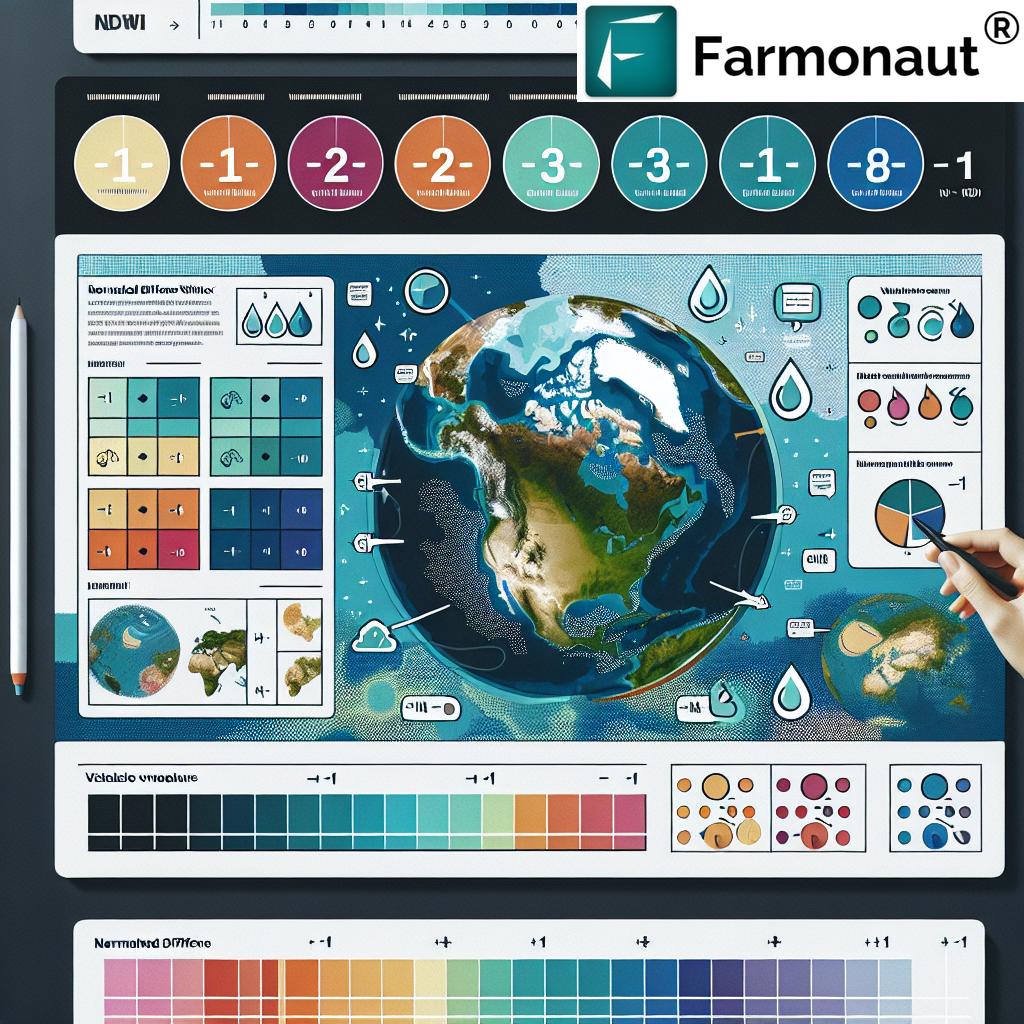
We present NDMI and NDWI data through intuitive, color-coded maps and graphs in our web and mobile applications. This makes it easy for farmers and agronomists to interpret the data and make informed decisions.
6. API Integration
For advanced users and partners, we offer API access to our NDMI and NDWI data, allowing seamless integration with other farm management systems and decision support tools. Learn more about our API capabilities at https://sat.farmonaut.com/api.
Benefits for Farmers and Agronomists
By leveraging NDMI and NDWI through Farmonaut’s platform, farmers and agronomists can realize numerous benefits:
- Improved Water Management: Optimize irrigation practices, reduce water waste, and improve crop water use efficiency.
- Early Stress Detection: Identify and address water stress issues before they become visible to the naked eye, preventing yield loss.
- Cost Savings: Reduce unnecessary irrigation and associated costs by targeting water application where it’s needed most.
- Increased Yields: By maintaining optimal moisture levels throughout the growing season, farmers can maximize crop yields and quality.
- Environmental Sustainability: Improve water conservation efforts and reduce the environmental impact of agricultural practices.
- Data-Driven Decision Making: Base irrigation and crop management decisions on objective, quantitative data rather than guesswork.
Case Studies: NDMI and NDWI in Action
To illustrate the practical applications of NDMI and NDWI in precision agriculture, let’s explore some hypothetical scenarios based on common agricultural challenges:
Case Study 1: Detecting Irrigation System Malfunctions
A large corn farm in the Midwest uses center pivot irrigation systems. By monitoring NDMI values across their fields, the farm manager notices an unusual pattern in one section of a field, with significantly lower NDMI values compared to surrounding areas. Upon investigation, they discover a clogged sprinkler head that was causing uneven water distribution. By quickly addressing this issue, they prevent potential yield loss in that section of the field.
Case Study 2: Optimizing Irrigation Scheduling
A vineyard in California uses Farmonaut’s NDMI and NDWI analysis to fine-tune their irrigation scheduling. By closely monitoring these indices, they identify specific blocks of vines that consistently show signs of water stress earlier than others. This information allows them to create a more precise irrigation schedule, applying water to different zones at optimal times. As a result, they improve grape quality and reduce overall water usage by 15%.
Case Study 3: Drought Impact Assessment
During a severe drought in Australia, agricultural researchers use NDMI and NDWI data from Farmonaut to assess the impact on various crops across a large region. By analyzing historical and current index values, they can quantify the extent of water stress and estimate potential yield losses. This information helps government agencies and insurance companies make informed decisions about drought relief programs and crop insurance claims.
Case Study 4: Precision Nutrient Management
A potato farmer in Idaho integrates NDMI data with other soil and crop health indicators to optimize their fertilizer application. They notice that areas with consistently lower NDMI values also show signs of nutrient deficiency. By addressing both water and nutrient management together, they achieve more uniform crop growth and increase their overall yield by 8%.
Challenges and Limitations
While NDMI and NDWI are powerful tools for crop moisture monitoring, it’s important to be aware of their limitations and potential challenges:
1. Cloud Cover and Atmospheric Interference
Satellite imagery can be affected by cloud cover and atmospheric conditions, which may limit data availability or introduce errors in index calculations. At Farmonaut, we use advanced cloud detection algorithms and combine data from multiple satellite sources to minimize these issues.
2. Spatial Resolution
The spatial resolution of satellite imagery can vary, which may impact the level of detail available for smaller fields or specific crop features. We offer a range of resolution options to balance detail and coverage for different user needs.
3. Temporal Resolution
Depending on the satellite source, there may be gaps between image acquisitions, which can limit the frequency of updates. Our platform combines data from multiple satellites to improve temporal resolution and provide more frequent insights.
4. Crop-Specific Calibration
Different crops and growth stages may require specific calibration of NDMI and NDWI thresholds for optimal interpretation. We continuously refine our algorithms and provide crop-specific guidance to ensure accurate analysis across various agricultural contexts.
5. Integration with Ground-Based Data
While satellite-based indices provide valuable insights, integrating them with ground-based sensors and field observations can enhance their accuracy and usefulness. We encourage users to combine our satellite data with other sources of information for comprehensive farm management.
Future Developments and Research
The field of satellite-based crop monitoring is rapidly evolving, and we at Farmonaut are at the forefront of these developments. Some exciting areas of ongoing research and future improvements include:
1. Hyperspectral Imaging
As new satellites with hyperspectral capabilities become available, we’ll be able to analyze crop moisture content with even greater precision and detail. This could lead to the development of new, more specific moisture indices.
2. Fusion with IoT Sensors
Integrating satellite-derived NDMI and NDWI data with ground-based IoT sensors will provide a more comprehensive and real-time view of crop water status. We’re working on seamless data fusion techniques to make this a reality.
3. Advanced Machine Learning Models
We’re continuously improving our machine learning algorithms to better predict crop water needs, detect stress, and optimize irrigation. This includes developing crop-specific models that account for unique physiological characteristics.
4. Drone-Based Complementary Data
While satellite imagery provides broad coverage, drone-mounted sensors can offer ultra-high resolution data for specific areas of interest. We’re exploring ways to integrate drone-based moisture sensing with our satellite analysis.
5. Climate Change Adaptation
As climate patterns shift, we’re developing long-term analysis tools that use NDMI and NDWI data to help farmers adapt their water management strategies to changing conditions.
Comparison Table: NDMI vs. NDWI
| Index Name | Formula | Application in Crop Monitoring | Farmonaut’s Implementation | Benefits for Farmers |
|---|---|---|---|---|
| NDMI | (NIR – SWIR) / (NIR + SWIR) | Vegetation moisture content, Canopy water stress | High-resolution maps, Time-series analysis, AI-driven alerts | Early stress detection, Irrigation optimization, Yield improvement |
| NDWI | (Green – NIR) / (Green + NIR) | Leaf water content, Water body mapping | Integration with NDMI, Soil moisture estimation, Flood risk assessment | Improved water management, Drought monitoring, Environmental compliance |
Conclusion
NDMI and NDWI have revolutionized the way we approach crop moisture monitoring and water management in agriculture. At Farmonaut, we’re committed to harnessing the power of these indices to provide farmers and agronomists with the most advanced, user-friendly, and actionable insights possible.
By integrating satellite-derived moisture data with our comprehensive suite of precision agriculture tools, we’re empowering farmers to make more informed decisions, optimize their water use, and ultimately improve their yields and profitability while promoting sustainable agricultural practices.
As we continue to innovate and refine our technology, we invite you to join us in this exciting journey towards a more data-driven, efficient, and sustainable future for agriculture. Explore our solutions and experience the power of advanced crop moisture monitoring for yourself.
Visit our website at https://farmonaut.com/app_redirect to learn more about how Farmonaut can transform your approach to water management and precision agriculture.
FAQs
-
Q: How often are NDMI and NDWI maps updated in Farmonaut’s platform?
A: The update frequency depends on the satellite source and your subscription level. Typically, we provide updates every 3-5 days, with options for more frequent updates in some regions. -
Q: Can NDMI and NDWI be used for all crop types?
A: While these indices are broadly applicable, their interpretation may vary for different crops. We provide crop-specific guidance and calibration to ensure accurate analysis across various agricultural contexts. -
Q: How does cloud cover affect NDMI and NDWI calculations?
A: Cloud cover can interfere with satellite imagery acquisition. We use advanced cloud detection algorithms and combine data from multiple sources to minimize data gaps and ensure reliable insights. -
Q: Can Farmonaut’s NDMI and NDWI data be integrated with my existing farm management software?
A: Yes, we offer API access that allows for seamless integration with other farm management systems. Visit https://sat.farmonaut.com/api for more information. -
Q: How accurate are NDMI and NDWI compared to ground-based soil moisture sensors?
A: While satellite-based indices provide a broader view, they complement rather than replace ground sensors. For best results, we recommend using both in conjunction for comprehensive moisture monitoring.
Ready to transform your approach to crop moisture monitoring and water management? Subscribe to Farmonaut today and unlock the power of advanced satellite-based agriculture intelligence.
For more information about our products and services, visit our website or download our mobile app:
- Web App: https://farmonaut.com/app_redirect
- Android App: Google Play Store
- iOS App: Apple App Store
- API Documentation: Farmonaut API Docs


