Farmonaut’s Comprehensive Guide to Irrigation Parameters: NDWI, NDMI, and Evapotranspiration
Welcome to our in-depth exploration of irrigation parameters and how they can revolutionize your farming practices. At Farmonaut, we’re committed to empowering farmers with cutting-edge technology and data-driven insights. Today, we’ll delve into the world of remote sensing and its application in monitoring crop irrigation conditions.
Understanding the Importance of Proper Irrigation
Irrigation is the lifeblood of agriculture. Without proper water management, crops can suffer, leading to reduced yields and potential financial losses. That’s why we at Farmonaut have developed advanced tools to help farmers monitor and optimize their irrigation practices.
In this comprehensive guide, we’ll cover three crucial irrigation parameters:
- Normalized Difference Water Index (NDWI)
- Normalized Difference Moisture Index (NDMI)
- Evapotranspiration
Let’s dive into each of these parameters and explore how they can help you make informed decisions about your crop irrigation.
1. Normalized Difference Water Index (NDWI)
What is NDWI?
The Normalized Difference Water Index (NDWI) is a remote sensing-derived index that helps assess the water content of vegetation and water bodies. It’s an essential tool for monitoring crop health and identifying areas that may require irrigation.
NDWI Formula
The NDWI formula is as follows:
NDWI = (NIR – SWIR) / (NIR + SWIR)
Where:
- NIR = Near-Infrared reflectance
- SWIR = Short-Wave Infrared reflectance
Understanding NDWI Values
The NDWI value typically ranges from -1 to 1. Here’s what different NDWI values indicate:
- Positive values (closer to 1): Indicate high water content in vegetation or presence of water bodies
- Values around 0: Represent moderate water content
- Negative values (closer to -1): Suggest low water content or dry conditions
How Farmonaut Utilizes NDWI
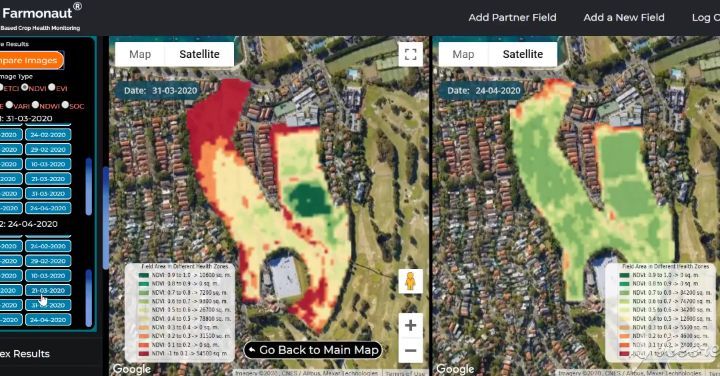
At Farmonaut, we use satellite imagery to calculate NDWI for your fields. Our advanced algorithms process this data to provide you with easy-to-understand maps and alerts about your crop’s water status. This information helps you:
- Identify areas of your field that may need additional irrigation
- Monitor the effectiveness of your current irrigation practices
- Detect potential water stress in crops before visible symptoms appear
By leveraging NDWI data, we empower you to make timely decisions about irrigation, potentially saving water resources and improving crop health.
2. Normalized Difference Moisture Index (NDMI)
What is NDMI?
The Normalized Difference Moisture Index (NDMI) is another valuable tool in our remote sensing arsenal. While similar to NDWI, NDMI is particularly sensitive to the moisture content in vegetation.
NDMI Formula
The NDMI formula is:
NDMI = (NIR – SWIR) / (NIR + SWIR)
You might notice that this formula is identical to the NDWI formula. The key difference lies in the specific wavelengths used for the NIR and SWIR bands, which make NDMI more sensitive to vegetation moisture content.
Understanding NDMI Values
Like NDWI, NDMI values range from -1 to 1:
- Higher positive values: Indicate higher moisture content in vegetation
- Values close to 0: Suggest moderate moisture levels
- Negative values: Indicate low moisture content or stressed vegetation
How Farmonaut Leverages NDMI
Our satellite-based crop monitoring system at Farmonaut calculates NDMI for your fields, providing valuable insights into your crops’ moisture status. This information allows you to:
- Detect early signs of water stress in your crops
- Optimize irrigation schedules based on actual crop moisture needs
- Monitor the effectiveness of your irrigation practices over time
By integrating NDMI data into our platform, we help you make more informed decisions about water management, potentially leading to water savings and improved crop health.
3. Evapotranspiration
Understanding Evapotranspiration
Evapotranspiration is a critical concept in agriculture that combines two processes: evaporation from the soil surface and transpiration from plants. It represents the total water loss from a cropped area to the atmosphere.
Why is Evapotranspiration Important?
Monitoring evapotranspiration is crucial for several reasons:
- It helps determine crop water requirements
- It aids in irrigation scheduling
- It contributes to understanding overall water balance in agricultural systems
How Farmonaut Estimates Evapotranspiration
At Farmonaut, we use a combination of satellite data, weather information, and advanced algorithms to estimate evapotranspiration for your fields. Our approach includes:
- Analyzing multispectral satellite imagery to assess crop health and density
- Incorporating local weather data, including temperature, humidity, wind speed, and solar radiation
- Using crop-specific coefficients to adjust estimates based on crop type and growth stage
- Applying advanced machine learning models to refine our estimates
Benefits of Evapotranspiration Monitoring with Farmonaut
By providing accurate evapotranspiration estimates, we help you:
- Determine precise irrigation needs for your crops
- Optimize irrigation scheduling to conserve water and improve efficiency
- Identify areas of your field that may be using water more or less efficiently
- Make data-driven decisions about crop management practices
Integrating NDWI, NDMI, and Evapotranspiration for Optimal Irrigation Management
At Farmonaut, we believe in the power of combining multiple data sources to provide comprehensive insights. By integrating NDWI, NDMI, and evapotranspiration data, we offer a holistic view of your field’s water status and needs.
How Our Integrated Approach Works
- Comprehensive Monitoring: We use satellite imagery to calculate NDWI and NDMI across your entire field, providing a detailed map of water and moisture distribution.
- Evapotranspiration Estimates: Our advanced algorithms estimate evapotranspiration rates, considering local weather conditions and crop characteristics.
- Data Integration: We combine these datasets to create a comprehensive picture of your field’s water dynamics.
- Actionable Insights: Our platform translates this complex data into easy-to-understand recommendations and alerts.
- Continuous Learning: Our machine learning models continuously improve, learning from historical data and outcomes to provide increasingly accurate predictions.
Benefits of Our Integrated Approach
- More accurate irrigation scheduling
- Early detection of water stress or overwatering
- Improved water use efficiency
- Potential for increased yields and reduced input costs
- Better understanding of your field’s unique water dynamics
Farmonaut’s Satellite System vs. Drone and IoT-based Farm Monitoring
While drones and IoT devices have their place in agriculture, our satellite-based system offers unique advantages. Here’s a comparison:
| Feature | Farmonaut Satellite System | Drone-based Monitoring | IoT-based Monitoring |
|---|---|---|---|
| Coverage Area | Entire fields, regardless of size | Limited by flight time and regulations | Limited by number and placement of sensors |
| Frequency of Data Collection | Regular intervals, weather-independent | Dependent on manual flights | Continuous, but only at sensor locations |
| Initial Setup Cost | Low | High (drone purchase, training) | Medium to High (sensor purchase, installation) |
| Maintenance Requirements | Minimal | Regular drone maintenance | Regular sensor maintenance and calibration |
| Data Processing | Automated, cloud-based | Often requires manual processing | Automated, but limited to sensor data |
| Scalability | Highly scalable to any farm size | Limited by operational constraints | Requires additional sensors for larger areas |
How to Get Started with Farmonaut
Ready to revolutionize your irrigation management? Here’s how you can get started with Farmonaut:
- Sign Up: Visit our web application or download our mobile app (Android | iOS)
- Map Your Fields: Use our intuitive interface to outline your fields
- Choose Your Subscription: Select a plan that fits your needs
- Access Insights: Start receiving regular updates about your field’s water status
- Implement Recommendations: Use our data-driven insights to optimize your irrigation practices
For Developers and Businesses
If you’re a developer or business looking to integrate our data into your own systems, check out our API documentation and developer resources.
Conclusion
At Farmonaut, we’re committed to empowering farmers with the tools and knowledge they need to optimize their irrigation practices. By leveraging advanced remote sensing technologies and providing easy-to-understand insights, we’re helping farmers around the world improve their water use efficiency, reduce costs, and increase yields.
Remember, proper irrigation is not just about applying water – it’s about applying the right amount of water at the right time. With Farmonaut’s comprehensive irrigation monitoring tools, you’ll have the data you need to make informed decisions and ensure your crops receive exactly what they need to thrive.
Join us in the agricultural revolution. Let’s work together to create a more sustainable and productive future for farming.
FAQs
- Q: How often does Farmonaut update its satellite imagery?
A: We typically provide updates every 5-7 days, depending on satellite availability and weather conditions. - Q: Can Farmonaut’s system work for small farms?
A: Absolutely! Our system is scalable and can provide valuable insights for farms of all sizes. - Q: How accurate are the NDWI and NDMI calculations?
A: Our calculations are highly accurate, based on well-established scientific methods and validated against ground truthing data. - Q: Does Farmonaut provide recommendations for specific irrigation systems?
A: While we don’t recommend specific equipment, our insights can help you optimize the use of your existing irrigation system or make informed decisions about upgrades. - Q: Can I integrate Farmonaut’s data with my existing farm management software?
A: Yes, we offer API access that allows integration with many popular farm management platforms. Contact our support team for more details. - Q: How does weather data factor into Farmonaut’s recommendations?
A: We incorporate local weather data, including precipitation forecasts, into our irrigation recommendations to ensure you’re not over-irrigating when rain is expected. - Q: Is training required to use Farmonaut’s platform?
A: Our platform is designed to be user-friendly, but we do offer onboarding sessions and ongoing support to help you get the most out of our tools. - Q: Can Farmonaut’s system detect irrigation system malfunctions?
A: While we can’t directly detect equipment failures, our system can identify anomalies in field water distribution that might indicate irrigation system issues. - Q: Does Farmonaut work for all crop types?
A: Our system is effective for a wide range of crop types. We continually refine our algorithms to account for the unique characteristics of different crops. - Q: How does Farmonaut contribute to water conservation efforts?
A: By helping farmers optimize their irrigation practices, we contribute to significant water savings. Many of our users report reducing their water usage by 20-30% while maintaining or improving crop yields.
Have more questions? Don’t hesitate to reach out to our support team. We’re here to help you make the most of your Farmonaut experience and optimize your farm’s irrigation management.


