

Reviewed August 2026 against USDA’s National Agricultural Statistics Service (NASS), the Association of Equipment Manufacturers (AEM), and the Market Research Future haying-and-forage-machinery report series.
Try it: Enter your numbers above. →
Haying & Forage Machinery Market: Size, Trends & Data
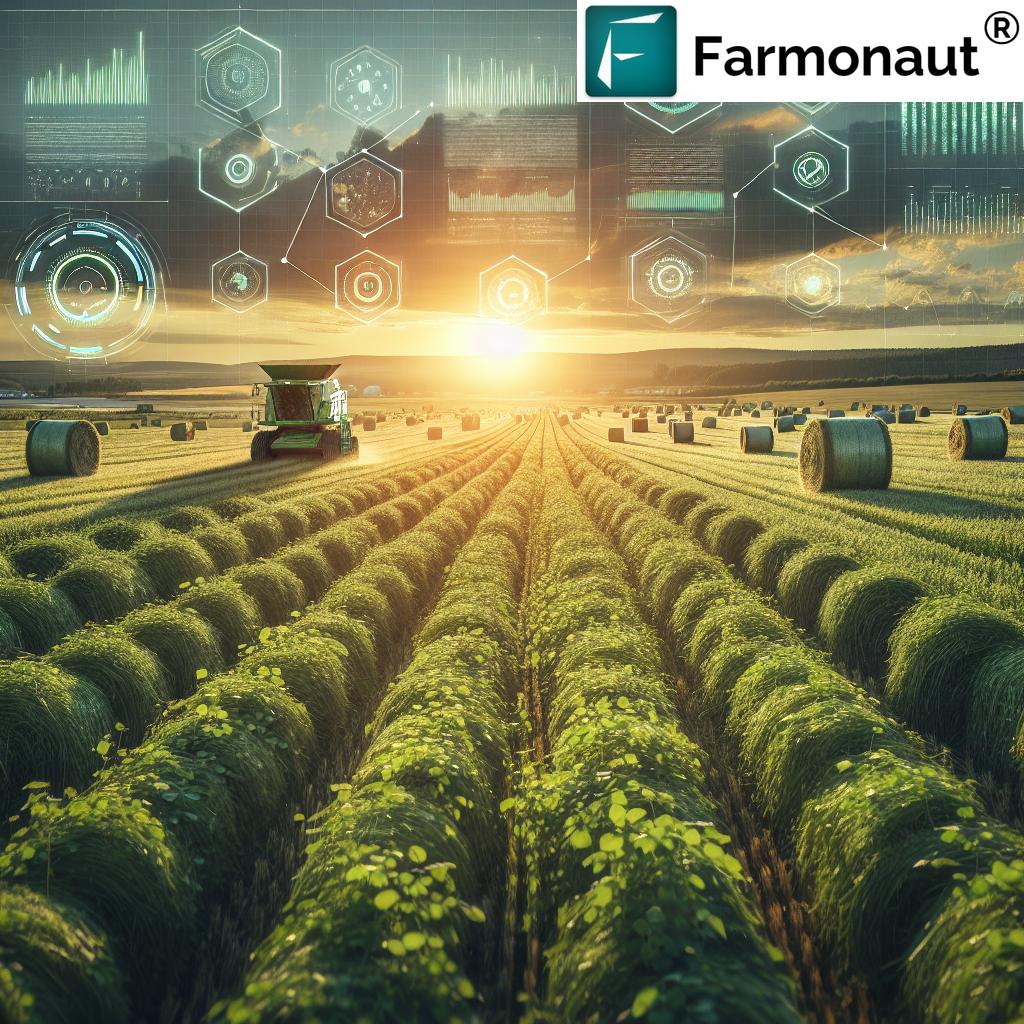
Depending on which research firm you ask and which equipment it counts, the global haying and forage machinery market sits between $20.4 billion and $22.0 billion for 2025, with most forecasts putting it above $25 billion by 2035. North America accounts for close to 40% of that total. Meanwhile the demand signals underneath those forecasts are choppy: US combine and tractor retail sales fell double digits year-over-year in March 2026 before combine sales turned positive again in June, and USDA’s May 2026 hay stocks count came in 3% below the prior year. This page walks through where each number comes from, what it actually measures, and how to check it again next quarter.
How big is the haying and forage machinery market? (2025 vs. 2035)
“Haying and forage machinery market,” “hay making machinery market,” “hay forage machinery market,” and “agricultural haying and forage machinery market” are not four different markets — they are the same equipment category (mowers, conditioners, rakes, tedders, balers, and forage harvesters) sized by the same publisher under slightly different report titles. Market Research Future runs three separate reports that all cover this equipment; the definitions overlap enough that the size gap between them is a real measurement uncertainty, not a typo:
| Report (publisher: Market Research Future) | 2024 base year | 2025 | 2035 forecast | CAGR 2025–2035 | North America share |
|---|---|---|---|---|---|
| Haying and Forage Machinery Market | $20.02B | $20.43B | $25.0B | 2.04% | ~40% ($8.0B in 2024 → $10.0B in 2035) |
| Agricultural Haying and Forage Machinery Market | $21.22B | $22.0B | $31.52B | 3.66% | ~40% ($7.5B in 2023 → $10.5B in 2032) |
| Forage Harvester Market (harvesters only) | $3.735B | $3.828B | $4.891B | 2.48% | ~40% of global share in 2024 |
All three reports were last updated in April 2026 (report IDs MRFR/Agri/40293-HCR, MRFR/Agri/32257-HCR and MRFR/Agri/27868-HCR). Because they’re refreshed on a rolling basis, the CAGR and dollar figures above will move the next time each report is revised — pull the live number from the publisher’s page rather than repeating a fixed figure indefinitely.
None of the three reports above publish a standalone United States figure — the “united states haying and forage machinery market” is reported bundled into North America alongside Canada and Mexico, at roughly 40% of the global total. If you specifically need a US-isolated dollar figure, the closest verifiable proxy available without a paid report license is the equipment sales data below, which AEM reports for the US market on its own.
US equipment demand and the “harvester production forecast” question
AEM, the trade association for farm and construction equipment manufacturers, publishes a monthly US Ag Tractor and Combine Report built from member-company retail sales data. It is a sales report, not a production forecast — no US government agency or manufacturer publishes a public unit-by-unit harvester production forecast; the closest official proxies are AEM’s monthly retail numbers as a leading indicator, plus the quarterly outlook commentary that Deere & Company, AGCO, and CNH Industrial give in their own SEC filings and earnings calls.
What AEM’s own data shows for 2026 so far: US combine sales fell 25.3% year-over-year in March 2026, while US agricultural tractor sales fell 9.1%. By June 2026, combines had swung to +3.9% year-over-year (269 units that month), even as tractor sales worsened to -18.4% year-over-year (18,186 units). Year-to-date through June 2026, combine sales stood at 1,335 units (down 11.4% versus the same period in 2025) and farm tractor sales at 89,063 units (down 13.6%).
AEM issues a new report roughly monthly, so if you’re reading this several quarters on, check AEM’s ag tractor and combine sales releases for the current month’s number rather than reusing the figures above.
US hay supply: what USDA’s stocks number tells you
USDA-NASS reported hay stocks on US farms at 23.3 million tons as of May 1, 2026 — down 3% from May 1, 2025 — with disappearance from December 1, 2025 through May 1, 2026 totaling 58.4 million tons, up 2% from the same window a year earlier. The report was released May 12, 2026 as part of NASS’s Crop Production series. Tighter carryover stocks matter directly to the equipment market covered above: when less hay is on hand, growers have less slack to under-utilize a mower, baler, or forage harvester during a good cutting window, which is part of what shows up in AEM’s sales swings.
NASS publishes an updated hay stocks figure every May and December. For the current number, go to the USDA NASS Crop Production report series rather than treating 23.3 million tons as a permanent figure — it is a snapshot of one reporting date, refiled twice a year.
Precision agriculture tools for tracking the season
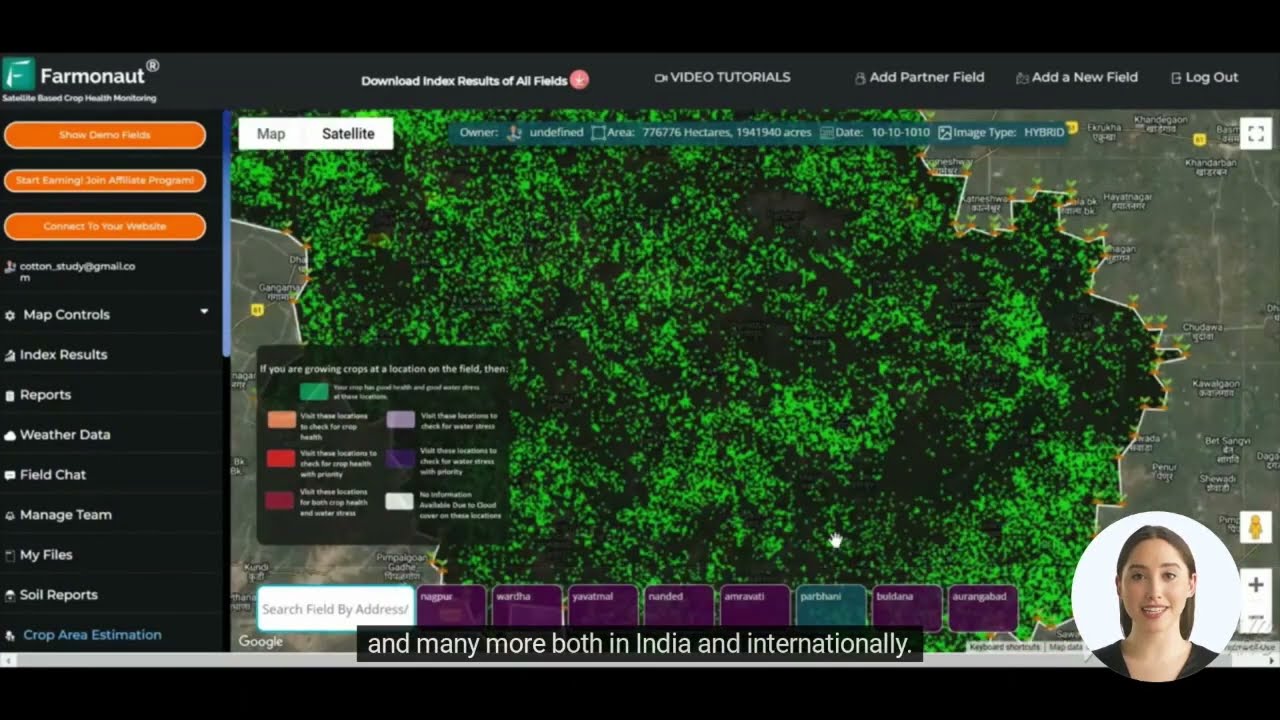
Farmonaut’s satellite-based monitoring tools sit alongside the market data above rather than replacing it — they help you act on your own field’s conditions, not on a national average. Four are directly relevant to haying and forage decisions:
- Vegetation health monitoring: NDVI-based imagery flags stress or uneven growth in a hay or forage stand before it’s visible from the cab.
- Soil moisture tracking: supports irrigation and cutting-timing decisions without a physical probe in every field.
- Weather forecasting: lets you plan mowing, raking, and baling around a curing window instead of a forecast checked once a week.
- Field variability mapping: identifies which zones of a field are pulling down average forage quality so you can manage them separately.


Forage quality: RFQ, RFV, and the vomitoxin ceiling that can zero out a load
Relative Forage Quality (RFQ) is calculated as (dry matter intake, as % of body weight) × (total digestible nutrients, as % of dry matter) ÷ 1.23, with 100 set as the reference point for mature alfalfa. Relative Feed Value (RFV) is the older metric, calculated from digestible dry matter and dry matter intake divided by 1.29; the Texas & Southwestern Cattle Raisers Association notes that RFV is nutritionally accurate only for alfalfa hay fed free-choice to dairy cows, even though it’s used to market every forage type — which is the specific gap RFQ was designed to close, since RFQ also accounts for digestible fiber and works for grass forages, not just legumes.
Neither number means anything from an untested bale. The National Forage Testing Association certifies the labs that run these tests: over 150 laboratories participate in its certification process each year, checked against reference methods for accuracy on dry matter, crude protein, and fiber values. If you’re buying or selling on RFQ or RFV, confirm the lab on the other end of the transaction holds current NFTA certification rather than taking a number on faith.
Explore Farmonaut’s API for advanced agricultural data analytics
Vomitoxin (deoxynivalenol, or DON) is the other number that can override quality metrics entirely: a load can score well on RFQ and still be rejected on DON. FDA advisory levels for DON in grain and grain by-products, on an 88%-dry-matter basis, are 5 ppm for swine and for all other animals, and 10 ppm for beef/feedlot cattle over four months old, dairy cattle over four months old, and poultry — with a higher 30 ppm allowance specifically for corn co-products such as distillers grains, capped at a smaller share of the total ration. FDA issued this guidance in June 2010; the figures below are as summarized by Ohio State University Extension’s Beef Team in November 2020, so verify against FDA’s current guidance document before making a feed-safety decision on it.

Equipment inside the market: mowers, balers, and forage harvesters
The Market Research Future base-year figures also break the $20.02 billion 2024 haying-and-forage-machinery total down by end use: haymaking equipment (mowers, conditioners, rakes, tedders) at $7.0 billion, forage harvesting equipment at $8.0 billion, and silage-production equipment at $5.02 billion. Balers specifically account for $7.0 billion of that total. This is effectively the answer to searches for a “hay forage baling equipment market” figure and a “hay forage harvesting equipment market” figure — they’re the baler and forage-harvester slices of the same report, not separate studies. The publisher’s public summary doesn’t itemize a mower-only or “hay forage mowing equipment market” figure separately from the wider haymaking bucket; that level of detail sits behind the paid version of the report.
On the silage side, the equipment decisions that determine quality are well established: harvest corn silage at 30–35% whole-plant dry matter, run a theoretical length of cut around 3/8 to 1/2 inch, fill and pack quickly to limit oxygen exposure, and seal with an airtight cover. Bacterial inoculants are a common add-on to improve fermentation stability, and all of it depends on the forage harvester and packing equipment actually being sized to the acreage and the weather window — which is what the calculator below is for.
Hay harvest window calculator
Enter your acreage, expected yield, and baler throughput to see whether your equipment can clear the field before your curing/weather window closes.
Enter your numbers above.
Assumes one baler running at a constant rate for the full acreage; it excludes mowing, raking/tedding time, breakdowns, and any redrying needed after rain. Treat the result as a capacity check, not a full field schedule.
Storage, pests, and weather risk after the bale is made
A checklist that holds up regardless of what a given season’s prices or stocks numbers do:
- Covered storage: a roof or tarp keeps rain and direct sun off the stack.
- Elevated storage: pallets or a gravel base stop bales from wicking moisture out of the ground.
- Airflow in stacking: leave gaps that let air move through the stack to limit mold growth.
- First in, first out: feed older hay first so nothing sits long enough to degrade past its test result.
- Routine inspection: check regularly for heating, mold, or pest infestation in stored bales.
Access our API Developer Docs for integrating Farmonaut’s data into your farm management systems
Frost adds a live risk on top of storage: it changes plant cell structure and nutrient composition fast, and species like sorghum and sudangrass can accumulate prussic acid after a frost event, which is a direct grazing hazard rather than a quality issue. Late-fall frosts also affect winter survival of perennial forages, which shows up as a yield hit the following spring. None of that is visible from the truck window — satellite-based field monitoring is the practical way to track which paddocks were hit and by how much.

Pasture management and the “forage analysis market”
There isn’t a separate commercial market-size report for “forage analysis” as its own category the way there is for machinery — testing is infrastructure, not a manufactured product, so it doesn’t get its own billion-dollar figure from the research firms above. What exists instead is a certified lab network: the National Forage Testing Association’s roster of 150-plus annually-participating labs, each checked for accuracy on dry matter, protein, and fiber values against reference methods. If a query is looking for the size of the forage-testing industry, the honest answer is that the useful number is the certified-lab count and your own sampling frequency, not a market-cap figure — pull a representative sample from every hay or silage lot you cut, since sampling error, not lab error, is the largest source of a bad test result.
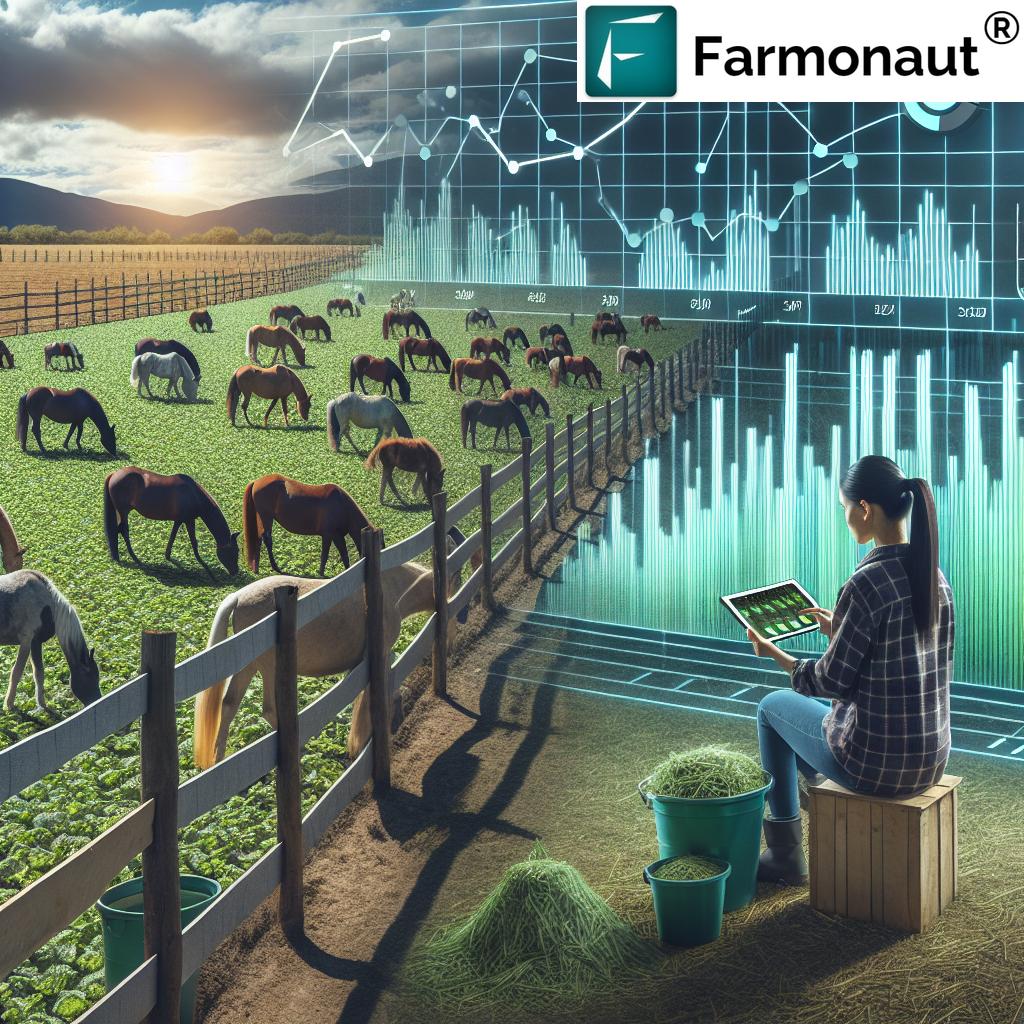
Pasture management ties directly into what gets tested. Grazing practices worth building around:
- Rotational grazing: moves animals before a paddock is overgrazed and gives regrowth time to recover.
- Grass species selection: matched to your climate and to the nutritional needs of the livestock actually grazing it.
- Soil fertility management: regular soil testing and fertilizer application to sustain grass growth and nutrient content.
- Integrated weed management: keeps undesirable species from displacing the forage you’re actually testing and selling.
- Grazing-intensity monitoring: satellite vegetation data flags which paddocks need a rest before overgrazing shows up in a soil test.
Tracking the market over time
Because every figure in this article carries a publication date, the way to keep using this page next year is the same method, not a fresh set of numbers: re-check the AEM monthly release, the next NASS Crop Production report, and whichever Market Research Future report definition matches your search term. Farmonaut’s own analytics layer — yield prediction, quality forecasting ahead of harvest, resource-allocation guidance for irrigation and fertilizer, and custom reporting — is built to run that kind of recheck against your own fields rather than a national statistic.


Frequently Asked Questions
Q: What is the haying and forage machinery market actually worth?
A: Market Research Future put the global haying and forage machinery market at $20.43 billion for 2025, forecast to reach $25.0 billion by 2035 (2.04% CAGR). A related report using a slightly broader definition — “agricultural haying and forage machinery” — puts 2025 at $22.0 billion, reaching $31.52 billion by 2035. Both were last updated in April 2026.
Q: Is the “hay making machinery market” a different market from “haying and forage machinery”?
A: No — these are alternate phrasings for the same equipment category (mowers, conditioners, rakes, tedders, balers, forage harvesters). Different search terms and different report titles point at the same underlying machinery.
Q: Does a United States-only market size exist?
A: Not from these three reports — they report North America as a single bloc at roughly 40% of the global figure. AEM’s monthly US retail sales data is the closest US-specific number that’s publicly available without a paid report.
Q: Where do I find a real harvester production forecast?
A: No public dataset forecasts US harvester production directly. Use AEM’s monthly combine retail-sales report as a leading indicator, and check the quarterly outlook statements Deere & Company, AGCO, and CNH Industrial give alongside their SEC filings for manufacturer-level guidance.
Q: What counts as the hay forage baling equipment market or the hay forage harvesting equipment market?
A: These map to the baler segment ($7.0 billion, 2024) and the forage-harvesting segment ($8.0 billion, 2024) inside the wider haying-and-forage-machinery total — they are sub-segments of the same report, not independent studies.
Q: How can Farmonaut’s agricultural data analytics help with any of this?
A: The analytics layer applies yield prediction, quality forecasting, resource optimization, and custom reporting to your specific fields — useful for deciding when to cut and how a stand is trending, which is a different job from tracking the national market figures on this page.

 Global Launch Base
 Elders
 Agritein
 Delicio
 WB Dev
 Sama Premium
 Prochecker
 Tres Valles
 LACOS Geoinformation
 Magrifly
 LatConnect 60
 WebsEdge
 Blickwinkel
 Agricultural Credit Policy Council
 Marei Nursery
 eKGIS
eKGIS Mostas Tech
 Andex
Andex FCF India
