

Farm technology · Comparison guide
Difference Between Smart Farming and Precision Agriculture
Scope is the main difference. Precision agriculture manages variation within a field or herd, while smart farming connects that data with sensors, software and automation across the farm. USDA counted 22% of US farms using precision practices in 2025.
Key takeaways
- Precision agriculture uses data to manage variation within a field, herd or orchard. Smart farming links that data with connected tools across more of the farm.
- Precision covers animals as well as plants in the definition from the International Society of Precision Agriculture (revised 2024), so crops versus livestock is not the real dividing line.
- USDA’s Technology Use report shows 22% of US farms used precision practices in 2025, compared with 27% in 2023.
- On US corn in 2016, guidance covered about 58% of planted acres, variable rate 37.4% and aerial imagery 7% (USDA ERS).
- Start with the narrowest tool that answers a question you already have, and check the payback on your own acres.
In this article
- The difference between smart farming and precision agriculture at a glance
- What is precision agriculture?
- What is smart farming?
- Smart farming vs precision farming: five real differences
- How widely each is used
- What the two approaches cost and return
- Which one should your farm start with?
- Benefits and challenges of both
- How both compare with traditional farming
- FAQ
- Where to go next
The difference between smart farming and precision agriculture is scope. Precision agriculture uses data to manage variation within a field, herd or orchard, while smart farming connects that data with sensors, software and automation across the wider farm. USDA’s August 2025 technology survey found 22% of US farms used precision practices in 2025. Below you will find a side-by-side table, adoption charts, farmer-reported equipment costs from 2018 and 2019 and a calculator to test whether an upgrade would pay on your acres.
Many articles treat the two terms as rivals. They are better seen as layers. A farm can run precision tools with no smart farming at all, but many smart systems use precision data as an input.
The difference between smart farming and precision agriculture at a glance
This table sets out the main contrasts. Treat the lines as a working guide, because authors draw the boundary in slightly different places.
| Point | Precision agriculture | Smart farming |
|---|---|---|
| Main question | How much does this spot need? | What should the whole farm do next? |
| Scope | Zones, rows, plants or single animals | Fields, livestock, machinery, storage and sales |
| Typical tools | GPS guidance, yield maps, soil maps, variable rate | Connected sensors, cloud software, AI, robots |
| Who decides | Usually the farmer or agronomist, using maps | The farmer, with more alerts and automated tasks |
| Timing | Often planned from past seasons and samples | More often triggered by live data |
| Connectivity | Some tasks run with little internet | Depends on a steady data link |
| Definition | Formal wording from a scientific society | Varies by author and country |
| Good first step | Yield map, soil map or guidance | One connected task, such as a pump or herd alert |
A simple test helps. If the question is “how much nitrogen does this part of the field need?”, you are doing precision agriculture. If the system also reads the forecast, schedules the spreader and logs the job for the buyer, you have moved into smart farming.
What is precision agriculture?
Precision agriculture has a formal definition from a scientific society. The International Society of Precision Agriculture definition, revised in January 2024, calls it a management strategy that gathers and analyses temporal, spatial and individual plant and animal data, then combines it with other information to support decisions based on estimated variability. The aims it lists are better resource use, productivity, quality, profitability and sustainability.
Note the words “plant and animal”. An older claim says precision farming covers crops only, and smart farming adds livestock. The society’s wording does not support that split. Precision dairy and precision livestock are recognised fields too, so scope is about how much is connected, not which species you keep.
The three steps of precision work
- Collect data. GPS mapping, GIS, satellite and drone images and field sensors record soil, moisture, terrain and plant health.
- Find the variation. Analysis shows where fertility, moisture, pest risk or yield potential differ within one field.
- Act by zone. Variable-rate fertilizer application and similar tools change the rate instead of treating every acre alike.
Key precision tools
- Guidance and auto-steer: these track machine position to reduce skips and overlaps.
- Yield monitors and yield maps: these show how output changes across a field, year after year.
- Soil maps: these record sampled nutrient and soil differences. They are often updated only every few years.
- Variable rate technology (VRT): this applies seed, fertilizer, lime or pesticide at mapped rates.
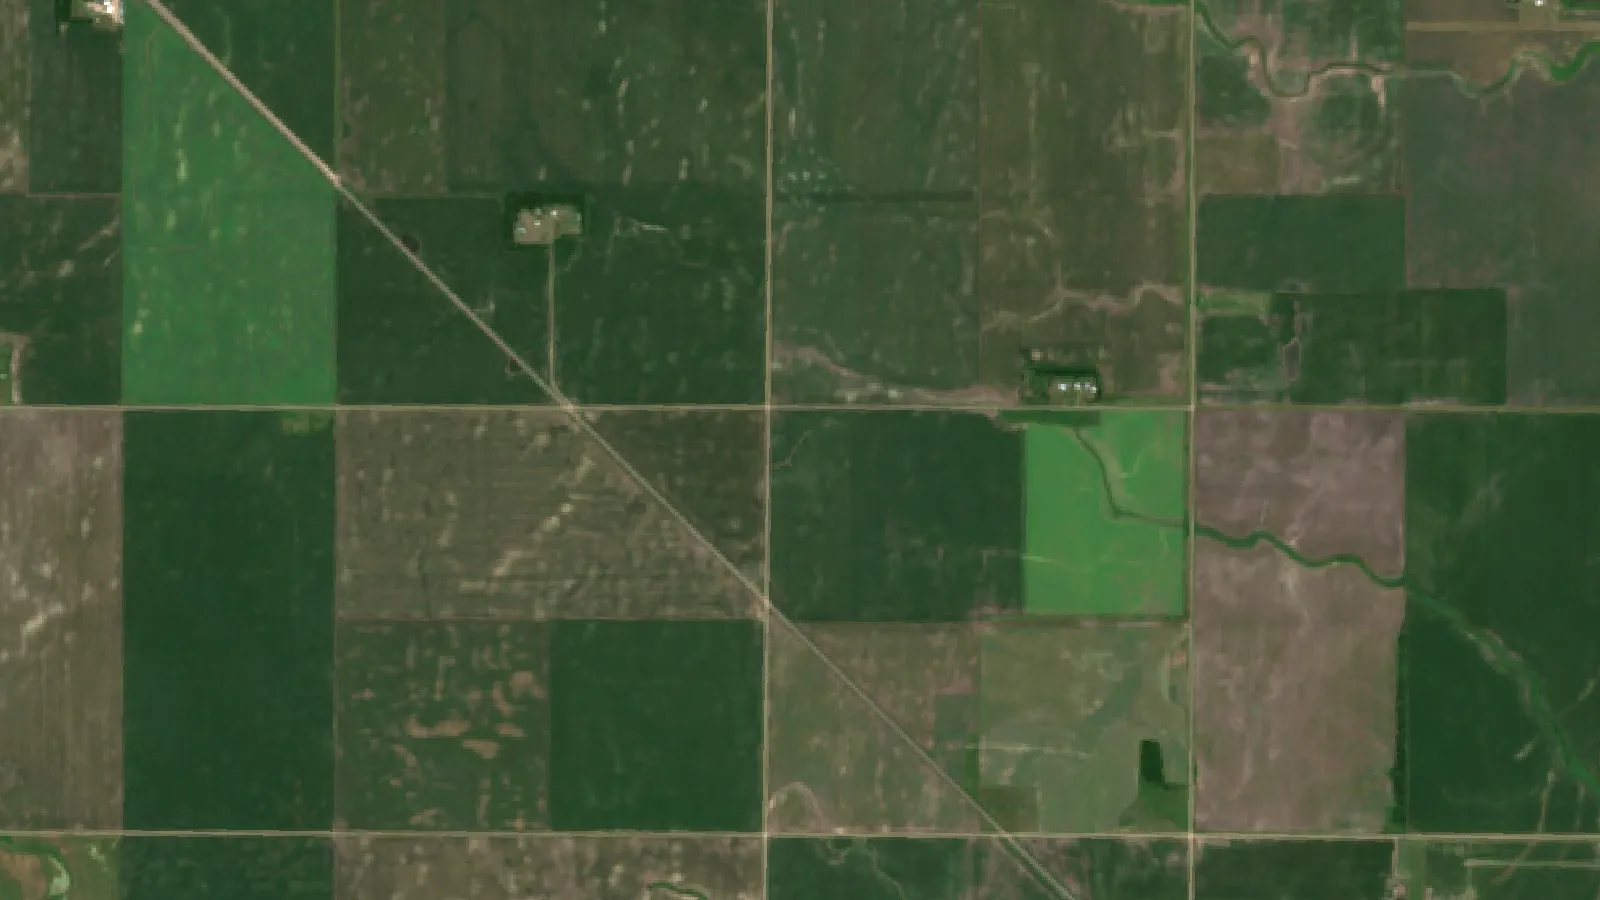
- Aerial imagery: satellites, aircraft and drones show vegetation patterns that are hard to see from the ground.
Satellite images show where vegetation changes. They do not name the cause, so a field visit still has to confirm whether the patch is a pest, a drainage issue or a nutrient gap.
▶ Six plain steps to start precision agriculture without buying a robot. · 4:18
What is smart farming?
Smart farming is the wider and looser term. A much-cited review, Big Data in Smart Farming (Wolfert and colleagues, Wageningen University, 2017), describes it as the use of information and communication technology in the cyber-physical farm management cycle. It expects the Internet of Things and cloud computing to bring more robots and artificial intelligence into farming.
A 2025 review in plant science puts the link in one line: smart agriculture is an extension of precision agriculture. Governments use the term as well. Japan has run a demonstration project since 2019 and enforced its Act on the Promotion of Smart Agricultural Technology Utilization in 2024. The European Commission tends to say “digitalisation” and includes training, infrastructure and governance as well as farm tools, in its digitalisation of agriculture overview.
What a smart farm connects
- Sensors and the Internet of Things: networked devices report on soil, weather, tanks, machines or animals.
- Cloud software: data from many sources lands in one record that you can read on a phone or computer.
- AI and analytics: models flag risks and suggest actions. They need checking against what you see in the field.
- Automation and robots: automation in agriculture ranges from a timed pump to a self-driving tractor.
- Links beyond the field: fleet records, storage, traceability and sales can share the same data.
Two examples of the extra layer
Virtual fencing shows the idea on a ranch. New Mexico State University explains that virtual fencing e-collars use GPS, radio links and audio and electric cues to hold cattle inside a boundary drawn on a screen. The same guide warns about upfront network costs, cell coverage and the need to train cattle to the collar.
Self-driving tractors show the limits. A 2026 discussion from Purdue’s Center for Commercial Agriculture reports that, at today’s performance and costs, most commercial corn and soybean farms it discusses are not yet in the economic range for large autonomous machines. Labor-short farms and expansion cases are where it may work first.

▶ How satellites, AI and drones fit together in connected farming. · 13:27
Smart farming vs precision farming: five real differences
1. Scope
Precision work asks about variation in one production unit. Smart farming asks how field, machine, animal and market information fit together. The second may include the first.
2. Integration
A precision setup can stand alone. A grower might use only GPS guidance, or only a soil map and a variable-rate spreader. Smart systems earn their name when tools share data, so a change in one place triggers a task in another.
3. Decisions
In precision farming, a person usually reads the map and writes the plan. Smart systems send more alerts and can carry out set tasks by themselves. The farmer still sets the rules and carries the risk. “Autonomous” rarely means unattended, and the Purdue model above assumes a person steps in for about six minutes of each machine hour.
4. Timing
Precision plans often draw on past yields and samples taken every few years. Smart systems lean more on current readings. Live data helps most where a quick response is possible, such as irrigation or a sick animal. It helps less where the decision was made months ago, such as a seed choice.
5. What can go wrong
Precision problems are usually about data quality, such as a poorly calibrated yield monitor. Smart farming adds failure points: lost signal, dead batteries, software that will not talk to a machine, and questions about who controls the data.
How widely each is used
Precision tools are measured well in the US. USDA’s Precision Agriculture in the Digital Era report (EIB-248, 2023) tracks them crop by crop. Auto-steer and guidance grew from 5.3% of planted corn acres in 2001 to 58% in 2016. Other tools lag behind on the same crop: variable rate was at 37.4% and aerial imagery at 7%.
Chart
Precision tools on US corn acres, 2016
Percent of planted corn acres managed with each tool
Those are shares of acres, not of farms, and that gap matters. USDA found about 12% of US farms used GPS for on-farm production in 2019, yet those farms held about 40% of farm and ranch acres. Precision adoption rises with size. In the corn survey, the USDA guidance adoption summary shows 73% of the largest farms (1,725 acres or more) used guidance, against 10% of the smallest (200 acres or fewer).
A more recent count covers all farms. USDA’s Technology Use report of August 2025 asked farms if they use precision practices to manage crops or livestock. The US share was 27% in 2023 and 22% in 2025. State results moved in different directions, so read a single survey change with care.
USDA’s survey asks about precision practices, not smart farming as such. Nearby figures, such as phone and internet access, show how ready farms are for connected tools.
Chart
Farms using precision practices, selected states
Percent of farms managing crops or livestock with precision practices, 2023 and 2025
What the two approaches cost and return
Cost is where the choice becomes practical. USDA’s EIB-248 report gives survey figures for what these tools cost farmers. These are farmer-reported totals from 2018 and 2019, not current list prices, so get a dealer quote before you budget.
| Technology | Cost type | Soybeans (2018) | Cotton (2019) |
|---|---|---|---|
| Yield monitor | Replacement | US$8,051 | US$13,775 |
| Yield monitor | Annual fee | US$1,041 | US$1,772 |
| Variable rate | Premium paid | US$5,630 | US$10,319 |
| Guidance | Replacement | US$20,165 | US$25,168 |
| Guidance | Annual fee | US$1,154 | Not surveyed |
| Drones | Replacement | US$2,610 | Sample too small |
Measured returns look modest in large-sample US work. USDA’s EIB-248 cites an analysis of 2010 corn farm data: GPS mapping was linked to almost 3% higher operating profit and variable rate to 1.1%. Those are old figures for one crop, and USDA did not re-estimate them in 2023. The earlier USDA report on farm profits and adoption (ERR-217, 2016) also linked these tools to hired labor costs 60 to 70% lower on small corn farms of 140 to 400 acres, though USDA notes such farms hire little labor anyway. Hired labor costs were higher on large farms using mapping and guidance, which may hire specialists to run them.
So the sensible way to judge either approach is on your own numbers. The savings on one farm rarely transfer directly to another. Soil variation, field shape, crop value and labor cost all shift the result.
Try the numbers for your own farm below.
Calculator
Would a farm technology upgrade pay on your acres?
Enter your own acres, costs and expected savings. The result is filled in with example numbers.
- Benefit per acre from inputs and yield, US$: $6
- Yearly value of labor saved, US$: $500
- Acres needed to break even: 982 acres
Example values only, close to break-even, not benchmarks or forecasts. Every number is your input. Include depreciation, subscriptions and support in the yearly cost. The savings and yield gain are your own estimates; test them on part of a farm first. This is not financial advice.
Which one should your farm start with?
For many operations this is a question of order. Start with the narrowest tool that answers a question you already have, then connect more only when the next step has a clear job.
Choose precision tools first if
- You grow row crops and your fields clearly vary in soil or yield.
- Fertilizer, seed or chemical spend is your biggest controllable cost.
- You already own a combine or spreader that can record or vary rates.
- Your internet is patchy, because some mapping tasks can wait for a connection.
Add smart farming layers if
- You lose hours checking remote pumps, tanks, fences or stock.
- Skilled labor is hard to find at key times.
- You run several enterprises or sites and the records live in separate places.
- A buyer or lender asks for field records you now pull together by hand.
Options for small and mid-size farms
USDA’s guidance summary says systems can be portable, can use tablets and phones as displays, and vary in sophistication, so small farms can get similar kinds of benefit, though not always at the same size. Soil testing, satellite vegetation maps and a basic guidance kit need less capital than a new machine. Farmonaut is one satellite option: it needs no field hardware and shows vegetation maps for the fields you draw.

▶ A tutorial on monitoring crops by satellite in the Farmonaut web app. · 8:43
Benefits and challenges of both
What farmers can gain
- Less overlap: USDA notes that guidance can cut skips and repeat passes, which lowers fuel, seed, nutrient and pesticide use.
- Less fatigue: auto-steer lets the operator attend to other tasks in the cab.
- Better records: maps and logs make next year’s plan and any audit easier.
- Earlier warning: images and sensors can point you to a problem area sooner, though you still need to find the cause.
- Less environmental pressure: precise application and less soil compaction can reduce the footprint, as USDA describes it, though results differ by farm.
What holds farms back
- Upfront cost: it is hard to justify if you cannot spread it over enough acres, as USDA’s guidance summary explains.
- Skills: someone has to calibrate equipment and read the maps. Paying a consultant adds another bill.
- Connectivity: USDA calls internet access a key requirement and a major barrier to adoption.
- Compatibility: check that machines and software can exchange data before you buy, and ask who may use your data.
- Fast-aging kit: electronics may need replacing before the machine they sit on does.
USDA’s survey found 85% of US farms had internet access in 2025, 82% had a smartphone, 74% had a cellular data plan and 55% had a broadband connection. A phone in the pocket does not mean a signal in the far pasture, so test coverage on the ground first.
Chart
How connected US farms were in 2025
Percent of US farms with each kind of access or device
How both compare with traditional farming
Traditional management treats a field as one unit and relies on experience, scouting and a set rate. That is still a sound choice where a field is uniform, the crop value is low, or the acres cannot carry the cost. Precision methods replace the set rate with mapped rates. Smart methods add live data and automatic tasks.
Neither replaces farming knowledge. Maps show where to look, and experience explains what you find. Where the plan involves fertilizer or pesticide rates, follow the product label and local rules, and get advice from a qualified agronomist.
FAQ
What is the main difference between smart farming and precision agriculture?
Scope. Precision agriculture manages variation inside a field, herd or orchard. Smart farming links that information with connected sensors, software and automation across more of the farm.
Is smart farming the same as digital farming?
The terms overlap and are often swapped. Digital farming or digitalisation is the broader description of data and software in agriculture, and the European Commission also includes training and infrastructure. Smart farming usually stresses connected and automated tasks.
What are the disadvantages of precision farming?
The main ones are upfront cost, the skills needed to run and read the tools, scale, and data that may be hard to move between systems. USDA data show adoption is far lower on small farms than on large ones.
Which technologies suit small and mid-size farms?
Start with soil testing, satellite maps or a portable guidance kit. Each answers one question at modest cost compared with new machinery. Test the numbers in the calculator before committing.
Do these systems work with poor internet?
Some precision tasks can be done with occasional connections, since maps can be loaded before a job. Real-time alerts and automated tasks need a steady link, so check coverage where the equipment will actually sit.
Where to go next
If you only remember one thing, remember the order: measure the variation, act on it, then connect the tasks that take the most time. For a satellite view of your own fields, the Farmonaut Satellite + AI Farm Monitoring System is available on web and mobile.
Related pages on our site: farm monitoring app, large-scale farm management, farm carbon footprinting, crop loan and insurance checks, farm fleet management, product traceability, satellite data API and satellite and weather API docs.
Farmonaut crop monitoring
See your own fields from space
Draw your fields once and Farmonaut shows satellite vegetation maps for them through the season, on web, Android or iOS.




Keep reading

Sources
- USDA ERS, Precision Agriculture in the Digital Era: Recent Adoption on U.S. Farms, EIB-248 (2023): ers.usda.gov
- USDA ERS Amber Waves, Most Row Crop Acreage Managed Using Auto-steer and Guidance Systems (April 2023): ers.usda.gov
- USDA ERS, Farm Profits and Adoption of Precision Agriculture, ERR-217 (2016): ers.usda.gov
- USDA NASS, Technology Use (Farm Computer Usage and Ownership) (August 2025): esmis.nal.usda.gov
- International Society of Precision Agriculture, Precision Agriculture Definition (January 2024): ispag.org
- Wolfert et al., Big Data in Smart Farming: A review, Agricultural Systems (2017), Wageningen record: research.wur.nl
- Smart agriculture in Asia, Plant Communications (2025): pmc.ncbi.nlm.nih.gov
- Digital and Precision Technologies in Dairy Cattle Farming: A Bibliometric Analysis (PMC): pmc.ncbi.nlm.nih.gov
- New Mexico State University, Virtual Fencing Using E-Collars on New Mexico Cattle Ranches, Part 1: pubs.nmsu.edu
- Purdue Center for Commercial Agriculture, When Will Autonomous Farm Equipment Actually Pay? (February 2026): ag.purdue.edu
- Japan MAFF, Promotion of Smart Agriculture (October 2025): maff.go.jp
- European Commission, Digitalisation of agriculture and rural areas: agriculture.ec.europa.eu
Discussion
Questions, corrections or field experience? Share them below. First-time comments are reviewed before they appear, and your email is never published.
No comments yet. Be the first to add a question or your experience.

 Adgrid
 eKGIS
 Mostas Tech
 Native Seeds
 Andex
 FCF India
 Unifrutti Gulf
 Deluxe Conseil
 TVS Electronics
 BW Pipelines
 WICO
 Chimera Innovation
 SkyHarvest
 Polaris Digitech
 Teledarbas

 Licence holder · Niger · Gold
 Client · Tanzania · Gold
 Client · Somalia · Gold
 Client & affiliate partner · Ghana · Gold










