

Reviewed August 2026 against USDA Economic Research Service and FAO data.
Try it: Run your own numbers →
Precision Agriculture Irrigation, Food Storage Silos, and Liberia’s Agriculture Gap

Precision agriculture irrigation means matching water delivery to what a crop actually needs, using soil, weather, and sensor data instead of a fixed schedule — and in the United States it has moved from niche to mainstream on larger operations while remaining rare on small ones. Food storage silos matter because the loss happens after harvest, not before: FAO estimates 20-30% of cereals in Sub-Saharan Africa are lost after harvest, worth roughly $4 billion a year. Liberia sits at the extreme end of both problems — 2.3% irrigated cropland and cereal yields at 0.7 metric tonnes per hectare — which is why its numbers are useful even to a farmer in Iowa or Lincolnshire: they show what happens when precision tools and proper storage are simply absent.
Table of Contents
- Precision Irrigation Adoption in the US: Who’s Actually Using It
- Drip vs. Flood: The Water Efficiency Numbers
- Food Storage Silos and the Cost of Not Having Them
- Liberia Agriculture: The Numbers Behind the Headlines
- Traditional vs. Modern Practice: A Direct Comparison
- Drip Irrigation Water Savings Calculator
- Where Satellite Monitoring Fits
- FAQ
- Try it: Run your own numbers
Precision Irrigation Adoption in the US: Who’s Actually Using It
The USDA Economic Research Service’s 2023 analysis of precision agriculture adoption found 27% of US farms use some form of precision agriculture practice, but that figure hides a sharp split by farm size. Among large-scale crop farms, 70% use guidance autosteering on tractors and harvesters, and 68% use yield monitors, yield maps, or soil maps. Midsize farms trail well behind on the same technologies — 52% use autosteering — and the smallest operations adopt at a fraction of that rate (USDA Economic Research Service, 2023).
Irrigation-specific adoption isn’t broken out separately in that dataset — it’s folded into the broader “precision agriculture” category alongside guidance systems and yield mapping. If you need a current, filterable number for irrigation equipment or practices by state and commodity, USDA NASS’s Census of Agriculture is the source: it runs every five years, the 2022 census was published in 2024, and the next is due in 2027. Between census years, quickstats.nass.usda.gov lets you query irrigation-related practices in near real time.
The market case for precision irrigation is separately documented: the US precision irrigation market was valued at $2.15 billion in 2024 and is projected to reach $4.72 billion by 2033 (Market Data Forecast / Renub Research). That’s a forecast for the US market specifically over a nine-year window — treat it as directional, not a guarantee, and check the same source for a revised projection as newer editions are published.
Drip vs. Flood: The Water Efficiency Numbers
The core efficiency gap between irrigation methods is well documented and doesn’t shift much year to year, which makes it a reliable planning number rather than a moving target. Drip irrigation systems achieve roughly 95% water use efficiency, compared with 40% for flood irrigation — meaning flood irrigation loses more than half its applied water to runoff, deep percolation, and evaporation before the crop uses it (Yara agronomic research). Independent crop trials reviewed in Frontiers in Agronomy found a 30-60% improvement in crop water use efficiency when comparing drip against flood systems across multiple field studies.
Crop-specific trial data sharpens the picture further. In tomato production, drip fertigation delivered a 19% yield increase alongside a 36% reduction in water consumption, and fertigation specifically improved water use efficiency by 46% over conventional practice. In potatoes, switching from center-pivot to drip irrigation cut water consumption by 31% and lifted grower profit by 10.5% (studies cited via NCBI/PubMed Central). None of these figures are hedged with “varies by region” in the source studies — they’re trial results tied to specific crops and specific comparisons, and that specificity is exactly what makes them usable for a real budget.
What this means for a US or UK grower deciding whether to convert a field: the water savings are large enough on their own to justify piloting drip on a high-value block first — vegetables and row crops with documented gains, rather than converting an entire farm at once. The calculator further down this page runs those percentages against your own acreage.

Food Storage Silos and the Cost of Not Having Them
Grain silos exist to solve one problem: the gap between harvest and sale, or harvest and processing, during which stored cereal is vulnerable to moisture, pests, and mold. Where that storage infrastructure is inadequate, the losses are measurable. FAO’s post-harvest guidelines put cereal losses across Sub-Saharan Africa at 20-30% of the harvest, an annual value of roughly $4 billion, with 37% of food overall lost before it reaches consumers (FAO Post-Harvest Guidelines). FAO’s own framing of that number is worth repeating directly: the volume lost annually to preventable post-harvest waste in the region would be enough to feed an estimated 48 million people.
That figure is a regional average, not a per-farm guarantee — the loss rate on any individual farm depends on how long grain sits unprotected, local humidity, and pest pressure, so use the 20-30% range as a planning benchmark rather than an exact prediction for one harvest. For current market sizing on silo and grain-storage infrastructure spending, Grand View Research and comparable industry analysts republish global grain-storage market figures annually, and trade publications such as Food Engineering and World Grain issue updated capacity and cost data each January — check those directly rather than relying on a figure that ages the moment it’s printed here.
The storage gap connects directly to the modernization case built throughout this article: yield gains from better precision farming practices are wasted if a third of the crop spoils before it’s sold. Storage and production efficiency have to be solved together, not sequentially.
Liberia Agriculture: The Numbers Behind the Headlines
“Liberia’s agriculture relies heavily on rain-fed farming, with limited irrigation systems used across the country’s small farms.”
Liberia’s agricultural sector illustrates, at the far end of the spectrum, what happens without either precision irrigation or adequate storage. FAO reports Liberia’s cereal yield at 0.7 metric tonnes per hectare, against a Western Africa regional average of 1.3 metric tonnes per hectare — meaning Liberian cereal farms produce roughly half the yield of their regional neighbors on the same land area (FAO / World Bank, Liberia country data). The same FAO data records that 81% of Liberia’s population experienced moderate or severe food insecurity and 93% could not afford a healthy diet in the 2024-2025 period, while 50-60% of the country’s staple food supply is imported.
Liberia’s own agricultural households — approximately 338,630 of them, concentrated in Nimba, Bong, and Lofa counties — farm rice and cassava predominantly under rain-fed conditions, with only 2.3% of cropland under irrigation. That single number is the mechanical link between “liberia agriculture” and the low yields above: without irrigation, a poor rainy season directly caps the harvest, and there is no buffer. In 2024, Liberia’s total trade volume reached $2.64 billion, split between $1.03 billion in exports and $1.61 billion in imports — a deficit driven partly by rice, which accounts for 41% of total imports.
None of this is a story that resolves in a single year. It’s a continuing structural gap between rainfall dependency and food demand, and the two things that would visibly move it are irrigation expansion and storage investment — the same two levers this article opened with. Readers tracking Liberia agricultural journalism or food security coverage should treat FAO’s country page and FAOSTAT as the sources to check for updated figures, since both are refreshed annually and the Liberia-specific numbers here are already dated to the FAO’s 2024-2025 reporting window.
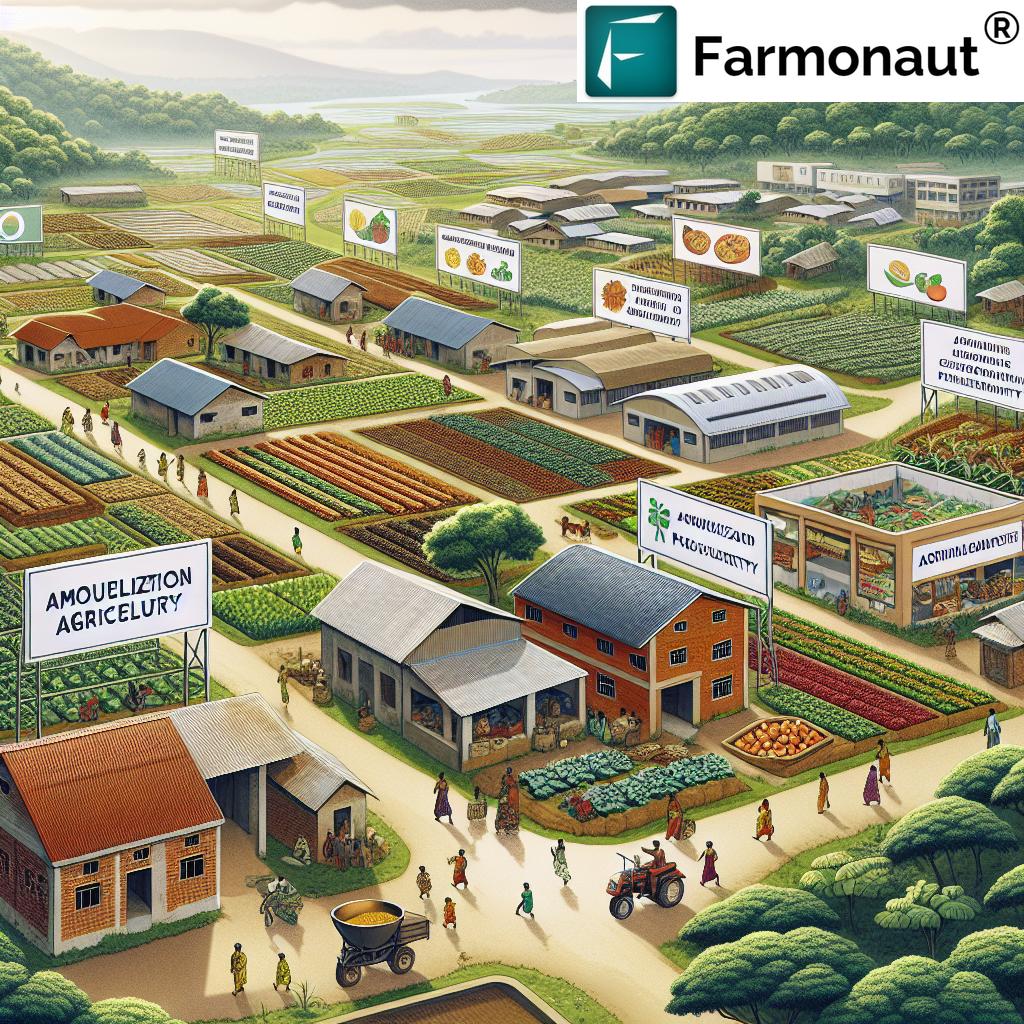
Traditional vs. Modern Practice: A Direct Comparison
| Aspect | Rain-Fed / Traditional | Precision / Modernized |
|---|---|---|
| Irrigation | None or rain-dependent (2.3% of Liberian cropland irrigated) | Drip systems at ~95% water use efficiency vs. 40% for flood |
| Cereal yield | 0.7 t/ha (Liberia, FAO) | 1.3 t/ha regional West Africa average; 3-5 t/ha achievable with improved inputs and irrigation |
| Guidance/autosteering use | Minimal on smallholdings | 70% of large US crop farms, 52% of midsize farms (USDA ERS, 2023) |
| Post-harvest loss | 20-30% of cereal harvest lost (Sub-Saharan Africa average, FAO) | Reduced substantially with sealed silo storage and moisture control |
| Data-driven decisions | None | Satellite crop monitoring, yield mapping, soil maps |
This comparison highlights the transformative potential of modern agricultural practices already documented across Africa. The gap between rows one and two in the table above is not theoretical — it’s the same 0.6 tonne-per-hectare difference separating Liberia’s yield from its own region’s average, and the same efficiency gap that separates flood irrigation from drip in the studies cited above.
Drip Irrigation Water Savings Calculator
Use your own field size and current irrigation method to estimate potential water savings from converting to drip, based on the 95%/40% efficiency figures cited above.
Run your own numbers
Assumptions: uses the 95% drip vs. 40% flood water-use-efficiency figures from Yara agronomic research. Excludes installation, equipment, and labor costs; excludes crop-specific yield or profit effects (see the tomato and potato trial figures above for those). Actual savings depend on your soil type, climate, and existing system condition.
Where Satellite Monitoring Fits
Satellite crop monitoring is the layer that makes precision irrigation decisions possible without a soil sensor network buried in every field. Tools like Farmonaut’s platform let farmers track vegetation health, soil moisture indicators, and weather patterns remotely, then time irrigation and inputs to what the field actually needs rather than a fixed calendar. That’s the same principle behind the USDA-documented 68% of large US farms using yield and soil maps — the difference is satellite monitoring extends the same data-driven approach to farms that can’t justify the capital cost of a full sensor grid.
- Real-Time Crop Monitoring: Track crop health and growth patterns using satellite imagery, enabling timely interventions.
- Resource Optimization: Data-driven insights help target water, fertilizer, and other inputs, reducing both cost and runoff.
- Weather Forecasting: Forecast data supports irrigation timing and field-operation planning.
- Yield Estimation: Algorithmic yield estimates support both on-farm decisions and broader planning, the same function agricultural data analytics serves at scale.
Explore Farmonaut’s API for advanced agricultural data integration

The barrier to adoption is rarely the technology itself — it’s upfront cost and the learning curve of interpreting the data. Farmonaut’s model of affordable satellite access is built to close that specific gap, for smallholders in West Africa and for midsize US or UK farms alike, since the ERS data above shows midsize operations already trail large ones on every precision metric.



A Checklist for Evaluating Precision Irrigation on Your Own Operation
Rather than a one-time snapshot, this is a method that stays useful regardless of how the market figures above change:
- Check current adoption data before buying: Query USDA NASS QuickStats (quickstats.nass.usda.gov) for irrigation and precision-practice adoption in your state and commodity — updated between census years, with the full Census of Agriculture refreshed every five years (next: 2027).
- Pilot on your highest-value block first: The crop-specific trial gains cited above (tomatoes, potatoes) were measured on single crops, not whole-farm conversions — start where the documented gain is largest.
- Measure your baseline water-use efficiency: Compare your current method against the 95% drip / 40% flood benchmark to estimate your ceiling for improvement, using the calculator above.
- Audit storage losses separately from field losses: A yield gain from irrigation is void if 20-30% of it spoils in storage — treat drying, aeration, and sealed storage as part of the same budget line as irrigation, not an afterthought.
- Re-check the market forecast, don’t assume it: The $2.15 billion to $4.72 billion US precision irrigation market projection covers 2024-2033 specifically — a projection that far out should be revisited against updated editions of the same market report rather than treated as fixed.

FAQ
- Q: What percentage of US farms use precision agriculture irrigation?
A: USDA’s Economic Research Service found 27% of all US farms use some precision agriculture practice as of 2023, with adoption concentrated on larger operations — 70% of large-scale crop farms use guidance autosteering. Irrigation-specific adoption isn’t broken out separately; query USDA NASS QuickStats for practice-level detail by state and commodity. - Q: How much more water-efficient is drip irrigation than flood irrigation?
A: Drip irrigation achieves roughly 95% water use efficiency versus 40% for flood irrigation, per Yara agronomic research, with independent field studies showing a 30-60% improvement in crop water use efficiency when switching methods. - Q: Why do food storage silos matter for food security?
A: Without adequate sealed storage, FAO estimates 20-30% of cereal harvests in Sub-Saharan Africa are lost after harvest — worth about $4 billion annually, or enough grain to feed an estimated 48 million people if prevented. - Q: What are the main challenges to food security in Liberia?
A: FAO data for 2024-2025 shows 81% of Liberia’s population facing moderate or severe food insecurity and 93% unable to afford a healthy diet, driven by cereal yields of just 0.7 tonnes per hectare (versus 1.3 for West Africa overall), only 2.3% irrigated cropland, and 50-60% of staples imported. - Q: How does Liberia’s agriculture compare to the rest of West Africa?
A: Liberia’s cereal yield of 0.7 metric tonnes per hectare is roughly half the West Africa regional average of 1.3 tonnes per hectare, according to FAO and World Bank data — a gap FAO links directly to rain-fed dependency and minimal irrigation infrastructure. - Q: Can satellite tools substitute for on-the-ground irrigation infrastructure?
A: No — satellite monitoring informs when and how much to irrigate, but the physical irrigation system (drip lines, pumps, storage) still has to exist. Tools like Farmonaut’s platform make the data-driven decision layer affordable; they don’t replace the infrastructure investment itself.

Explore Farmonaut’s Subscription Plans
For teams building or extending farm-data integrations, Farmonaut’s API Developer Documentation covers satellite and weather data endpoints, and career paths in this space are covered in agricultural careers.

 Sarvome
 Polaris Digitech
 Teledarbas
 Wild Oak Farm
 SFX
SFX BACF Africa
 Doodlakine
 Exurbia Geospatial
 FieldZero
 Indico Company
 Kubota
 FFBS
FFBS Jontra
