
Cotton diseases · Field guide
Angular Leaf Spot of Cotton: Cause, Symptoms, Control
Angular leaf spot of cotton is the leaf phase of bacterial blight, caused by the bacterium Xanthomonas citri pv. malvacearum. It spreads on seed and residue, has no economical spray cure, and cost US growers an estimated 57,800 bales in 2016 (Beltwide Cotton Conferences).
Key takeaways
- Cause: Xanthomonas citri pv. malvacearum (Xcm); race 18 is the main race in US cotton (Cotton Incorporated).
- Look for water-soaked spots under the leaf that turn angular, black and vein-bound; black arm on stems; sunken lesions on bolls.
- Risk peaks with heavy rain, days of 90-100°F, nights of 62-68°F and humidity above 85% (Alabama Extension, 2026).
- US losses swing by season: 4,900 bales in 2013, 57,800 in 2016 and 8,300 in 2020 (Cotton Disease Loss Estimate Committee).
- Prevention works best: race 18-resistant varieties, acid-delinted seed, one year or more of rotation and residue burial.
In this article
- What causes angular leaf spot of cotton
- Disease cycle and conditions that favour it
- Symptoms on leaves, stems and bolls
- Angular leaf spot of cotton diagram
- Cotton leaf diagram: the parts to know
- How much yield bacterial blight costs
- How to manage and prevent the disease
- Scouting and field monitoring
- Estimate the cost of an outbreak in your field
- FAQ
Angular leaf spot of cotton is caused by the bacterium Xanthomonas citri pv. malvacearum (often shortened to Xcm). It is the leaf phase of a disease better known as bacterial blight of cotton, which also causes black arm on stems and boll rot. It spreads mainly on infected seed and crop residue, and it has no economical spray cure, so resistant varieties and clean seed are the main defence.
This guide explains the cause, the disease cycle and the symptoms, shows a labelled leaf diagram in words, and charts how many US bales the disease has cost by season and by state. A calculator at the end lets you estimate what a field outbreak could cost you.
What causes angular leaf spot of cotton
The causal organism is a rod-shaped bacterium. Older papers call it Xanthomonas campestris pv. malvacearum or X. malvacearum; newer ones use X. citri subsp. malvacearum. All names refer to the same pathogen. For a wider look at this group of bacteria, see our guide to Xanthomonas campestris disease control.
Despite the “malvacearum” name, the pathogen has a narrow host range. The Alabama Cooperative Extension System notes that it matters economically only on cotton (Gossypium species). The disease was first reported in the United States in Alabama in 1891, where it was called “black rust”.
Cotton Incorporated and a group of university plant pathologists list 22 known races of Xcm. A race is defined by which resistance genes it can overcome. Race 18 is the main race in US cotton, so seed catalogues rate varieties against race 18.
Not the same as angular leaf spot of cucurbits
Cucumbers, melons and strawberries also get a disease with this name, but it is caused by different bacteria (Pseudomonas and, in strawberry, Xanthomonas fragariae). If you grow those crops, read our separate guide to angular leaf spot control in cucurbits and berries. The cotton pathogen does not move to them.

▶ Angular leaf spot in cucurbits and berries, a different disease with a similar name · 16:00
Disease cycle and conditions that favour it
The disease cycle has four links. Breaking any one of them lowers the risk.
Infographic
Bacterial blight cycle in 4 steps
- 1SurvivalBacteria live on seed and in dry crop debris.
- 2First infectionInfected seed or residue infects seedlings after rain.
- 3EntryBacteria enter leaves through stomata and wounds.
- 4SpreadWind-driven rain, irrigation and equipment carry them on.
- Survival. The bacterium lives in and on seed, and in dry cotton leaves and stalks left on the field. Alabama Extension reports survival for at least 22 months on cottonseed, at least 4 months on seed lint and at least 5 months in undecomposed leaves.
- First infection. Research cited by Cotton Incorporated found that one infected seed in 6,000 can start an epidemic when the weather suits the pathogen. Seedlings infected early lead to the worst fields.
- Entry. Bacteria enter through stomata, other natural openings and wounds, including damage from wind-blown sand.
- Spread. Wind-driven rain, furrow or sprinkler irrigation, insects, tools and tractors move bacteria from plant to plant and field to field.
Weather drives the speed. Spread is fastest after canopy closure when heavy rain is followed by daytime highs of 90 to 100°F, nights of at least 62 to 68°F and relative humidity above 85% (Cotton Incorporated bulletin; Alabama Extension, 2026). Dense canopies from heavy or late nitrogen keep leaves wet longer and raise the risk.
Symptoms on leaves, stems and bolls
Symptoms change with plant age and with the part of the plant that is infected. Check the underside of leaves first.
| Plant part | What you see | Common name |
|---|---|---|
| Cotyledons | Small water-soaked spots, dark green then brown; black cankers can girdle the stem and kill the seedling | Seedling blight |
| Leaf underside | Small water-soaked or “greasy” spots, clearest against the light | Early lesions |
| Leaf upper side | Angular spots bounded by veins, sometimes with a yellow halo; they turn black and leaves look tattered | Angular leaf spot |
| Main leaf veins | Black streaks that follow the veins | Lightning bolt |
| Petioles and stems | Dark, elongated lesions | Black arm |
| Bracts and bolls | Round, sunken, water-soaked lesions near the boll base and sutures that turn black | Boll rot |
Infected bolls can open early, give stained lint and carry the bacterium inside the seed, which is how the next season can start.
How to tell it from look-alike leaf spots
Target spot, Cercospora leaf spot and Stemphylium leaf spot all make round or ringed spots. Bacterial blight spots are more triangular or rectangular because the veins stop them. A University of Georgia extension report from 2016 found bacterial blight, target spot and Cercospora in the same field, so one field can carry several diseases at once. When in doubt, send a sample to your state diagnostic lab.

▶ Verticillium wilt, another cotton disease to tell apart from leaf spots · 14:46
Angular leaf spot of cotton diagram
Use this stage-by-stage diagram, written as a list, to compare a sick leaf with a healthy one. Hold the leaf against the light and look from below.
- Healthy leaf: even green blade, clear veins, no spots.
- Early stage: pin-head water-soaked spots on the underside, between the small veins.
- Developed stage: spots grow into angular patches, each boxed in by veins, often with a pale yellow ring on the top surface.
- Systemic stage: black streaks run along the midrib and main veins.
- Late stage: patches turn dark brown to black, dry out and tear, leaving a ragged leaf that drops early.
Cotton leaf diagram: the parts to know
Knowing the normal leaf makes the disease easier to spot, because the angular lesions follow its vein pattern.
- Leaf blade (lamina): the broad, usually three- to five-lobed surface.
- Midrib and main veins: the veins spread from the petiole like fingers on a hand; lightning-bolt streaks follow them.
- Small veins: the fine network that boxes in each angular spot.
- Petiole: the stalk that joins the leaf to the stem; black arm shows here.
- Leaf margin: the edge of each lobe; tattered edges are a late sign.
- Stomata: tiny pores, most on the underside, that let in air and also the bacterium.
How much yield bacterial blight costs
Before US seed was routinely acid-delinted (lint removed from seed with sulfuric acid), losses in badly hit fields reached 60%. Since then, national losses have been put at about 0.1% a year, though single fields have lost 20% in recent outbreaks (Cotton Incorporated bulletin). Alabama Extension adds that rare uncontrolled epidemics can approach 50 to 70% loss.
Chart
Bales lost to bacterial blight by state, 2016
Thousand bales, 2016 season, states above 1,000 bales
Chart
US bales lost to bacterial blight by season
Thousand 480-lb bales, US Cotton Belt, selected seasons
The Cotton Disease Loss Estimate Committee, which reports each year at the Beltwide Cotton Conferences, shows how uneven the losses are. Its estimate for the 2016 season was 57,800 bales lost to bacterial blight across the US Cotton Belt, against 4,900 bales in 2013 and 8,300 in 2020.
In 2016, bacterial blight was the largest disease loss in Oklahoma, found on most of its roughly 90,000 irrigated acres. Some growers with susceptible varieties estimated losses of up to a bale per acre compared with nearby resistant varieties (Beltwide proceedings, 2017).
The state pattern also moves. Georgia had little need to worry before 2015; in 2015 one susceptible variety was badly hit and later withdrawn there, and in 2016 it was confirmed again and judged very likely in many fields (UGA Extension, 2016).
How to manage and prevent the disease
Once the disease is in a field, no management tactic can completely halt it (Alabama Extension, 2026). Control is about prevention. These steps follow US extension advice; check the product label and local rules for any input you use, and ask your state extension specialist for local advice.
Chart
Share of crop lost to bacterial blight, 2015 vs 2016
Estimated % yield loss by state
- Plant a race 18-resistant variety. This is the most practical and economical step, and the first one for any field with a history of the disease. Ratings change every year, so use your state’s current variety trial table.
- Buy acid-delinted, certified seed. Delinting greatly reduces seed transmission, though it cannot rule it out.
- Rotate to a non-host crop. Alabama Extension suggests at least one year of peanut, corn or soybean to cut carryover.
- Bury or destroy residue. Tillage that works leaves and stalks into the soil speeds their breakdown; shred stalks soon after harvest in badly infested fields. Weigh this against your soil conservation practices.
- Manage nitrogen and growth. Avoid excess or late nitrogen and use plant growth regulators where local advice supports them, to keep the canopy open.
- Limit leaf wetness. Avoid overhead irrigation when a susceptible variety is infected, and stay out of wet fields.
- Clean equipment. Wash tools and machinery before moving from an infected field.
- Harvest infected fields early and keep gin and seed-processing equipment clean.
A note on sprays: the Cotton Incorporated bulletin states that economical chemical control options are not available. The old advice to rely on copper fungicides is not part of current US extension recommendations for this disease.
Many of these steps, such as rotation and residue management, also feature in regenerative agriculture systems.
Scouting and field monitoring
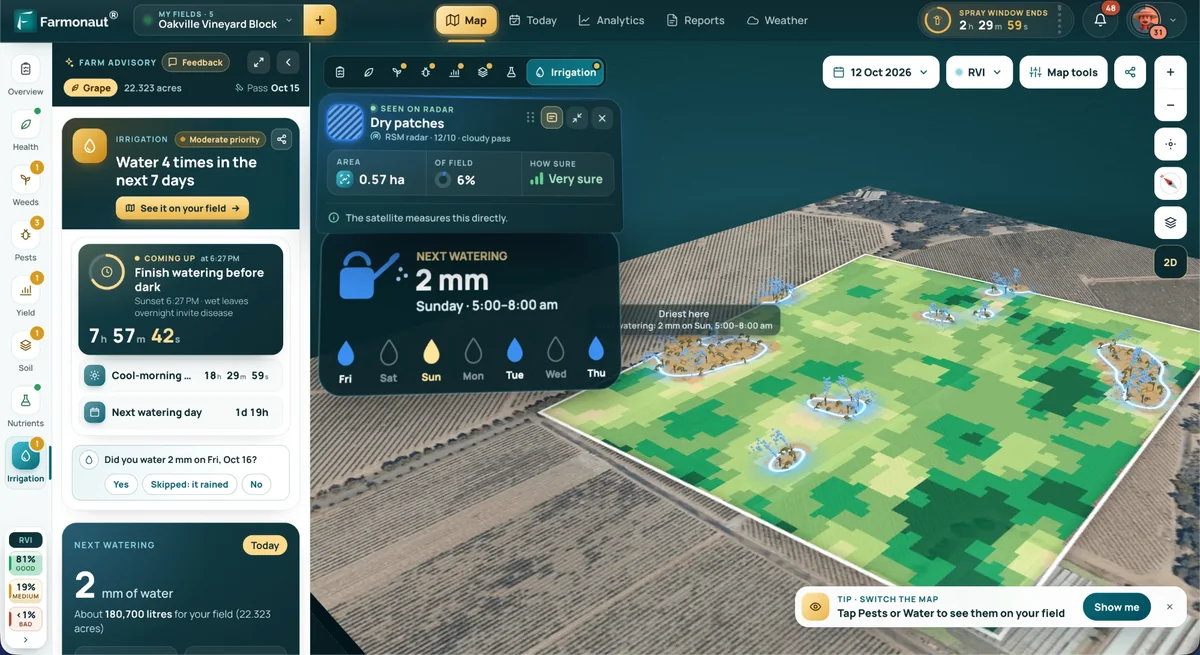
Scout early. Infections at the seedling stage cause the most damage. After storms with wind-blown rain or sand, walk susceptible fields, turn leaves over and look for water-soaked spots. Mark hot spots so you can compare them with later checks.
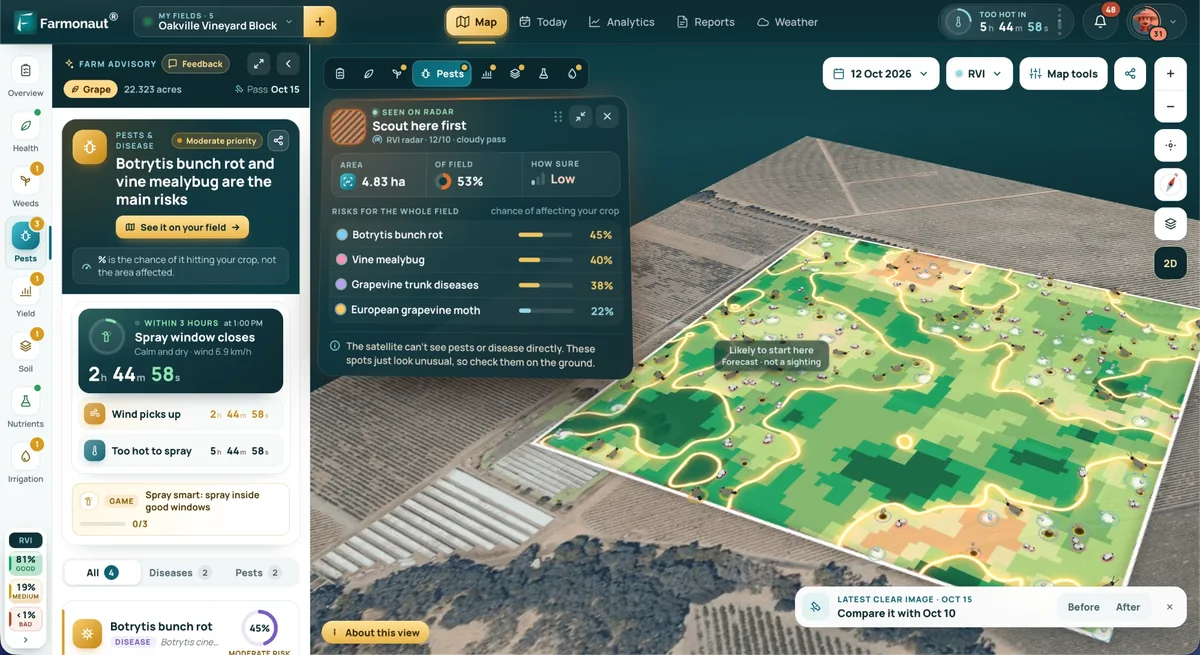
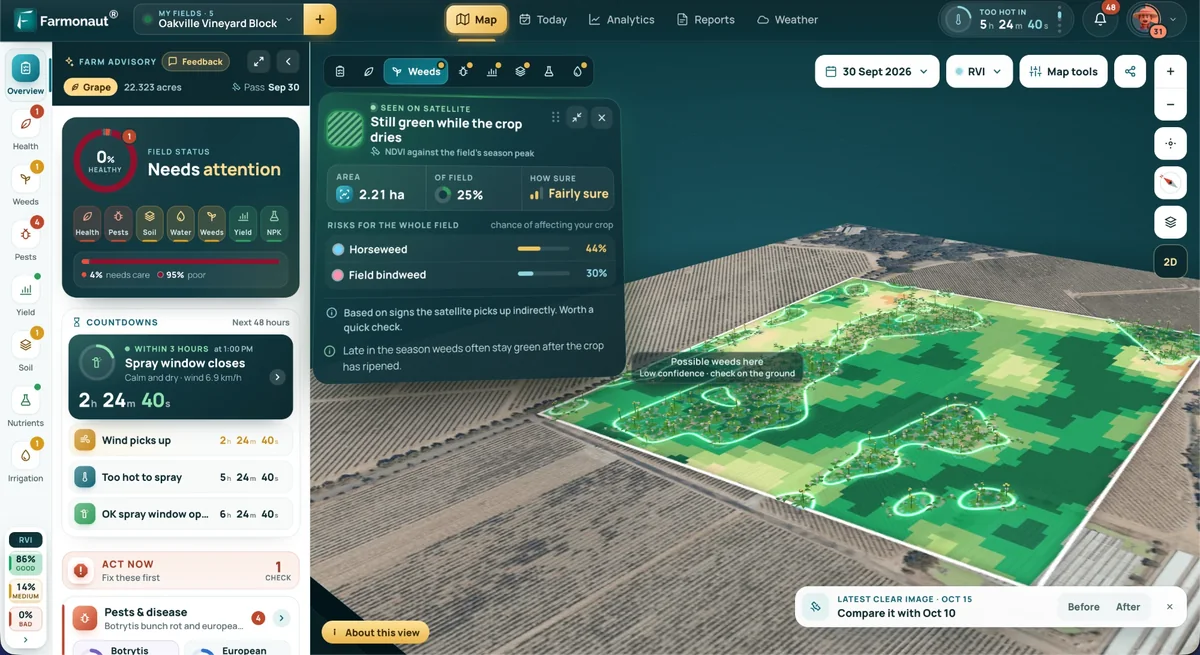
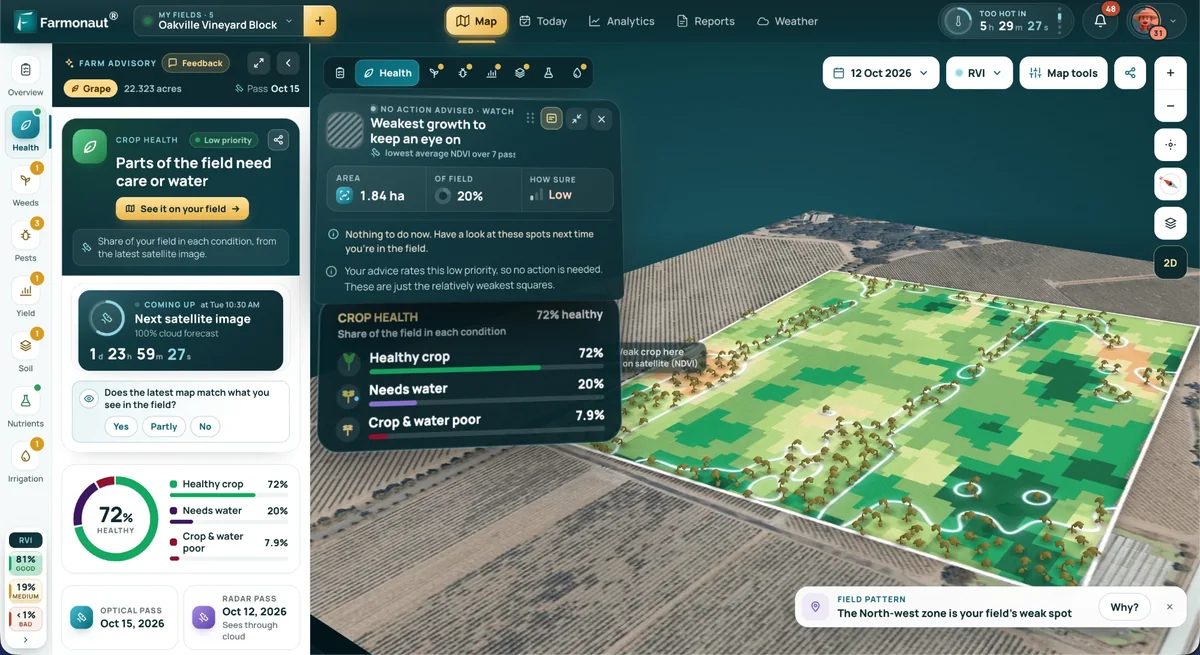
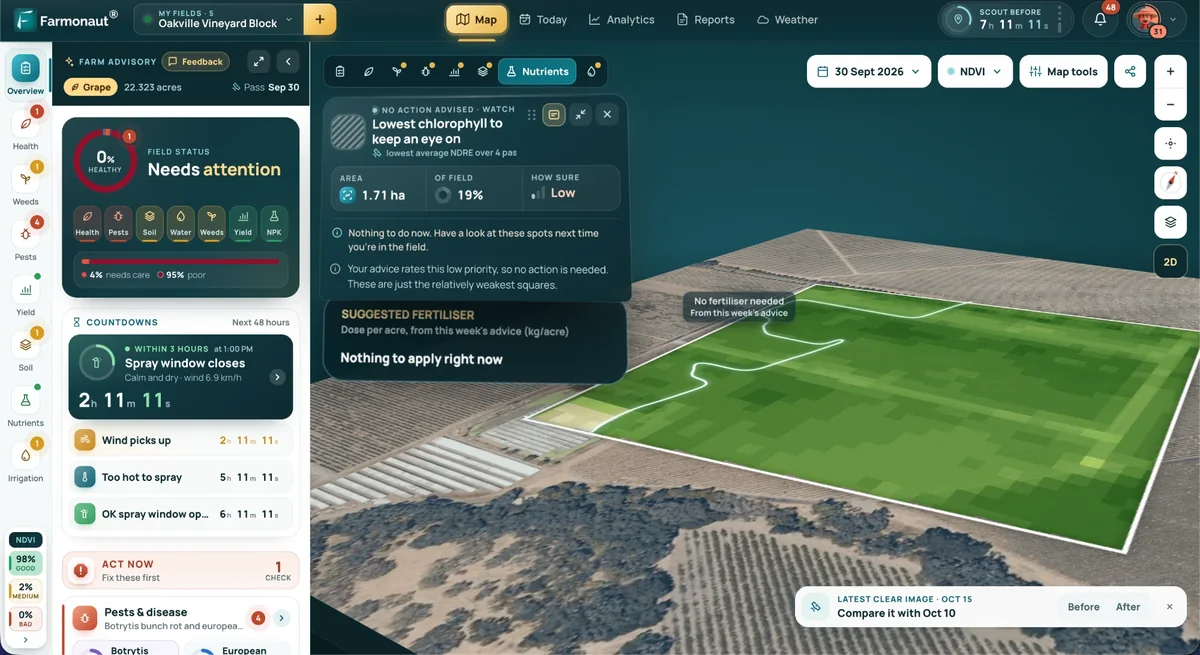
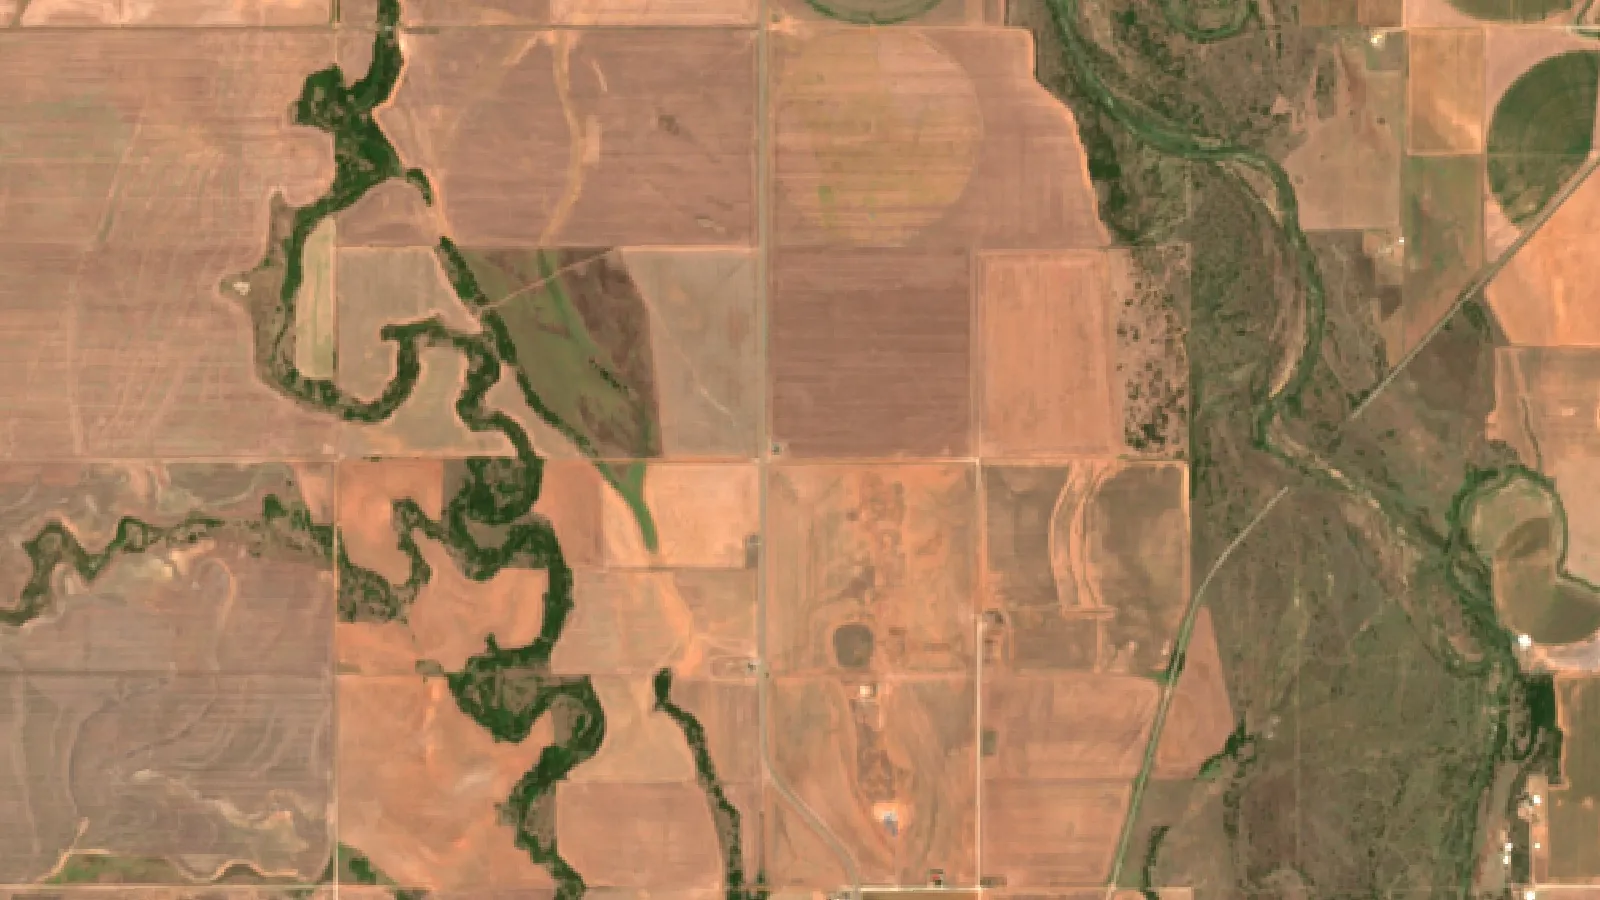
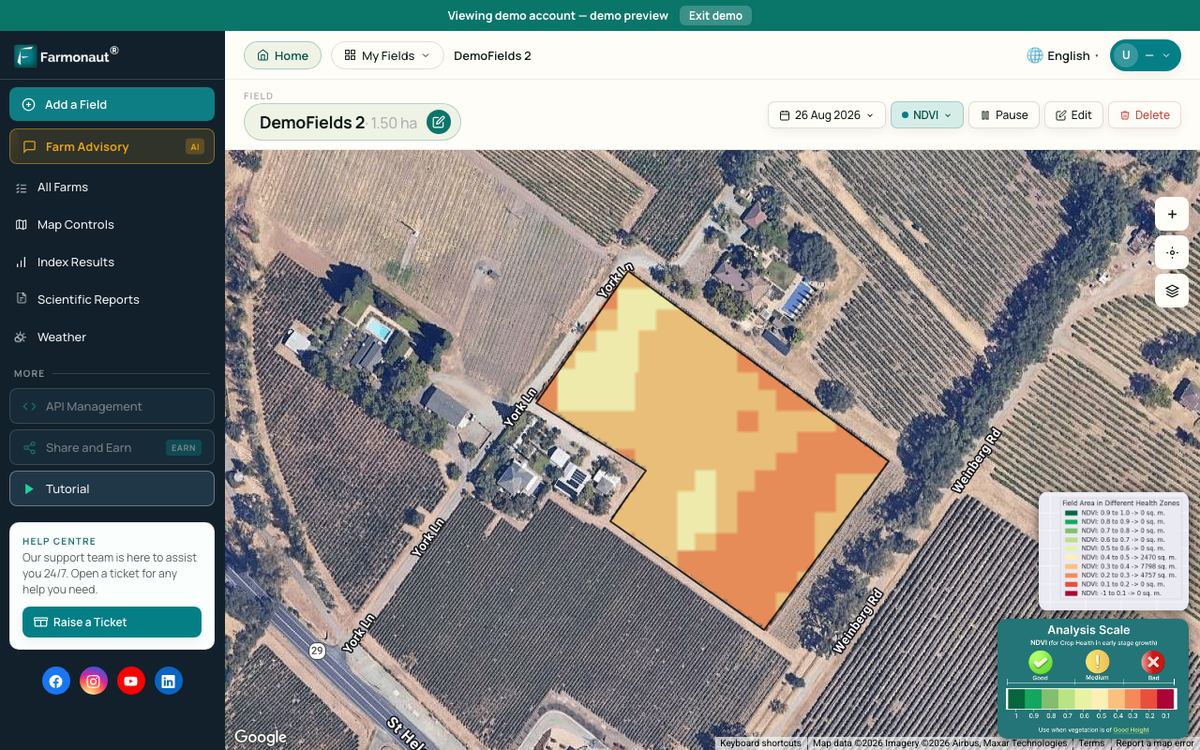
Satellite crop-health maps help you choose where to walk. They show patches where plant vigour drops faster than in the rest of the field. They cannot name the disease, so a patch still needs a ground check. The Farmonaut Satellite + AI Farm Monitoring System offers this kind of field map through its web and mobile app, and developers can pull the same data through the satellite API and weather API documentation. Read more on AI crop monitoring.
| Method | Best for | Limit |
|---|---|---|
| Walking and leaf checks | Confirming the disease and the stage | Slow on large farms |
| Satellite maps | Finding weak patches across every field | Cannot tell one disease from another; clouds delay images |
| Drone flights | Close-up views of suspect patches | Pilot time and flight rules |
| Lab test | Proof of the pathogen | Takes days and needs a sample |

▶ How to monitor crops with satellite maps in the Farmonaut web app · 8:43
Estimate the cost of an outbreak in your field
Use the calculator below with your own acres, yield, price and expected loss. It shows the revenue at risk so you can compare it with the cost of a resistant variety or a rotation.
Try the numbers for your own farm below.
Calculator
How much revenue could an outbreak cost?
Enter your own acres, yield, price and expected loss.
- Lint lost: 22,500 lb
- Bales lost (480 lb): 46.9 bales
- Revenue at risk per acre: $29
Example values only, not a benchmark or forecast. The 5% loss is an example; national losses have been about 0.1% a year while single fields have lost 20% (Cotton Incorporated bulletin). Price input: example, use today’s price.
FAQ
What is angular leaf spot of cotton caused by?
It is caused by the bacterium Xanthomonas citri pv. malvacearum, also written X. citri subsp. malvacearum and formerly X. campestris pv. malvacearum.
Is it the same as bacterial blight?
Yes. It is the leaf phase of bacterial blight. The same disease is called black arm on stems and boll rot on bolls.
Can angular leaf spot of cotton spread to other crops?
It is economically important only on cotton. The similarly named disease of cucumber, melon and strawberry comes from different bacteria.
Can I spray to stop it?
US extension guides say no economical chemical control is available. Prevention with resistant varieties, delinted seed, rotation and residue control is the plan.
How long does the bacterium survive?
Alabama Extension reports at least 22 months on cottonseed and at least 5 months in dry crop debris, depending on conditions.
Related pages on our site: cotton soil types · cotton climate needs · cotton harvest timing · agricultural cooperation
Farmonaut crop monitoring
Find weak cotton patches from space
Satellite crop-health maps show where to scout first after a storm.



Keep reading

Sources
- Crop Protection Network, Bacterial Blight of Cotton (2023): cropprotectionnetwork.org
- Alabama Cooperative Extension System, ANR-3270 Bacterial Blight of Cotton (2026): aces.edu
- Cotton Incorporated et al., Identification and Management of Bacterial Blight of Cotton: cottoncultivated.cottoninc.com
- UGA Extension Appling County, Bacterial Blight of Cotton (2016): site.extension.uga.edu
- Cotton Disease Loss Estimate Committee, 2013 season (Beltwide 2014): cotton.org
- Cotton Disease Loss Estimate Committee, 2014 season (Beltwide 2015): cotton.org
- Cotton Disease Loss Estimate Committee, 2015 season (Beltwide 2016): cotton.org
- Cotton Disease Loss Estimate Committee, 2016 season (Beltwide 2017): cotton.org
- Cotton Disease Loss Estimate Committee, 2017 season (Beltwide 2018): cotton.org
- Cotton Disease Loss Estimate Committee, 2020 season (Beltwide 2021): cotton.org
Discussion
Questions, corrections or field experience? Share them below. First-time comments are reviewed before they appear, and your email is never published.
No comments yet. Be the first to add a question or your experience.

 JJM Farms
 WeMe Global
 Pixxel
 Agrotoken
 Blue BearX
 Insignito
 Croptimum
 DnCubed
 Field Capacity
 Indosistim Teknologi
 Liquify Digital
 CU Foods
 BeyondTech Global
 Rouge VC
 AgroGreen Dynamics
 AgroRisk
 Oath Inc
 Reddane Farming
 Esri North East Africa

 Licence holder · Niger · Gold
 Client · Tanzania · Gold
 Client · Somalia · Gold