

Soil fertility · Field practice guide
How to Use Cultural Practices to Maintain Soil Fertility
Rotate with legumes, keep the ground covered, till less, return manure and residue, add grazing or perennials, use IPM and test before you fertilize. Here is what each practice does, with numbers from USDA, SARE and peer-reviewed studies.
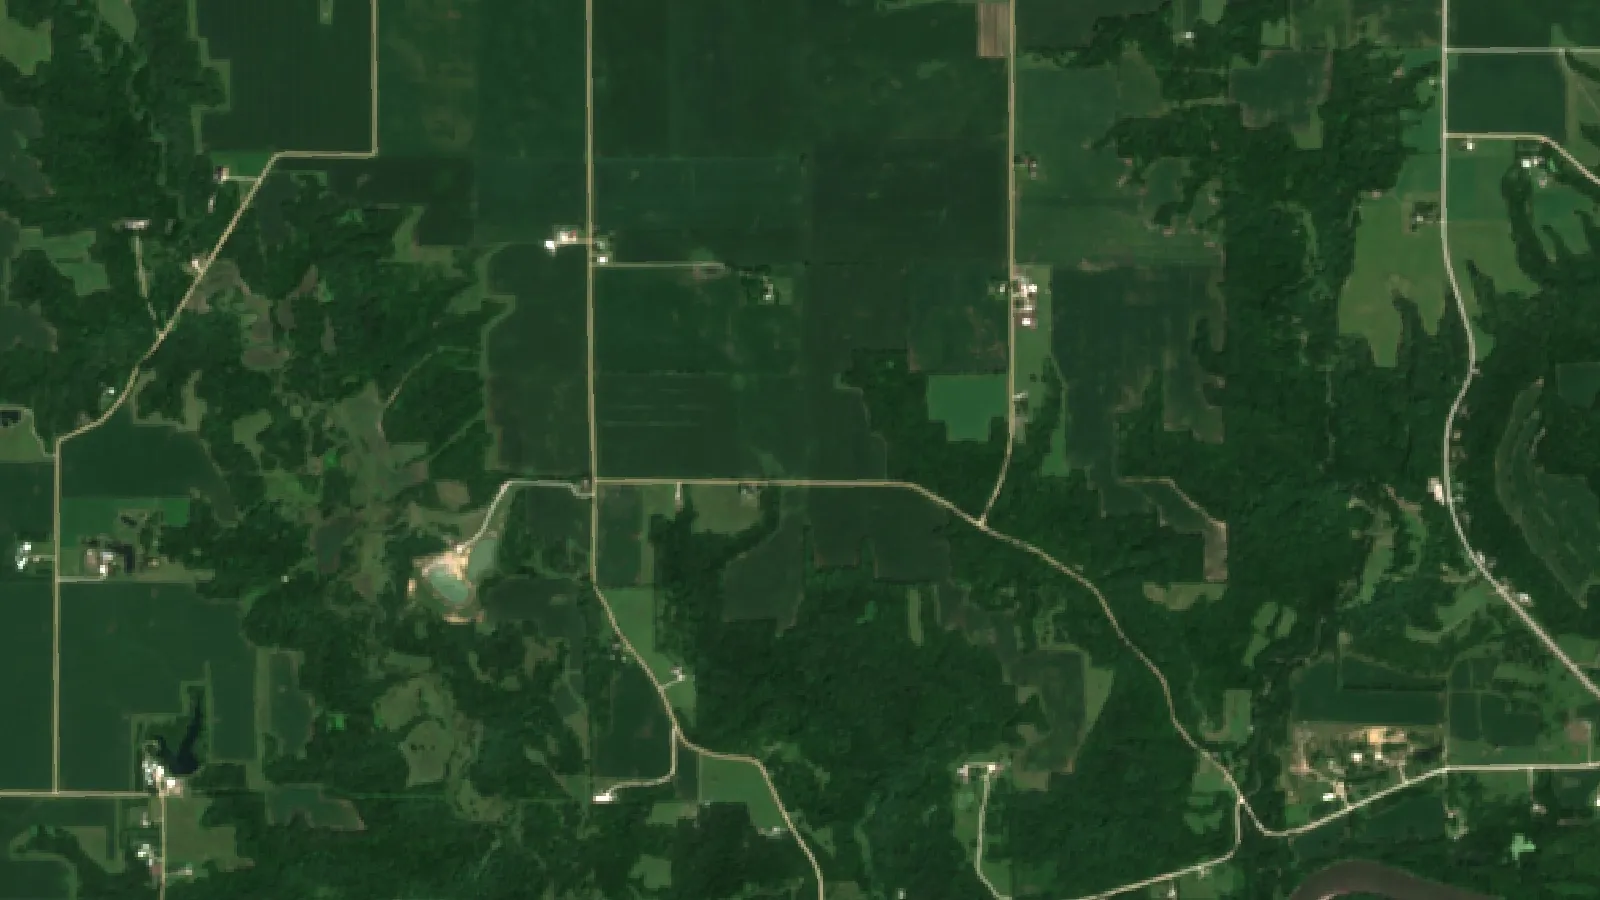
Key takeaways
- Legume pre-crops raised the next crop’s yield by 20% on average across 462 field experiments (Nature Communications, 2022), with larger gains in low-yield settings.
- US cropland planted to cover crops reached 17,985,831 acres in 2022, about 4.7% of cropland, up from 2.7% in 2012 (USDA Census of Agriculture; Choices, 2024).
- No-till was used on 105.2 million US acres in 2022 (USDA Census), but works best together with residue cover and rotation (Nature, 2015).
- In an Oregon State University example, a vetch cover with 3,000 lb of dry matter per acre released about 50 lb of plant-available nitrogen; at DTN’s 14 October 2026 urea average of $0.73/lb N, that is worth about $36 per acre.
- Many counties dropped cover crops between 2017 and 2022, so start small, measure and use cost-share where available.
In this article
- What cultural practices mean for soil fertility
- Seven cultural practices at a glance
- 1. Rotate crops and include a legume
- 2. Keep the soil covered with cover crops
- 3. Disturb the soil less
- 4. Return manure, compost and crop residue
- 5. Bring in livestock and perennials
- 6. Use integrated pest management to protect soil life
- 7. Test the soil and time nutrients to the crop
- Water management and erosion control
- What studies show when practices are combined
- Common barriers and how growers handle them
- How to build a fertility plan field by field
- How we checked the numbers
To use cultural practices to maintain soil fertility, change how you grow crops rather than only what you add to the field. Rotate crops and include a legume. Keep living cover on the ground between cash crops. Till less. Return manure, compost and crop residue. Bring in grazing or perennials where you can. Manage pests in ways that protect soil life, and test the soil so nutrients go where they are needed. Each step feeds the organisms that build organic matter and recycle nutrients.
This guide explains seven cultural practices in plain terms, with numbers from USDA, SARE, university extension services and peer-reviewed studies. It shows how many US farms already use them, what a legume in the rotation does for the next crop, what growers pay for cover crop seed, and it gives a calculator to test whether a legume cover crop pays its way on your own costs.
What cultural practices mean for soil fertility
Cultural practices are the everyday choices a grower makes about crops, timing, tillage and residue. They differ from inputs such as bagged fertilizer or lime. A fertile soil supplies nutrients, holds water and lets roots grow. Much of that depends on organic matter and on the living things that break it down.
The Food and Agriculture Organization explains that organic matter, especially the more stable humus, raises a soil’s capacity to store water and carbon. Soil organisms do the main work of nutrient cycling. So a practice that feeds them, or stops them being disturbed, tends to help fertility over time. You can read more in the FAO chapter on the importance of soil organic matter.
The US Department of Agriculture groups this thinking into a short set of principles on its farmers.gov soil health page: keep the soil covered, disturb it as little as you can, keep living roots in the ground as long as possible, grow a range of plants, and bring in livestock where it fits. The seven practices below put those principles into field terms.
Fertility is not a single number. A soil test shows nutrient levels on the day of sampling. Organic matter, structure, water infiltration and biological activity change more slowly. Cultural practices act on all of these, which is why results build over several seasons rather than within one.

▶ How soil and water together shape crop growth, and why both need managing. · 9:40
Seven cultural practices at a glance
The table sums up each practice, what it does for the soil and the main trade-off. Each one has its own section below with the source behind it.
| Practice | What it does for fertility | Main trade-off |
|---|---|---|
| 1. Crop rotation with a legume | Adds nitrogen, breaks pest cycles, varies root depth | Needs markets for more crops |
| 2. Cover crops | Protects bare soil, feeds soil life, holds nitrate | Seed, planting and termination cost |
| 3. Reduced or no tillage | Keeps structure and surface residue | Yields can dip if used alone |
| 4. Manure, compost and residue | Returns nutrients and carbon | Hauling cost; nutrient balance |
| 5. Livestock and perennials | Long-lived roots, manure on site | Fencing, water and labour |
| 6. Integrated pest management | Fewer broad sprays, more soil life | Needs scouting time |
| 7. Soil testing and timed nutrients | Matches supply to crop demand | Lab fees and planning |
1. Rotate crops and include a legume
Rotation means growing different crops in sequence on the same field. It is the oldest cultural practice for fertility. Different crops take up different amounts of each nutrient, root at different depths and host different pests. A legume such as soybean, pea, clover or alfalfa fixes nitrogen from the air with the help of root bacteria, so part of the next crop’s need is already in the soil.
Chart
Yield gain from a legume before the main crop
Average change in main-crop yield vs non-legume systems, global meta-analysis of 462 field experiments
A global meta-analysis in Nature Communications (2022) pooled 11,768 yield observations from 462 field experiments. It found that legume pre-crops raised the yield of the following main crop by 20% on average. The gain was larger in low-yielding settings (32%) than in high-yielding ones (7%), and it fell as nitrogen fertilizer rates rose.
SARE’s handbook on diversifying cropping systems reports that crops grown in rotation yield about 10% more than the same crops in monoculture in normal seasons, and as much as 25% more in dry seasons. It adds that the rotation effect can remain even when both systems get plenty of nitrogen, which points to benefits beyond nitrogen alone, such as better structure and fewer root diseases.
How to start: list the crops you can sell or feed, then plan a sequence that avoids the same crop family two years running. Put a legume before your hungriest crop. Include at least one crop with a deep or fibrous root system, such as a small grain or a forage grass. Keep a field record so you can compare yields and soil tests across the cycle.
A sibling guide covers rotation planning in more depth: crop rotation benefits in sustainable agriculture.
2. Keep the soil covered with cover crops
A cover crop is grown to protect and feed the soil, not for sale. SARE’s chapter on cover crops in Building Soils for Better Crops lists the main benefits: less erosion and runoff, more organic matter from roots and residue, nitrate held in the field instead of leaching away, extra nitrogen from legumes, looser compacted layers and habitat for beneficial organisms.
Chart
Share of US cropland planted to cover crops
Percent of total cropland in the 48 contiguous states, Census of Agriculture years
US adoption is rising but still small. The 2022 Census of Agriculture counted 17,985,831 acres of cropland planted to a cover crop (excluding CRP land), up from 15,390,674 acres in 2017. A 2024 analysis in Choices magazine put this at 4.7% of cropland in the 48 contiguous states in 2022, up from 4.0% in 2017 and 2.7% in 2012. The same study found that many counties also dropped the practice, which slowed the net gain.
Choose the species for the job. Cereal rye and radish break up compaction and scavenge nitrate. Hairy vetch, crimson clover and peas add nitrogen. Sorghum-sudangrass and sunn hemp grow a lot of biomass in warm weather. Mixes can do several jobs at once.
How much nitrogen a cover crop returns depends on its type and stage. An Oregon State University guide, Estimating plant-available nitrogen release from cover crops, gives worked examples. Common vetch at 3% nitrogen and 3,000 lb of dry matter per acre took up about 90 lb of nitrogen, of which about 50 lb per acre became available to the next crop. Cereal rye at heading, with 8,000 lb of dry matter and 1% nitrogen, tied up about 27 lb per acre instead. Timing of termination matters as much as the species.
Seed cost is the first question most growers ask. A national cover crop survey reported in the same SARE chapter found that 16% of respondents paid $6 to $10 per acre for seed, 27% paid $11 to $15, 20% paid $16 to $20 and 14% paid $21 to $25. About one in four paid $26 or more.
In the US, the Natural Resources Conservation Service can share part of the cost through EQIP under practice code 340 (Cover Crop). Payment rates differ by state and year. For example, the Pennsylvania FY 2026 EQIP and CSP bulletin sets an annual cap of $40,000 for practice 340 under EQIP. Check your state’s current payment schedule before you budget.
The calculator below lets you set a legume cover crop’s nitrogen credit against what it costs. The defaults are examples only, set close to break-even.
Chart
What growers paid for cover crop seed
Share of survey respondents by seed cost per acre (US$); about one in four paid $26 or more
Try the numbers for your own farm below.
Calculator
Does a legume cover crop pay for itself?
Set the nitrogen credit and other value against seed and field costs, per acre.
- Value of nitrogen credit: $36 US$/acre
- Total cost: $45 US$/acre
- Break-even N price: $0.73 US$/lb N
Example values only, set near break-even; they are not a benchmark or a forecast. The nitrogen price default is the DTN US retail urea average of $0.73 per lb of N for the survey reported on 14 October 2026; use today’s price from your dealer. The nitrogen credit depends on species, growth and termination date (Oregon State University gives about 50 lb/acre for a well-grown vetch example). Other value can include grazing or a yield effect you have measured. Cost-share rates vary by state and programme. Get professional advice before large changes.
3. Disturb the soil less
Each tillage pass breaks up soil aggregates and speeds the breakdown of organic matter. It can also leave the surface bare and open to wind and water erosion. Reduced tillage and no-till keep more residue on top and leave the pore network of old roots and earthworm channels in place, which helps water soak in.
No-till is now common on US cropland. The 2022 Census of Agriculture recorded 105,208,515 acres on which no-till practices were used, against 104,452,339 acres in 2017. Another 97 million acres used conservation or reduced tillage other than no-till in 2022.
No-till is not a fix on its own. A global analysis in Nature, Productivity limits and potentials of the principles of conservation agriculture, found that no-till on its own often lowered yields, that the negative effect was smallest when it was combined with residue retention and crop rotation, and that all three together raised rainfed yields in dry climates. The lesson for fertility is to adopt the three together, not one at a time.
How to start: try strip-till or no-till on one field with good drainage. Keep residue on the surface. Check planter set-up for seed-to-soil contact. Watch for slugs, voles and cooler, wetter soil in spring, and adjust planting dates if needed.
4. Return manure, compost and crop residue
Organic amendments return both nutrients and carbon to the field. Crop residue left on the surface or worked in lightly feeds soil life and protects the surface. Manure and compost add nitrogen, phosphorus, potassium and micronutrients, along with organic matter.
SARE’s chapter on integrating crops and livestock puts a dollar value on manure as fertilizer. It estimates that manure from a 100-sow farrow-to-finish operation is worth about $16,000 a year and that from a 20,000-bird broiler operation about $6,000. It adds that gains in organic matter, structure and biological activity may double that value.
Use amendments with care. Repeated manure at nitrogen-based rates can build phosphorus beyond crop needs, which raises runoff risk. Compost is more stable and lower in available nitrogen than fresh manure. Test the material and the soil, apply to match crop removal, and follow your local nutrient management rules. Check the label and local rules for any purchased product, and get professional advice for large applications.

▶ Why soil carbon matters for fertility, water holding and resilient yields. · 12:15
5. Bring in livestock and perennials
Perennial forages and grazing add long-lived roots and spread manure where it is needed. SARE notes that perennial forage crops in livestock systems reduce erosion risk and help maintain or increase organic matter. Soil health tests on dairy farms show good results for most indicators, although compaction remains a concern.
On mixed farms, grazing cover crops or crop residue can turn a soil practice into a feed source. Short grazing periods with long rest, and keeping animals off wet ground, protect structure. Where livestock are not an option, a few years of a hay or grass-legume ley in the rotation adds similar root benefits.
6. Use integrated pest management to protect soil life
Integrated pest management (IPM) combines monitoring, prevention and targeted control so that pesticides are used only when needed. The US Environmental Protection Agency describes IPM as a four-tiered approach: set action thresholds, monitor and identify pests, prevent problems, and control them when thresholds are passed.
Cultural tools sit at the heart of IPM: rotation that breaks pest cycles, resistant varieties, clean seed, planting dates that avoid peak pest pressure and habitat for natural enemies. Fewer broad-spectrum sprays mean less disruption to the earthworms, fungi and insects that cycle nutrients. When you do spray, read and follow the product label, and check local rules on buffers and timing.
7. Test the soil and time nutrients to the crop
Cultural practices work best with a clear picture of what the soil already holds. Test each field every two to four years, at the same time of year and the same depth, so results are comparable. Track pH, phosphorus, potassium and organic matter. Lime acid soils first, since pH controls how available most nutrients are.
Then match supply to demand. Credit nitrogen from a legume, manure or a cover crop before you buy more. Split applications on light soils. Leave unfertilized check strips to see how much the soil supplies on its own.
Fertilizer prices make these credits worth counting. DTN’s retail survey of 14 October 2026 put the average US price of urea at $0.73 per pound of nitrogen, anhydrous ammonia at $0.60 and UAN32 at $0.76. These are average retail prices for the period surveyed; your dealer’s price will differ.
Field maps help you see where a practice works and where it does not. Satellite crop-health maps can show patterns in vigour across a field over the season, which helps you choose where to take soil samples or test a new practice. Farmonaut provides such maps on web, Android and iOS.
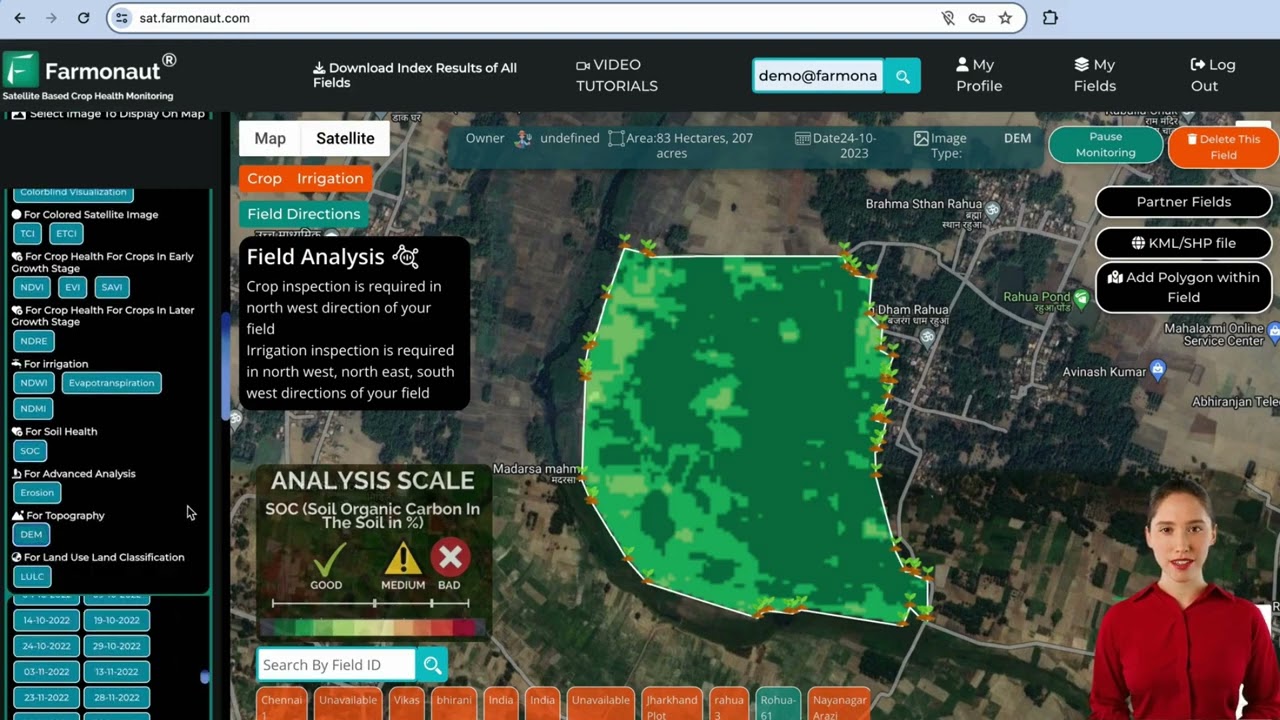
▶ A walk-through of a satellite monitoring web app for viewing crop health maps by field. · 8:02
Water management and erosion control
Fertility washes away with topsoil. Grassed waterways, contour strips, field borders and buffer strips slow runoff and catch sediment. Better infiltration from cover and less tillage means more rain stays in the root zone. Efficient irrigation, scheduled from soil moisture rather than the calendar, avoids leaching nitrate below the roots.
For more on irrigation planning, see our guide to sustainable water management.
What studies show when practices are combined
Single practices help; combinations help more. A six-year field experiment reported in Nature Communications (2023), Diversifying crop rotation increases food production, reduces net greenhouse gas emissions and improves soil health, replaced a wheat-maize sequence with rotations that added sweet potato, peanut and soybean. The diversified rotations raised equivalent yield by up to 38%, cut nitrous oxide emissions by 39%, and the legume rotations raised soil organic carbon stocks by 8% and raised a soil health index by 45%.
That trial ran on the North China Plain, so the exact numbers will not transfer to every farm. The pattern is consistent with the US and European results above: more crop types and more time with living roots tend to improve soil function. Results depend on soil, climate, markets and management.
Common barriers and how growers handle them
Many farms try a practice and then stop. The Choices magazine study on disadoption of cover crops and no-till found that from 2017 to 2022, 1,279 counties, or 45.6% of counties in the contiguous states, lost a combined 2,319,651 acres of cover crops. Without that loss, net growth would have been 4.9 million acres larger.
Common reasons growers give include cost, time at busy seasons, short windows after harvest, and early yield dips. Practical answers:
- Start small. Test a practice on one field or a few strips, with a check strip left as before.
- Pick the easiest fit first. A cereal rye cover after soybean is easier to establish than after late corn.
- Use cost-share. Check NRCS EQIP and CSP in the US, or your national agri-environment scheme elsewhere, for current rules.
- Measure. Keep yields, input costs and soil tests by field so you can see the trend after three or four seasons.
- Learn from neighbours. Local soil health groups and extension field days shorten the learning curve.
Financial results depend on your own prices and yields. Get advice from an agronomist or farm business adviser before large changes.
How to build a fertility plan field by field
A simple plan ties the seven practices together:
- Map each field and note its soil type, drainage and history.
- Take a baseline soil test and record organic matter.
- Set a rotation that includes a legume and at least one small grain or forage.
- Choose a cover crop for each gap of six weeks or more between cash crops.
- Reduce tillage on fields where drainage allows.
- Credit manure, compost, legume and cover crop nitrogen before buying fertilizer.
- Scout pests against thresholds and keep spray records.
- Repeat the soil test every two to four years and compare.
Our comparison of conventional and sustainable agriculture covers the wider economics, and our pages on ways to improve soil health in agriculture and soil health practices for sustainable farming go deeper on testing and biology.
How we checked the numbers
Adoption figures come from the USDA Census of Agriculture (2017 and 2022) and the Choices magazine analysis of the same data. Yield effects come from peer-reviewed studies and are given for the settings each study covered. Seed cost bands come from the survey reported by SARE. Fertilizer prices are DTN retail averages for the date stated, not dealer quotes. Cost-share caps are from a single state bulletin and vary by state. Each source is listed at the end of the article.
FAQ
What are cultural practices in soil fertility management?
They are farming choices that change how crops are grown rather than what is applied: crop rotation, cover crops, reduced tillage, returning residue and manure, grazing and perennials, integrated pest management and well-timed nutrients based on soil tests.
Which cultural practice adds the most nitrogen?
Growing legumes, either as a cash crop in the rotation or as a cover crop. A 2022 meta-analysis found legume pre-crops raised the next crop’s yield by 20% on average. In an Oregon State University example, a vetch cover with 3,000 lb of dry matter per acre supplied about 50 lb of plant-available nitrogen.
How long do cultural practices take to improve soil fertility?
Some effects, such as nitrogen from a legume, show in the next crop. Changes in organic matter and structure build over several years. Compare soil tests and yields over three to four seasons.
Do cover crops pay for themselves?
It depends on seed and planting cost, the nitrogen credit, fertilizer prices, any cost-share and effects on the next crop. Use the calculator in this guide with your own figures, and talk to your adviser before large changes.
Is no-till good for soil fertility?
No-till protects structure and surface residue, but yields can dip when it is used on its own. A global analysis in Nature found better results when no-till is combined with residue cover and crop rotation.
Related pages on our site: farm carbon footprinting · product traceability · farm fleet management · agribusiness admin dashboard · satellite and weather API documentation · web app
Farmonaut crop monitoring
See how each field responds
Draw your fields once and Farmonaut shows satellite crop-health maps for them through the season, on web, Android or iOS, so you can compare fields where you change practices.




Sources
- USDA NASS, 2022 Census of Agriculture, Volume 1, Chapter 1: US National Level Data (2024): nass.usda.gov
- Choices magazine, Pervasive disadoption substantially offsets new adoption of cover crops and no-till (3rd quarter 2024): choicesmagazine.org
- Zhao et al., Global systematic review with meta-analysis reveals yield advantage of legume-based rotations and its drivers, Nature Communications (2022): pmc.ncbi.nlm.nih.gov
- Nature Communications, Diversifying crop rotation increases food production, reduces net greenhouse gas emissions and improves soil health (2023): nature.com
- Pittelkow et al., Productivity limits and potentials of the principles of conservation agriculture, Nature (2015): nature.com
- SARE, Building Soils for Better Crops, Ch 10: Cover Crops: sare.org
- SARE, Building Soils for Better Crops, Ch 11: Diversifying Cropping Systems: sare.org
- SARE, Building Soils for Better Crops, Ch 12: Integrating Crops and Livestock: sare.org
- Oregon State University Extension, Estimating plant-available nitrogen release from cover crops (PNW 636): catalog.extension.oregonstate.edu
- DTN, UAN32 leads fertilizer prices higher (14 October 2026): dtnpf.com
- USDA NRCS Pennsylvania, Bulletin 440-26-06: FY 2026 EQIP and CSP cost list and payment caps: nrcs-prod.azureedge.us
- FAO, The importance of soil organic matter: fao.org
- USDA farmers.gov, Soil health principles and practices: farmers.gov
- US EPA, Integrated Pest Management (IPM) principles: epa.gov
Discussion
Questions, corrections or field experience? Share them below. First-time comments are reviewed before they appear, and your email is never published.
No comments yet. Be the first to add a question or your experience.

 Prochecker
 Misteo
 Tres Valles
 LACOS Geoinformation
 Pulsar Supernova
 Magrifly
 LatConnect 60
 WebsEdge
 Blickwinkel
 Agricultural Credit Policy Council
 MCSOD
 Marei Nursery
 eKGIS
 Mostas Tech
 Andex
 FCF India
 Unifrutti Gulf
 Deluxe Conseil

 Licence holder · Niger · Gold
 Licence holder · Nigeria · Gold + lithium
 Client · Tanzania · Gold
 Client · Somalia · Gold
 Client & affiliate partner · Ghana · Gold










