

Reviewed September 2026 against NCBI/PMC meta-analysis data, Michigan State University Extension soil test standards, and Rutgers Plant & Pest Advisory.
Try it: Run your own numbers →

Magnesium Deficiency in Plants: Symptoms, Causes, Fixes
Magnesium deficiency in plants shows up first as interveinal chlorosis on older leaves — yellow tissue between veins that stay green — because magnesium is mobile and the plant pulls it from mature leaves to feed new growth. It is confirmed by a soil test below roughly 40 ppm on mineral soils or a leaf tissue test below 0.1-0.2% dry weight, and it is fixed with either a soil-applied magnesium source (dolomitic lime, Epsom salt, or potassium magnesium sulfate) or a foliar Epsom salt spray for a faster response. Below is the diagnostic sequence, the exact thresholds, application rates by crop, and the yield numbers a 2020 meta-analysis of 570 paired field observations found when the deficiency was actually corrected.
Table of Contents
- Why Magnesium Matters to a Plant
- Recognizing Magnesium Deficiency Symptoms
- Confirming It: Soil and Leaf Test Thresholds
- Causes of Magnesium Deficiency
- What Deficiency Actually Costs in Yield
- Calcium-Magnesium Deficiency and the Antagonism Problem
- Magnesium Deficiency in Tomato Plants
- Control Measures and Application Rates
- Epsom Salt Rate Calculator
- Satellite Detection vs. Field Scouting
- Crop-Specific Magnesium Management
- How Farmonaut Fits Into This
- FAQs
- Try it: Run your own numbers
Why Magnesium Matters to a Plant
Magnesium sits at the center of every chlorophyll molecule, so it is directly tied to a plant’s capacity to photosynthesize. It also activates a wide range of enzymes involved in energy transfer (ATP formation) and protein synthesis, and it helps load sugars into the phloem for transport out of leaves. When magnesium runs short, the plant does not just yellow — it loses the machinery to produce and move the carbohydrates that determine yield and fruit quality.
Because magnesium is phloem-mobile, a deficient plant will cannibalize magnesium from older leaves and relocate it to actively growing tissue. That single fact explains the diagnostic pattern below: deficiency symptoms almost always appear on the oldest leaves first, not the newest ones. If you see interveinal yellowing starting at the growing tip instead, that points to a different, immobile-nutrient deficiency (commonly iron or manganese), not magnesium.
Recognizing Magnesium Deficiency Symptoms
The visual symptoms of magnesium deficiency follow a predictable sequence, and the order matters for a correct diagnosis:
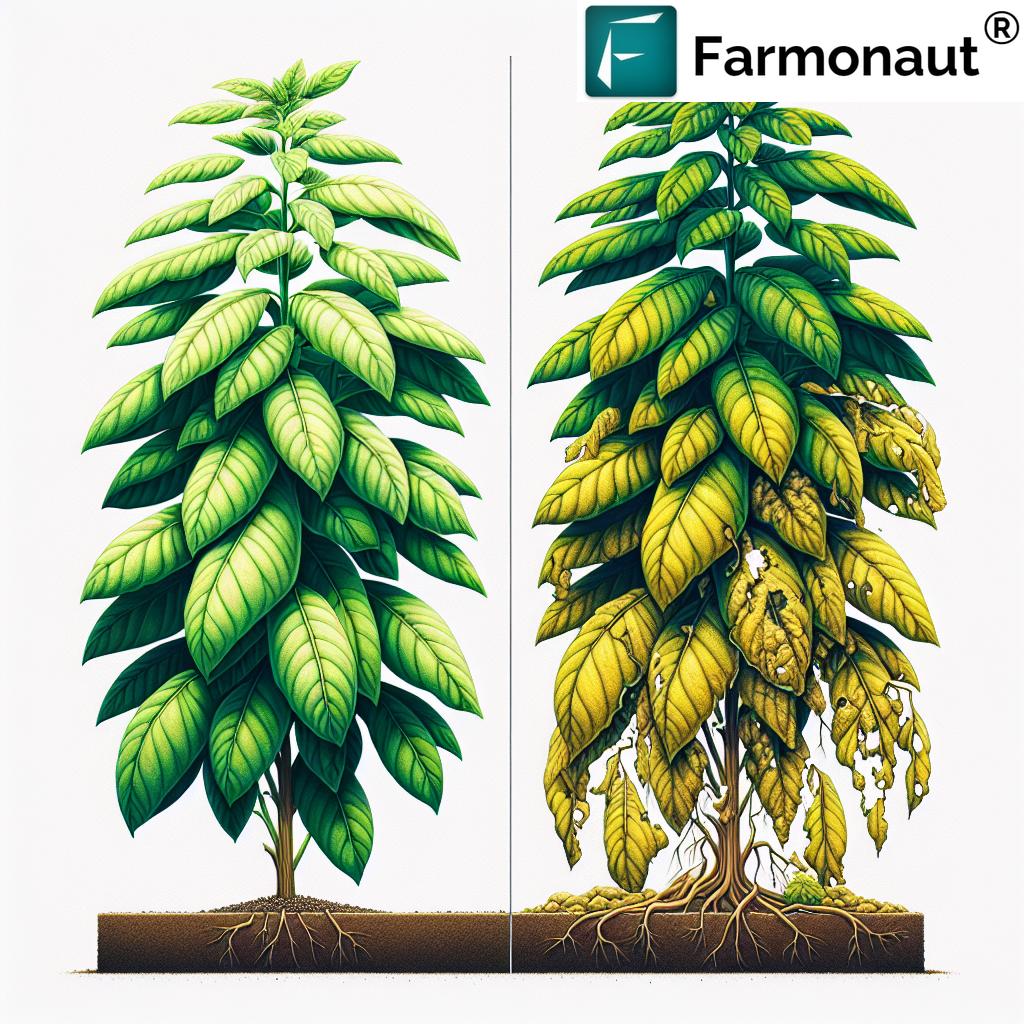
- Interveinal chlorosis on older leaves first: Yellow tissue develops between the veins while the veins themselves stay distinctly green, giving a marbled or striped appearance. This is the single most identifiable symptom of magnesium deficiency in plants and the pattern to search for before assuming any other nutrient problem.
- Progression toward younger leaves: As the deficiency worsens, the same interveinal pattern moves up the plant into mid-canopy leaves. Only in severe, prolonged deficiency does it reach new growth.
- Reddish-purple or bronze leaf margins: In many broadleaf crops, the chlorotic tissue develops a reddish-purple tint at the edges before turning necrotic (brown and dead) in advanced cases.
- Premature leaf drop: Severely affected older leaves often senesce and drop weeks ahead of a normal cycle, reducing the plant’s total photosynthetic leaf area during the season it matters most.
- Stunting and reduced vigor: Because energy transfer and photosynthesis are both compromised, overall plant size, stem thickness, and biomass accumulation fall behind unaffected plants in the same field.
- Reduced fruit size and quality: In fruiting crops, magnesium shortfall during fruit fill shows up later as smaller fruit, uneven ripening, and lower sugar content — after the leaf symptoms, not instead of them.
Confirming It: Soil and Leaf Test Thresholds
Visual symptoms tell you something is wrong; they do not confirm magnesium is the cause, since potassium deficiency, manganese toxicity, and some viral infections produce similar mottling. A soil test or leaf tissue test is the only way to confirm magnesium deficiency in plants rather than guess at it. The table below gives the actual critical levels used by university extension labs.
| Test type | Soil/tissue category | Critical (deficient below) | Source |
|---|---|---|---|
| Soil test (Mehlich-3 or equivalent) | General mineral soils | 40 ppm | Michigan State University Extension |
| Soil test | Sandy soils | 35 ppm | Michigan State University Extension |
| Soil test | Fine-textured (clay) soils | 50 ppm | Michigan State University Extension |
| Leaf tissue test | Multiple crop species, dry-weight basis | 0.1% – 0.2% | 70-year systematic review, PMC |
Two things to note about that table. First, the sandy-versus-clay split exists because sandy soils hold less magnesium on their cation exchange capacity and leach it faster, so the “deficient” line is set lower relative to what a clay soil is expected to hold. Second, the tissue-test range (0.1–0.2% dry weight) comes from a 70-year synthesis of critical leaf thresholds across crop species, not a single study — it is the most durable number in this article, because it is a physiological threshold rather than a market price or a regional survey result, and it should not move materially between growing seasons.
Neither of these tests is something an AI summary can run for you. Pull a soil sample at 6-8 inches depth from at least 15-20 points per field, or send in the most recently matured leaves (not the oldest, not the newest) for tissue analysis, and compare the lab’s reported units and method to the table above — different labs use different extraction methods (Mehlich-3, Bray, ammonium acetate), so confirm which one your results use before comparing to a MSU or Penn State Agricultural Analytical Services Lab threshold.
Causes of Magnesium Deficiency in Plants
Four categories of causes drive most magnesium deficiency in plants, and they frequently compound each other in the same field:
Soil Characteristics
- Acidic soils reduce magnesium availability even when total magnesium in the soil is adequate — acidity changes the chemical form magnesium is held in.
- Sandy, low-cation-exchange-capacity soils leach magnesium with rainfall or irrigation, which is why the critical soil test level for sandy soils (35 ppm) sits below the general threshold (40 ppm).
- High levels of competing cations — potassium, calcium, or ammonium — physically outcompete magnesium for root uptake sites. This is called cation antagonism and it is one of the most common on-farm causes of deficiency, because it happens even on soils that test adequate for magnesium.
Imbalanced Fertilization
- Heavy potassium or calcium (including over-liming with calcitic, non-dolomitic lime) fertilization is the single most common human-caused trigger of magnesium deficiency, precisely because of the cation antagonism above.
- Fertilization programs built around N-P-K alone, with no magnesium line item, draw down soil reserves silently over multiple seasons until a threshold is crossed and symptoms appear seemingly all at once.
Environmental Factors
- Cold soil temperatures slow root metabolic activity and reduce magnesium uptake even when soil magnesium is adequate — this is why early-spring chlorosis sometimes resolves on its own as soil warms.
- Drought limits magnesium’s movement through the soil solution to the root surface (mass flow), so deficiency symptoms often appear or worsen during dry spells even on soils that tested adequate earlier in the season.
Plant and Cropping-System Characteristics
- Species and even variety differ in root efficiency at scavenging magnesium — this is why one crop in a rotation shows symptoms and the next does not, on identical soil.
- High-yielding varieties remove more magnesium per acre with each harvest, and without a magnesium replacement line in the fertility program, multi-year removal quietly pushes soil levels below the critical threshold.
What Deficiency Actually Costs in Yield
This is the number an AI summary will not give you, because it takes a real meta-analysis to produce it. A 2020 analysis of 570 paired field observations across 99 studies found that correcting magnesium deficiency raised yield by an average of 8.5% across all crops and conditions. That average masks meaningful variation by starting condition:
| Condition | Average yield gain from Mg fertilization |
|---|---|
| All crops, all conditions (overall average) | 8.5% |
| Severe soil magnesium deficiency (soil test below 60 mg/kg) | 9.4% |
| Soil pH below 6.5 with magnesium applied | 11.3% |
| Fruit crops specifically | 12.5% |
The same analysis found an agronomic efficiency of 34.4 kg of additional yield per kg of magnesium applied across all systems studied, and a 34.3% increase in leaf tissue magnesium concentration following fertilization — the tissue-test confirmation that the applied magnesium was actually taken up, not just applied. All four figures and the 570-observation, 99-study sample size come from the same NCBI/PMC meta-analysis, published in 2020.
For a crop-specific dollar reference point: NC State Extension documents mid-season magnesium deficiency in soybeans costing 3-5 bushels per acre when it goes uncorrected during pod fill — a loss that shows up at harvest even if the plants appeared to recover visually earlier in the season. At current soybean pricing, run that bushel range against your own local elevator price to size the loss on your acreage; the NC State Extension page covers the diagnosis window in more depth.
Calcium-Magnesium Deficiency and the Antagonism Problem
Calcium and magnesium deficiency in plants often show up together, and treating them as one problem rather than two is usually the correct approach — not because they are chemically identical, but because they are locked in the same antagonism described above. Excess calcium (frequently from heavy calcitic lime use) suppresses magnesium uptake, and the reverse can happen with excess magnesium suppressing calcium and potassium. This is precisely why dolomitic lime — which supplies both calcium and magnesium in one pass — is the standard soil-pH corrective recommended for acidic soils that also test low in magnesium, rather than a calcium-only liming product.
The practical rule: before adding calcium to a fertility program, check whether magnesium is already borderline on your soil test. Pushing calcium up without addressing magnesium is one of the most common ways growers manufacture a magnesium deficiency that did not exist the season before.
Magnesium Deficiency in Tomato Plants
Tomatoes are one of the vegetable crops most frequently affected by magnesium deficiency, and the symptom pattern is the same interveinal chlorosis on lower, older leaves described above — typically appearing once fruit load increases and the plant’s magnesium demand for fruit fill and sugar transport rises sharply.
Rutgers Plant & Pest Advisory recommends 5-25 lbs of Epsom salt (magnesium sulfate) per acre to correct confirmed magnesium deficiency in tomato production, with the rate depending on severity and soil type — the lower end for early, mild chlorosis and the higher end for more advanced cases confirmed by tissue test. Epsom salt itself is 9.8% magnesium by weight, a fixed product specification rather than an estimate, so that percentage is the basis for converting any target application rate into pounds of product per acre.
For tomato growers specifically, the Rutgers guidance also flags the calcium-magnesium balance directly: because tomatoes are also prone to blossom end rot (a calcium-related disorder), correcting magnesium without checking calcium status first can trade one deficiency symptom for another if the underlying antagonism isn’t addressed.
Control Measures and Application Rates
Once a soil or tissue test confirms magnesium deficiency, the fix follows a standard sequence:
- Retest before applying anything. Confirm the deficiency against the thresholds in the table above rather than treating on visual symptoms alone, since several other conditions mimic magnesium chlorosis.
- Correct soil pH first, if it is also low. On acidic soils testing low in both pH and magnesium, apply dolomitic lime rather than a magnesium-only product — it solves both problems in one application and avoids re-inducing deficiency through pH-driven unavailability.
- Apply a soil magnesium source for season-long correction. Epsom salt (magnesium sulfate, 9.8% Mg) or potassium magnesium sulfate are the two standard products; use potassium magnesium sulfate only where potassium is also needed, since adding potassium on a soil that is already potassium-adequate reintroduces the antagonism problem described above.
- Use a foliar Epsom salt spray for fast correction. Foliar application bypasses the root uptake problem entirely and is the right choice when symptoms appear mid-season and a soil application would act too slowly to save the current crop, or during a drought when root uptake is already compromised. The 5-25 lbs/acre Rutgers range applies to soil application in tomatoes; foliar rates are lower and more frequent, applied as a dilute spray at label rate every 10-14 days through the deficiency period.
- Rebalance the fertility program going forward so magnesium is a planned line item relative to potassium and calcium, not an annual emergency correction.
- Build organic matter and use cover crops to improve overall nutrient retention — this does not replace mineral correction of a confirmed deficiency but reduces recurrence, and ties into broader soil fertility management practice.
- Manage irrigation to avoid the drought-driven uptake failure described above; fertigation can deliver magnesium directly to the root zone on drip-irrigated crops.
Epsom Salt Rate Calculator
Use the calculator below to convert a target application rate into pounds of Epsom salt product and total field cost, based on the 9.8% magnesium content of Epsom salt and the 5-25 lbs/acre range Rutgers documents for tomato correction — adjust the rate field for your own crop and severity level.
Run your own numbers
Assumptions: uses Epsom salt’s fixed 9.8% magnesium content to back-calculate elemental Mg delivered; does not include application/labor cost, foliar vs. soil application differences, or freight. Epsom salt pricing varies by supplier and season — check current pricing via USDA AMS fertilizer market reports before budgeting at scale.
Satellite Detection vs. Field Scouting
Visual scouting for interveinal chlorosis works, but it only sees what a person walks past, and early-stage deficiency in the lower canopy is easy to miss from a truck window. Multispectral satellite monitoring compares plant health indicators across an entire field on the same day, which changes when a deficiency gets caught relative to when it gets caught by scouting alone.
| Method | Detection speed | Coverage per pass | What it can’t tell you |
|---|---|---|---|
| Traditional visual scouting | Only as often as someone walks the field | Limited to accessible rows and headlands | Whether it’s magnesium specifically — needs a follow-up soil/tissue test either way |
| Satellite-based multispectral monitoring (e.g. Farmonaut) | Every revisit pass, field-wide, same day | Whole field including low-traffic and remote areas | Same limitation — flags stressed zones, does not replace the confirmatory soil/tissue test |
Neither method replaces the other: satellite imagery flags where in a field chlorophyll-linked stress is concentrated, so you know exactly where to pull soil or tissue samples instead of guessing or grid-sampling the whole field blind. That combination — imagery to locate the zone, lab test to confirm the nutrient — is the actual workflow, not a substitute for testing.
Crop-Specific Magnesium Management
Cereal Crops (Wheat, Corn, Rice)
- Magnesium demand peaks during grain fill; interveinal chlorosis on older leaves during this window is the pattern to check first.
- Apply magnesium pre-plant or as an early side-dress rather than waiting for grain-fill symptoms, since a soil correction needs time to become plant-available.
Fruit Trees and Vines
- Magnesium is tied directly to fruit sugar content and coloration, so deficiency shows up in the pack-out grade, not just the leaf.
- Foliar Epsom salt applications during fruit development are the standard fast-correction tool, since soil-applied magnesium in perennial tree crops can take a full season to reach the root zone in quantity.
- Potassium-heavy fertility programs common in fruit production are a frequent trigger of induced magnesium deficiency — check the potassium-magnesium ratio on the soil test, not just the magnesium number in isolation.
Vegetables
- Tomatoes and peppers are the most consistently affected vegetable crops (see the tomato section above for Rutgers’ specific rate guidance).
- Annual soil testing before planting catches a declining trend before it becomes a visible deficiency mid-season.
Oilseed Crops (Soybeans, Canola)
- Magnesium is required for oil synthesis, and NC State’s documented 3-5 bushel/acre soybean loss from mid-season deficiency is specific to this crop group.
- High-yielding varieties remove magnesium faster per bushel than older varieties did, which is why a fertility program that worked five years ago on the same field can fall short today without a magnesium line item added.
How Farmonaut Fits Into This
Farmonaut’s satellite crop health monitoring flags chlorophyll-linked stress zones across a field so you know where to pull the soil or tissue sample that actually confirms magnesium deficiency — it does not replace that test, it tells you where to run it. The platform pairs that imagery with the Jeevn AI advisory system, which factors in crop type, soil test history, and weather data when it comes time to plan a correction.
Farmonaut’s data also plugs into broader input-efficiency work: getting magnesium correction right the first time avoids over-application, which matters for fertilizer production and sourcing questions at scale, and for crops where nutrient management practices carry marketing or certification value, our blockchain traceability tool can document the input program from field to buyer. None of this is exclusive to conventional systems — organic farming methods using compost and magnesium-rich amendments correct the same deficiency through a different input path, and building overall resilience into a farming system, including nutrient buffering capacity, is covered in our broader piece on resilient agriculture systems.
The monitoring tools are available through the Farmonaut app on Android and iOS, or via our app page. Developers integrating field health and weather data directly can use the Farmonaut API or the full satellite and weather API developer documentation.
A Durable Diagnostic Checklist
Because product prices, exact soil survey figures, and even critical-level recommendations get revised by extension services every few years, use this sequence rather than memorizing today’s numbers — it will still be correct after the figures above are updated:
- Confirm the symptom pattern: interveinal chlorosis starting on older leaves. If it starts on new growth, magnesium is not your first suspect.
- Pull a soil test (6-8 inch depth, 15-20 points/field) and a leaf tissue test from recently matured leaves.
- Compare results to your state extension lab’s current critical levels — MSU, Penn State, or your own state’s land-grant soil lab — rather than assuming the 35-50 ppm range above hasn’t been revised, since university labs update thresholds roughly every 3-5 years as new research comes in.
- Check the potassium and calcium levels on the same soil test before treating, since antagonism from either is a common root cause.
- Choose soil-applied (season-long) or foliar (fast) correction based on how far into the season you are and how severe the tissue test result is.
- Retest the following season to confirm correction held and to catch any recurrence from continued high-yield removal.
For current input costs at the time you’re planning a correction, USDA’s Agricultural Marketing Service publishes weekly fertilizer market reports at ams.usda.gov/mnreports — Epsom salt and potassium magnesium sulfate pricing move with broader fertilizer markets and are worth checking fresh rather than budgeting off last season’s invoice.
Two figures are worth flagging as gaps rather than guessing at: there is no consolidated USDA/NASS national survey of what percentage of US agricultural land tests below the magnesium critical threshold — the data that exists is state-by-state through individual extension soil-testing programs, so a national “X% of US cropland is magnesium-deficient” statistic does not exist and any page stating one is asserting a number nobody has published. Similarly, cost-per-acre to correct a deficiency depends too much on product choice, application method, and regional freight to state as a single figure — use the calculator above with your own local Epsom salt price instead.
Further reading:
- magnesium deficiency in plants
FAQs About Magnesium Deficiency in Plants
- Q: How quickly can magnesium deficiency symptoms appear in plants?
A: Interveinal chlorosis on older leaves can appear within a few weeks of magnesium becoming limited in the root zone, though the exact timing depends on species, growth stage, and how quickly the plant’s demand is rising (fruit fill and grain fill are the highest-demand windows). - Q: Can excess magnesium be harmful to plants?
A: Yes. Excess magnesium can suppress uptake of potassium and calcium through the same cation antagonism that runs the other direction, which is why a soil test — not a flat, unmeasured application — should guide the correction rate. - Q: Are some crops more susceptible to magnesium deficiency than others?
A: Yes. Tomatoes and other fruiting vegetables, tree fruit and vine crops, and soybeans are documented as particularly susceptible in the sources cited above, though susceptibility on any given field still depends on soil type and fertility history. - Q: How does soil pH affect magnesium availability?
A: Acidic soils reduce magnesium availability even when total soil magnesium tests adequate. This is why dolomitic lime — supplying both calcium and magnesium — is the standard correction on acidic, magnesium-low soils rather than a calcium-only liming product. - Q: Can organic farming methods effectively address magnesium deficiency?
A: Yes. Compost, magnesium-rich organic amendments, and crop rotation can correct and help prevent recurrence of magnesium deficiency, working through the same soil-chemistry pathway as mineral fertilizers, just on a slower release curve. - Q: Is foliar application of magnesium more effective than soil application?
A: Foliar Epsom salt gives a faster response because it bypasses root uptake entirely, which matters when symptoms appear mid-season or during drought stress. Soil application is the better choice for season-long, whole-plant correction rather than a rescue treatment. - Q: How often should I test soil for magnesium levels?
A: Annually, ideally before planting, so a declining trend is caught before it crosses the 35-50 ppm critical range (by soil type) documented by Michigan State University Extension above. - Q: Can water stress make magnesium deficiency worse?
A: Yes. Drought limits the mass flow of magnesium through the soil solution to plant roots, so deficiency can appear or intensify in dry spells even on soil that tested adequate earlier in the season. - Q: What’s the difference between magnesium deficiency and calcium-magnesium deficiency?
A: They frequently occur together because calcium and magnesium compete for the same root uptake sites; a soil test that shows both low is treated as one fertility correction (typically dolomitic lime) rather than two separate treatments. - Q: How can I access Farmonaut’s monitoring tools?
A: Through the mobile app or web platform — visit the app page to get started, or the API documentation for custom integrations.

 Gator Blueberries
 Liquify Digital
 Ascentya
 CU Foods
 BeyondTech Global
 Rouge VC
 AgroGreen Dynamics
 AgroRisk
 Oath Inc
 Reddane Farming
 Esri North East Africa
 Cresol
 Atur Kuliner
 MDCV UK
 Zerella Group
 Etech Consulting Madagascar
 Vestlandsforsking
 Delicio
 WB Dev
 Sama Premium
 Prochecker
 Tres Valles
 LACOS Geoinformation
