

Crop Yield Optimization: The Data and ROI Behind It
Reviewed August 2026 against USDA Economic Research Service (ARMS survey data), USDA National Agricultural Statistics Service, and the American Farm Bureau Federation.
Try it: Enter your numbers above. →
“Agricultural data analytics can improve crop yield predictions by up to 30% compared to traditional methods.”
Crop yield optimization means using field-level data — satellite imagery, soil sensors, weather models, and yield history — to decide what, when, and how much to plant, irrigate, and fertilize. The concrete result, per the American Farm Bureau Federation’s producer survey, is a 13% average yield increase and a 15% average cost reduction on seed, fertilizer, and pesticide spend for farms using precision technologies. This article covers what the data actually shows about adoption, cost, and payback, and where precision farming techniques fit into that picture.
Most searches for this topic land on generic explainers of what big data “can do” for farming. That’s not useful if you’re trying to decide whether to spend money on it. So this piece is built around three questions: how many farms are actually doing this, what does it cost against what it returns, and which specific technologies are driving the 13% yield gain versus which are still catching up.
Table of Contents
- How Many US Farms Actually Use Yield Optimization Tech
- The Cost/Yield Trade-Off: 15% Cheaper Inputs, 13% More Yield
- The Market Behind the Technology
- Weather-Based Farming Decisions
- Soil Moisture Management
- Where Farmonaut Fits: Satellite Data and AI Advisory
- Machine Learning: From Data to Field Decisions
- Nitrogen Management as a Cost and Yield Lever
- Calculator: Estimate Your Own Optimization Payback
- Where Data-Driven Agriculture Still Struggles
- What Changes Next in Agricultural Modeling
- FAQ
- Try it: Enter your numbers above.
How Many US Farms Actually Use Yield Optimization Tech
The clearest baseline for crop yield optimization in the United States comes from the USDA Economic Research Service’s Agricultural Resource Management Survey (ARMS), which measures precision agriculture adoption by farm size and by specific technology. As of the 2023 survey cycle:
- GPS guidance and autosteering: 70% of large-scale farms use it, versus 52% of mid-size farms.
- Yield monitors and soil maps: 68% of large-scale farms have adopted these tools.
- Overall precision agriculture adoption: 27% of all US farms, but over 50% in the leading row-crop states.
That size gap matters for anyone comparing “crop optimization services” — a 5,000-acre corn-soybean operation in Iowa is playing a different adoption game than a 300-acre diversified farm in the Northeast. The technology that moves the needle for the first (autosteering, yield monitors) is table stakes; for the second, the entry point is usually cheaper — satellite-based monitoring apps and weather-linked advisory tools that don’t require capital equipment.
| Farm Size | GPS Guidance/Autosteering | Yield Monitors/Soil Maps | Typical Entry Point |
|---|---|---|---|
| Large-scale (row crop) | 70% | 68% | Integrated equipment telematics + soil sampling grid |
| Mid-size | 52% | Not separately reported by ERS | Retrofit GPS receiver, satellite monitoring subscription |
| All US farms (national average) | 27% adopt precision ag overall | — | Free/low-cost satellite imagery, mobile advisory apps |
| Leading row-crop states | 50%+ overall adoption | — | Full-stack: guidance + monitors + variable-rate |
Source: USDA Economic Research Service. ARMS is fielded annually with full survey cycles typically reported the following calendar year, so check the ERS publication page directly for the next update before quoting these figures as current.
The evolution behind these numbers runs through three model generations, and knowing which one a “yield optimization” product is built on tells you what it can and can’t do:
- Process models: Built on biophysical principles — photosynthesis, respiration, nutrient uptake. Strong theoretical grounding, weaker on real-world edge cases, historically limited to hundreds of data points per field.
- Statistical models: Pattern-matching against historical yield and weather records. Better at capturing complex, non-linear relationships from thousands of data points, but less able to explain why a prediction came out the way it did.
- Integrated big data models: Combine both, plus satellite imagery, IoT sensor feeds, and genetic data — processing millions of data points per field per season.
| Model Type | Data Sources | Key Features | Advantages | Limitations | Data Points Analyzed |
|---|---|---|---|---|---|
| Process Models | Scientific principles, limited field data | Based on biophysical processes | Strong theoretical foundation | May oversimplify complex real-world scenarios | Hundreds |
| Statistical Models | Historical yield data, weather records | Pattern recognition, correlation analysis | Can capture complex relationships | May lack explanatory power | Thousands |
| Integrated Big Data Models | Satellite imagery, IoT sensors, genetic data, historical records | AI/ML algorithms, real-time data processing | Adapts to changing field conditions | Requires large amounts of quality data | Millions |
The Cost/Yield Trade-Off: 15% Cheaper Inputs, 13% More Yield
This is the number most searches for “crop yield optimization” and “farm yield optimization” are actually trying to find: does the spend pay back? The American Farm Bureau Federation’s producer survey put two figures on it — precision technology adopters reported averaging a 13% increase in crop yield and a 15% reduction in input costs across seed, fertilizer, and pesticide spend.
Those two figures compound. A farm cutting input costs 15% while lifting yield 13% is improving margin from both directions at once — which is a materially different claim than “yields go up” alone, and it’s the reason precision agriculture adoption keeps climbing in states where per-acre margins are thin.
What the American Farm Bureau Federation survey does not give — and what no aggregate survey can give — is the ROI for your specific farm. Farm-level ROI on precision agriculture varies by region, crop, and which technology stack you adopt, and there isn’t a published individual-farm ROI figure to substitute for your own numbers. The honest approach: run the calculator further down this page with your own acreage and current input costs, applying the 13%/15% survey averages as a starting assumption, then track your actual results against it for one full season before scaling up spend.
The Market Behind the Technology
The buildout of AI-driven precision agriculture is concentrated in North America more than the “global agtech boom” framing usually suggests. Market.us sized the North America AI-in-precision-agriculture market at $1.2 billion in 2024 — 40.7% of the entire global market for the category. That concentration is a proxy for where the vendor ecosystem, extension-service integration, and dealer support are most mature, which is useful context if you’re evaluating whether a given “crop optimization service agriculture” vendor will still be supported in your region in a few years.
Market-size figures like this move year to year with new funding rounds and category redefinitions, so treat 2024’s $1.2 billion and 40.7% share as a snapshot rather than a permanent ranking — Market.us’s report page is the place to check for the current figure before citing it elsewhere.
Weather-Based Farming Decisions
Weather is where “accuweather agriculture optimization yield protection”-style searches point, and it’s a real lever, though not a standalone one. Field-specific microclimate modeling, crop-stage-linked weather insights, and extreme-event risk management all feed the same decision loop: what to do this week, on this field, given this forecast.
- Microclimate modeling: Localized weather models built from sensor networks and satellite data, resolved down to field level rather than county level.
- Crop-specific weather insights: Weather data combined with crop growth-stage models to time planting, irrigation, and harvest decisions to what the crop actually needs at that stage, not a generic calendar.
- Risk management: Earlier and more localized warning on frost, drought, and heat-stress windows, which is where the “protection” half of yield optimization comes in — a well-timed irrigation or fungicide pass ahead of a stress event often saves more yield than any single input decision adds.
For official US crop condition and yield context to weigh against any private weather-and-yield tool’s output, USDA NASS publishes crop yield forecasts on a monthly cycle, with the August report typically the most current mid-season figure and the next forecast landing around mid-September. That’s a free, government-published check against whatever a paid platform tells you about your region’s season.

Soil Moisture Management: A Data-Driven Approach
Soil moisture is the other half of “optimize crop production” that weather forecasts alone don’t cover, because forecast rainfall and actual root-zone moisture diverge fast once soil type, slope, and prior irrigation enter the picture.
- Precision irrigation: Soil moisture sensors plus weather data feeding variable-rate irrigation controllers, applying water by zone rather than blanket-rate across a field.
- Soil moisture mapping: Remote sensing and ground sensors combined to build field-level moisture maps that flag zones running dry before the crop shows visible stress.
- Predictive soil moisture models: Historical data, current readings, and forecasts combined to project moisture levels forward several days, giving enough lead time to schedule irrigation rather than react to it.
This is also a water-conservation lever, not just a yield one — variable-rate irrigation reduces total water applied by avoiding over-watering the zones that don’t need it, which matters directly in western states facing allocation limits.
Where Farmonaut Fits: Satellite Data and AI Advisory
In the realm of digital farming solutions, Farmonaut’s role is specifically in the satellite-monitoring and advisory layer — the part of the adoption curve that doesn’t require capital equipment, which is why it’s relevant to the mid-size and smaller farms sitting below the 70%/52% autosteering adoption split covered above.
- Satellite-based crop monitoring: Multispectral satellite imagery for real-time crop health tracking, enabling earlier detection of stress before it’s visible from the ground.
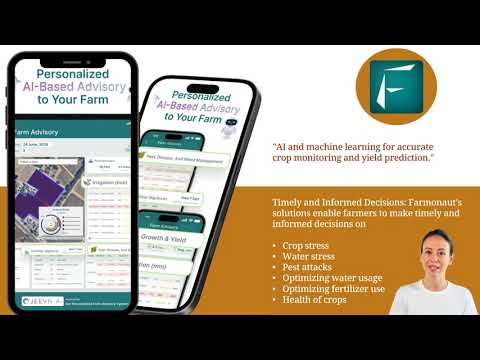
- AI-powered advisory (Jeevn AI): Recommendations built from crop conditions, weather forecasts, and historical field data.
- Resource optimization: Field-level data on crop needs to guide water, fertilizer, and other input decisions.
- Weather intelligence: Local weather integration for planting, irrigation, and risk-management timing.
Farmonaut’s digital farming tools sit alongside — not in place of — the equipment-based systems (GPS guidance, yield monitors) that dominate the large-farm adoption numbers above; the two data streams are complementary rather than competing.

Machine Learning: From Data to Field Decisions
The application of machine learning in agriculture is the analytical engine behind most modern yield-optimization platforms, whether or not the marketing copy uses the term “AI.” Four use cases account for most of what’s actually deployed on farms today:
- Crop yield prediction: Models trained on historical yield, weather, and current-season crop condition data to forecast output ahead of harvest.
- Pest and disease detection: Image-recognition models that flag infestation or disease signatures in satellite or drone imagery before symptoms are visible to the eye on the ground.
- Optimal planting strategies: Soil, weather, and historical yield data combined to recommend planting windows and crop choice by field.
- Resource allocation: Optimized water and fertilizer distribution across zones within a single field, rather than a flat farm-wide rate.
This is also the layer where the “agriculture ai yield optimization” query gets a real answer: the AI isn’t a separate product from precision agriculture, it’s the processing method underneath the adoption statistics already cited — the same GPS, yield-monitor, and satellite data streams, run through models that improve as more seasons of data accumulate.
“Machine learning algorithms in agriculture can process over 1 million data points per second for real-time farm management decisions.”
Nitrogen Management as a Cost and Yield Lever
Nitrogen sits inside both halves of the 15%-cost/13%-yield trade-off cited above, because fertilizer is one of the three input categories the American Farm Bureau Federation survey measured directly. Data-driven nitrogen management works through four mechanisms:
- Precision application: Soil data, crop health indicators, and weather combined to apply nitrogen at the rate a specific zone needs, rather than a blanket rate across the field.
- Dynamic fertilizer recommendations: Real-time adjustment of nitrogen recommendations as crop condition and weather change through the season.
- Nitrogen uptake modeling: Simulating how much nitrogen the crop is actually taking up at each growth stage, to time applications against demand rather than a fixed calendar.
- Environmental impact assessment: Tracking runoff and leaching risk so nitrogen efficiency gains also reduce off-field impact, which increasingly matters for water-quality compliance in states with nutrient-management rules.
This is a direct route into “crop yield optimization fertilizers” as a search intent: the optimization isn’t about applying more fertilizer, it’s about matching the existing spend to where and when the crop can actually use it — which is exactly the mechanism behind the reported 15% average cost reduction.
Calculator: Estimate Your Own Optimization Payback
Rather than take the 13%/15% survey averages as a promise, use them as a starting assumption against your own acreage and current spend, and see what the payback period looks like before you commit budget.
Enter your numbers above.
Assumptions: yield gain and input-cost reduction default to the American Farm Bureau Federation survey averages (13% and 15%) but are fully editable — replace them with your own season’s results once you have them. The calculator excludes financing costs on new equipment, learning-curve losses in year one, and any government cost-share payments toward precision ag adoption; it is a farm-economics estimate, not a guarantee.
Where Data-Driven Agriculture Still Struggles
The gap between "the technology exists" and "the technology is adopted" runs through several concrete friction points, not just cost:
- Data quality and consistency: Sensor types and collection methods differ across equipment vendors, which makes stitching a coherent dataset harder than the marketing implies.
- Data integration: Satellite imagery, ground sensors, and weather stations rarely share a native format, so integration work is often the actual bottleneck, not analysis.
- Real-time processing: Field decisions on irrigation timing or spray windows need same-day turnaround, which not every platform delivers.
- Privacy and security: Farm-level yield and financial data is commercially sensitive, and who owns it once it's uploaded to a third-party platform is a genuinely unresolved question across the industry.
- Digital divide: Adoption clusters around large operations and leading row-crop states, per the ERS figures above — capital and technical-support access still gate who benefits first.
- Skills gap: Interpreting model output correctly requires some data literacy that not every farm operation has in-house yet, which is part of why advisory-layer tools (rather than raw dashboards) have gained ground.

What Changes Next in Agricultural Modeling
The durable trend underneath all of the adoption and cost figures above is the shift from single-source models toward integrated ones — the "Integrated Big Data Models" row in the table earlier in this piece, processing millions rather than thousands of data points. That shift doesn't reverse; what changes year to year is which data streams get folded in next:
- Multi-scale modeling: Linking molecular-level (genomic) data with field- and ecosystem-level data in a single model.
- Real-time model adaptation: Models that update their own predictions mid-season as new sensor and weather data arrives, rather than running once at planting.
- Genomic data integration: Crop genetics folded into yield models to make variety-specific recommendations rather than generic ones.
- Climate adaptation modeling: Models built specifically to project performance under shifting precipitation and temperature patterns, not just historical averages.
The way to track this without waiting for a rewrite of this article: USDA ERS republishes its full ARMS precision-agriculture adoption breakdown annually, and USDA NASS updates crop yield forecasts monthly. Checking both against whatever adoption or ROI number a vendor quotes you is the durable habit — it works regardless of which specific technology is trending in a given season.
Innovations feeding into this next generation of models include IoT sensor networks, blockchain-based supply chain traceability, and robotics for planting, harvesting, and monitoring — each expanding the volume and immediacy of the data feeding into yield models, which is the same underlying trend as the GPS and yield-monitor adoption numbers already covered, just extended to new data types.

The Role of Data-Driven Decision Making
Across every use case above — weather, soil moisture, nitrogen, pest detection — the common structure is the same: crop selection, resource allocation, risk management, and performance tracking all move from static, calendar-based rules to continuously updated, data-driven decisions. That shift is what separates a farm running at the 27% national precision-ag adoption baseline from one running in the 50%+ adoption states — not access to fundamentally different technology, but a more complete data loop feeding every decision.
Big data's effect on climate-resilient agriculture research follows the same pattern at the science level: accelerated crop breeding through faster trait identification, ecosystem modeling built on more complete field datasets, and precision phenotyping through imaging and sensor data at scale. None of that changes the core arithmetic covered in this article — yield gain against input-cost reduction — it just extends the same data pipeline further upstream into variety development.
FAQ Section
Q: What does crop yield optimization actually mean in practice?
A: It means using field-level data — satellite imagery, soil sensors, weather models, yield history — to make specific decisions about planting, irrigation, fertilization, and pest control, rather than applying a flat, calendar-based approach across a whole field. The American Farm Bureau Federation's producer survey ties this to a measured 13% average yield increase and 15% average input cost reduction.
Q: How many US farms use precision agriculture for yield optimization?
A: Per USDA ERS's 2023 ARMS data, 27% of all US farms have adopted precision agriculture, rising to over 50% in leading row-crop states. Adoption of specific tools like GPS guidance runs higher — 70% among large-scale farms versus 52% among mid-size farms.
Q: Does crop yield optimization technology pay for itself?
A: Survey-level data says yes on average — 13% yield increase and 15% input cost reduction, per the American Farm Bureau Federation. Individual farm ROI isn't separately published and depends on your acreage, current input spend, and platform cost; use the calculator on this page with your own figures rather than relying on the survey average alone.
Q: What's the difference between "crop yield optimization" and "agriculture AI yield optimization"?
A: They describe the same underlying activity. The AI/machine-learning layer is the processing method behind most current platforms — used for yield prediction, pest detection, and resource allocation — running on top of the same GPS, sensor, and satellite data streams counted in USDA's precision agriculture adoption statistics.
Q: How does Farmonaut fit into crop yield optimization?
A: Farmonaut provides satellite-based crop monitoring and an AI-powered advisory system (Jeevn AI) that gives field-specific recommendations from crop condition, weather, and historical data — positioned at the lower-capital end of the adoption curve, alongside (not replacing) equipment-based systems like GPS autosteering and yield monitors.
Q: Where can I get current, official crop yield data instead of a vendor's estimate?
A: USDA NASS publishes monthly crop yield forecasts for major US crops, and USDA ERS republishes its precision agriculture adoption survey (ARMS) annually. Both are free and are the reference points used throughout this article.
Explore Farmonaut's Digital Farming Solutions
Ready to apply data-driven crop yield optimization on your own fields? Explore Farmonaut's suite of digital farming solutions:



For developers integrating Farmonaut's agricultural data into other applications, see the API and API Developer Docs.
Farmonaut Subscriptions
Discussion
Questions, corrections or field experience? Share them below. First-time comments are reviewed before they appear, and your email is never published.
No comments yet. Be the first to add a question or your experience.

 Mostas Tech
 AgroStar
 Native Seeds
 Andex
Andex FCF India
 Unifrutti Gulf
 Deluxe Conseil
 TVS Electronics
 BW Pipelines
 WICO
WICO Chimera Innovation
 SkyHarvest
 Polaris Digitech
 Teledarbas
 Licence holder · Niger · Gold










