

Reviewed August 2026 against USDA Economic Research Service (ERS) adoption and farm-income data and the USDA NASS Census of Agriculture.
Try it: Digital farming break-even threshold →
How to Adopt Digital Farming Practices: A Costed Roadmap
Adopt digital farming in the order the economics dictate, not the order vendors sell it: automated guidance first, then yield and soil mapping, then variable-rate application, then whole-farm analytics. That sequence mirrors what U.S. farms have actually done — USDA ERS found automated guidance now runs on well over 50 percent of the acreage planted to corn, cotton, rice, sorghum, soybeans and winter wheat, while variable-rate technology sits far lower on most of those same crops. The gap between those two numbers is the single most useful fact in this article, and the rest of it explains why the gap exists and where your operation falls in it.
This page gives you the U.S. adoption rates with their survey vintages, the measured profit effects (which are smaller than most marketing claims), a break-even calculator you drive with your own acreage, and a verification method that still works after every figure below has been superseded.
Table of Contents
- What Digital Farming Actually Means (and How It Differs From Precision Ag)
- What U.S. Farms Have Actually Adopted
- The Measured Profit Effect — and Why It’s Smaller Than You Expect
- The 7-Step Adoption Sequence
- Break-Even Acres Calculator
- Technology-by-Technology Comparison Table
- Precision Ag Best Practices That Survive Contact With a Farm Team
- Why Ease of Use Beats Feature Count
- Precision Dairy Farming: The Clearest Payback in the Data
- Where Agronomy Fits
- How to Verify Every Number Here Yourself
- Farmonaut’s Digital Farming Platform
- Frequently Asked Questions
- Try it: Digital farming break-even threshold
What Digital Farming Actually Means (and How It Differs From Precision Ag)
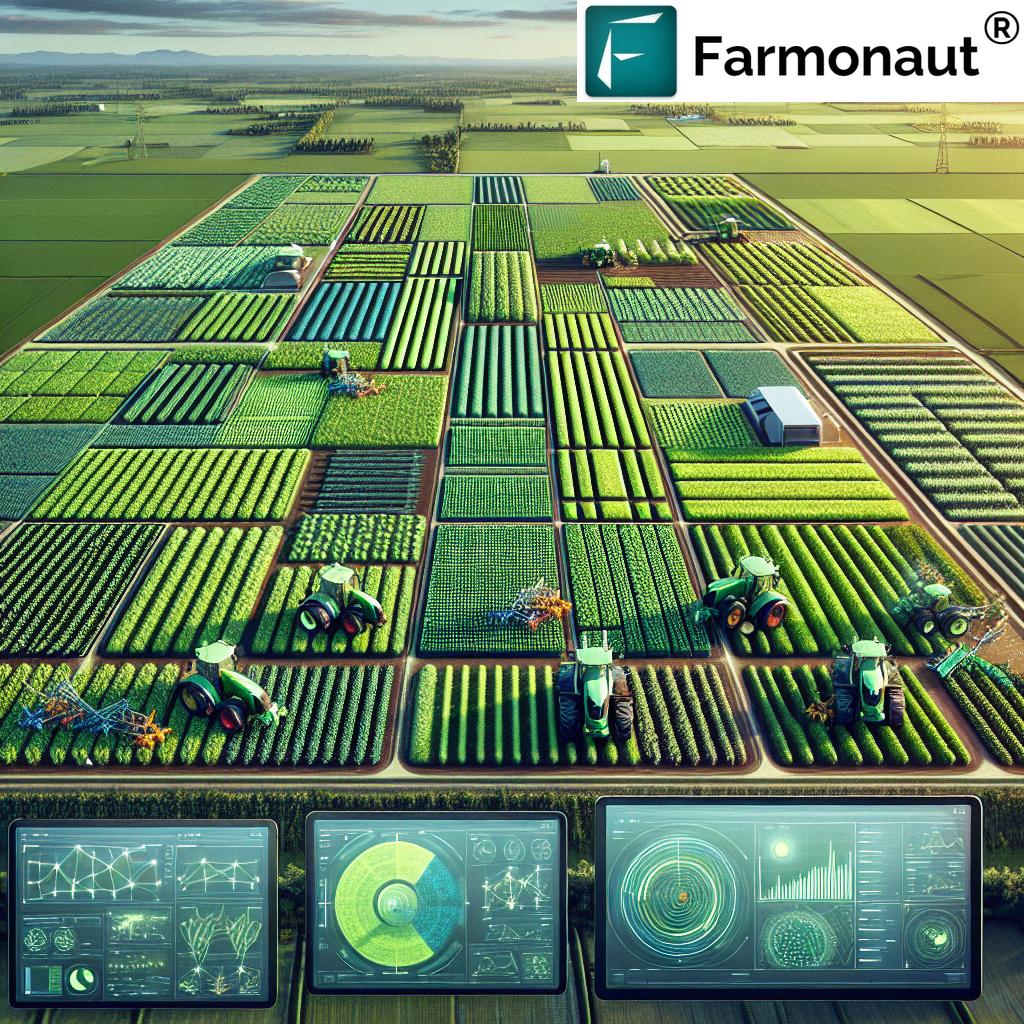
Precision agriculture is the narrower term: applying inputs at variable rates across a field based on measured spatial variability. Digital farming — or digital agriculture — is the wider system that includes precision application but also covers record-keeping, satellite and aerial monitoring, weather integration, traceability, machinery telematics and financial analytics. You can practise precision agriculture with a rate controller and a prescription map and no software subscription at all. Digital farming implies the data actually flows somewhere and informs a decision beyond the sprayer boom.
The distinction matters for adoption because the two have very different cost structures. Precision hardware is a capital purchase amortised over machinery life. Digital platforms are recurring operating costs. A farm can be deep into precision agriculture and barely digital — plenty of operations run RTK autosteer and section control while keeping records in a notebook. Understanding how smart agriculture technologies stack together helps you decide which half of the problem you are solving first.
What U.S. Farms Have Actually Adopted
USDA ERS report EIB-248, Precision Agriculture in the Digital Era: Recent Adoption on U.S. Farms (McFadden, Njuki and Griffin, published 22 February 2023), tracks adoption from 1996 through 2019 using USDA’s Agricultural Resource Management Survey (ARMS). It reports variable-rate technology on 37.4 percent of planted corn acres in 2016, up from 11.5 percent in 2005; 25.3 percent of soybean acres in 2018; 22.7 percent of cotton acres in 2019, up from 5.4 percent in 2007; 18.8 percent of winter wheat acres in 2017; and 13.9 percent of sorghum acres in 2019. Each figure carries a different survey year because ARMS rotates its crop-specific modules — that is a feature of the data, not sloppiness, and it means you should never compare two crops as if they were measured in the same season.
Set against that, guidance is close to standard equipment. ERS reports guidance systems on over 50 percent of U.S. corn and soybean acres, and among the largest corn farms guidance adoption reached 73 percent in 2016. The trajectory tells you more than any single year: corn VRT roughly tripled between 2005 and 2016, and cotton VRT quadrupled between 2007 and 2019.
Farm size is the strongest single predictor. A USDA ERS Charts of Note release on precision agriculture use by farm size puts guidance autosteering at 70 percent of large-scale crop farms and 52 percent of midsize farms, with yield monitors, yield maps and soil maps at 68 percent of large-scale crop-producing farms. ERS classifies small family farms as those under $350,000 in gross cash farm income; those operations show the lowest rates in every technology category.

The Measured Profit Effect — and Why It’s Smaller Than You Expect
This is where most digital farming content misleads. USDA ERS’s Amber Waves analysis, Precision Agriculture Technologies and Factors Affecting Their Adoption (published 5 December 2016), measured the profit impact on corn farms in 2010 at between 1 and 3 percent: VRT added roughly 1 percent, GPS-based yield and soil maps close to 3 percent. Those are real, repeatable, peer-reviewed gains — and they are one to two orders of magnitude below the “double your yield” claims that circulate in vendor material.
A 1–3 percent margin improvement is still worth having. On a farm business earning the $135,000 average net cash farm income USDA ERS forecasts for 2026 — an 18.7 percent nominal rise from 2025, per the agency’s Farm Income Forecast highlights — a 2 percent improvement is a few thousand dollars a year. Whether that clears the cost of the technology depends entirely on how many acres it spreads across, which is the whole point of the calculator below.
USDA’s Agricultural Research Service, in its overview of the benefits and evolution of precision agriculture, notes that tractor guidance systems can cut fertilizer overlaps and gaps by up to 20 percent and can be profitable even on small farms. Note the mechanism: the saving comes from eliminating double-application on headlands and point rows, not from a mysterious agronomic uplift. That is why guidance pays first and pays most reliably.
The 7-Step Adoption Sequence
This ordering is built to front-load the technologies with the most reliable measured returns and the lowest training burden, and to defer the ones that need clean historical data before they work at all.
- Audit what you already own. Most operations bought guidance-capable equipment without switching on the data layer. Pull the model numbers on every tractor, planter, sprayer and combine and establish which already have rate control, section control or yield monitoring available. The cheapest adoption step is activating hardware you already paid for.
- Fix the boundary and field-record layer first. Accurate field boundaries, consistent field naming and one system of record. Every prescription map, satellite subscription and compliance report downstream depends on this. It costs nothing but a weekend and it is the step operations most often skip, then spend two seasons regretting.
- Deploy guidance and section control. Highest measured return per dollar (the ARS overlap-reduction mechanism above), lowest training burden, immediate operator buy-in because it reduces fatigue. ERS lists reduced operator fatigue among the most frequently cited adoption reasons alongside increasing yields and saving labour time.
- Start collecting yield and soil data before you act on it. Yield maps and soil maps carried the strongest measured profit effect in the ERS corn analysis, but they need multiple seasons of clean data to be worth anything. Calibrate the yield monitor properly every harvest — an uncalibrated monitor generates confident, wrong maps.
- Add satellite monitoring across the whole farm. This is the one layer that scales without per-acre hardware. Multispectral imagery gives you in-season crop vigour and moisture variation on every field simultaneously, including rented ground you visit rarely. Farmonaut’s satellite crop monitoring delivers vegetation and moisture indices on a subscription basis, which keeps it an operating cost rather than a capital one.
- Introduce variable-rate application on your most variable fields only. Do not go farm-wide. Pick the two or three fields with the widest known yield spread and prove the prescription there. On uniform ground, VRT’s ~1 percent measured effect will not clear its cost.
- Layer compliance and traceability once the core works. Carbon footprint tracking and blockchain traceability matter when a buyer contract or a sustainability programme requires them. They rarely pay on their own; they pay by unlocking a market.
If you want the agronomic groundwork underneath this sequence, our guide to the essential steps in farming for crop yield covers the practices the digital layer measures.
Break-Even Acres Calculator
Enter your own numbers — the ERS profit range of 1–3 percent is a reasonable starting point for the margin uplift field, but nothing here is hard-coded to your situation.
Digital farming break-even threshold
Assumptions: benefits are treated as annual and steady; technology cost is whatever you enter, so amortise hardware yourself over its expected life. Excludes installation, training time, machinery trade-in effects, financing interest, tax treatment and any yield change from improved timing. Break-even acres assume your per-acre benefit stays constant as area grows, which flatters very large expansions.
Technology-by-Technology Comparison Table
| Technology | U.S. adoption (with vintage) | What it actually replaces | Where it stops paying | How to verify for your state |
|---|---|---|---|---|
| Automated guidance / autosteer | 70% of large-scale, 52% of midsize crop farms; >50% of corn and soybean acres (ERS, ARMS) | Operator concentration on overlap and skip | Small, irregular fields where turning dominates travel | ERS Charts of Note, precision ag by farm size |
| Yield monitors, yield & soil maps | 68% of large-scale crop-producing farms (ERS) | Recall and rules of thumb about field variability | First two seasons — data has no baseline yet | ERS EIB-248, crop-specific tables |
| Variable-rate technology | Corn 37.4% (2016); soybeans 25.3% (2018); cotton 22.7% (2019); winter wheat 18.8% (2017); sorghum 13.9% (2019) | Single flat rate across a whole field | Uniform soils — measured corn profit effect was ~1% | ERS VRT adoption series |
| Satellite crop monitoring | Not separately reported in ARMS; 79% of U.S. farms had internet access in 2022 vs 75% in 2017 (NASS Census) | Windshield scouting of distant or rented ground | Persistent cloud cover regions without radar fallback | NASS Quick Stats, internet access series |
| Drones / UAV imagery | Aerial imagery covered in ERS EIB-248 across six crops | Walking a field for stand counts and damage assessment | Large acreage — flight time does not scale | ERS EIB-248 aerial imagery tables |
| Robotic milking (precision dairy) | 6% of U.S. milk in 2021, up from 4% in 2016; 13% of farms with 150–499 head (ERS) | Scheduled parlour labour | Very small herds on unpaid family labour; very large herds with existing low labour cost | ERS ERR-356 |

Precision Ag Best Practices That Survive Contact With a Farm Team
These are the practices that separate operations where the technology sticks from operations where a $20,000 display becomes an expensive lightbar.
- Calibrate before every harvest, not once. Yield monitor calibration drifts with moisture, crop and header. Uncalibrated data corrupts every prescription built on it.
- Keep one system of record. Two half-populated platforms are worse than one. Pick where boundaries and as-applied records live and export from there.
- Leave check strips. Run a flat-rate strip through every variable-rate field. Without it you cannot separate the technology's effect from the season's.
- Match correction accuracy to the job. RTK-level accuracy earns its subscription on planting, strip-till and controlled traffic. For broadcast spreading it is often over-specification.
- Assign one named data owner. Not a committee. One person responsible for exports, boundary hygiene and season-end archiving.
- Budget the recurring cost separately from the hardware. Correction services and platform subscriptions are the line item that quietly kills adoption in year three.
- Test on rented ground you can walk away from before committing on owned acres you cannot.
For an implementation view of how sensing and aerial platforms combine in the field, see our breakdown of how IoT and drones drive precision farming, and for controlled-environment operations, vertical farming lighting approaches in the USA.
Why Ease of Use Beats Feature Count
ERS's adoption analysis identified two characteristics that predict whether a technology gets taken up: ease of use and functionality. GPS guidance scores high on ease of use. Yield and soil maps score high on functionality. VRT scores low on both — and VRT has the lowest adoption of the three. That is the clearest available evidence that farm teams adopt what is easy to operate, not what has the longest feature list.
Applied to platform selection, three practical tests follow. First, can a seasonal operator complete the core task on day one without a manual? Second, does the platform work on the device the team already carries — the ERS pattern of connectivity-dependent adoption matters here, and NASS's 2022 Census found 79 percent of U.S. farms had internet access, meaning roughly one in five did not. Third, does it degrade gracefully offline and sync later, or does it simply fail in a field with no signal?
Multi-site operations have an additional requirement: role separation, so an agronomist, a machinery operator and an office manager each see a different view of the same record. Farmonaut's large-scale farm management module handles multi-farm and plantation structures on that basis, and fleet management extends the same account to machinery movement. Teams that outgrow the interface can drop to the satellite API and developer documentation to push data into whatever system they already run.
Precision Dairy Farming: The Clearest Payback in the Data
Dairy has the strongest quantified return of any digital farming segment USDA has measured. ERS report ERR-356, Precision Dairy Farming, Robotic Milking, and Profitability in the United States (McFadden and Raff, published 22 January 2026), found that robotic milking — or using two or more precision technologies from the broader set studied — raises dairy net returns by 13 percent on average. In per-unit terms, ERS reports robotic milking increased net returns by $3.15 per hundredweight, and multi-technology adoption by $3.18 per cwt, relative to non-adopters.
Adoption is concentrated in the middle of the herd-size distribution. ERS's robotic milking adoption chart shows 13 percent of dairy farms with 150–499 head used robotic milking in 2021, the highest of any size class — smaller farms lean on unpaid family labour that robots do not displace in cash terms, and the largest operations already run low labour cost per cow.
ERS's companion chart on precision dairy technologies and profitability controls for farm and operator characteristics, which is why these estimates are more trustworthy than raw adopter-versus-non-adopter comparisons.
Where Agronomy Fits
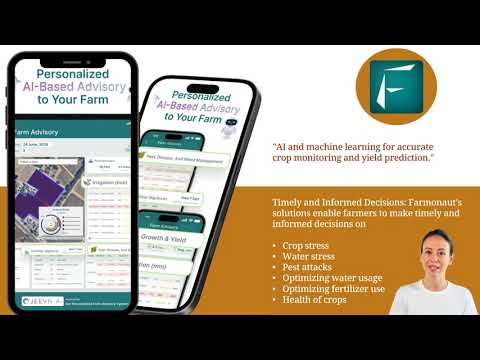
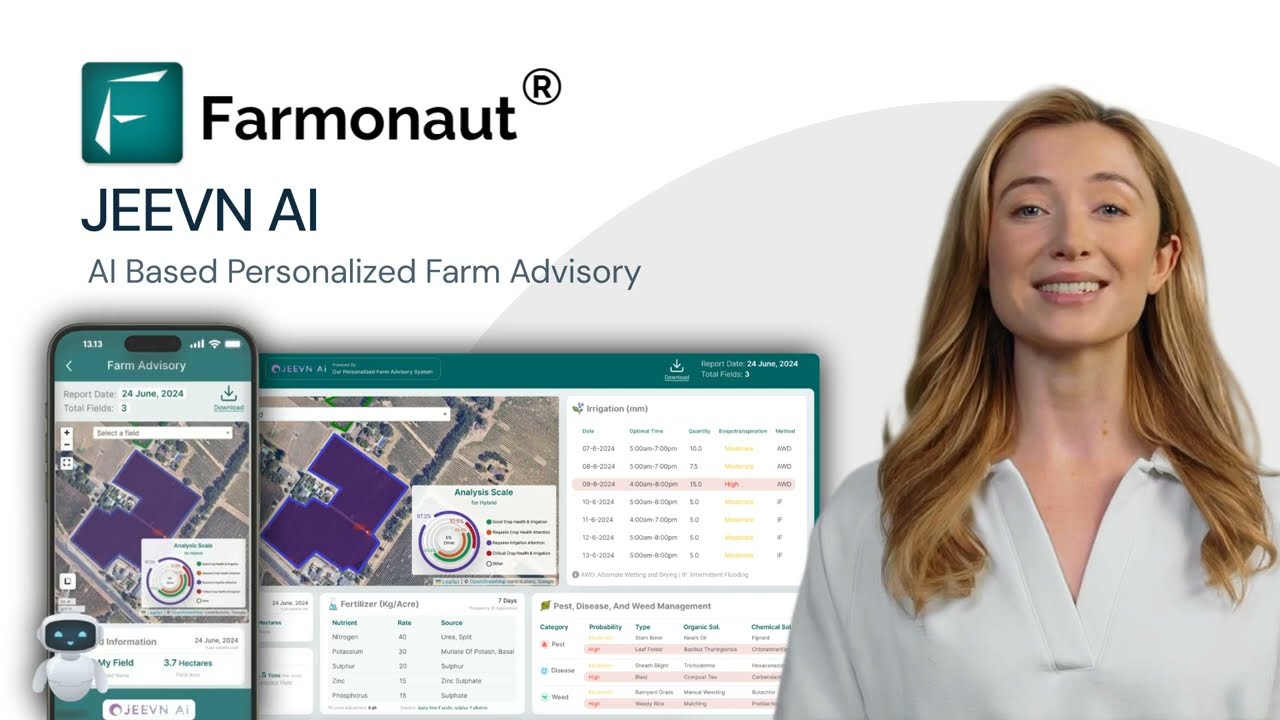
Digital tools measure; agronomy decides. A vegetation index tells you a zone is underperforming — it does not tell you whether the cause is nitrogen, compaction, drainage or disease, and applying the wrong correction at variable rate simply makes the wrong decision faster and more precisely. The practical implication is that the agronomic diagnosis has to precede the prescription. Operations that hire or contract agronomic capability alongside the software consistently get more from both. Jeevn AI advisory within Farmonaut combines field data with weather forecasts to narrow the diagnostic candidates, but the ground-truth check — a soil test, a tissue sample, a spade in the zone — remains the step that converts an anomaly into an action.

How to Verify Every Number Here Yourself
Every adoption figure above comes from USDA's Agricultural Resource Management Survey, which rotates commodity modules year to year — so the "current" number for your crop is whichever survey year USDA last covered it. This is the durable part of this article: the method outlives the figures.
- For adoption rates: search USDA ERS Charts of Note and publications for the technology and crop. EIB-248 is the base reference; ERS issues updated charts as new ARMS cycles complete.
- For structural data — farm counts, acreage, internet access, precision agriculture practices — use NASS Quick Stats, which serves Census of Agriculture and survey data down to county level and covers 1870 through the present cycle. The Census runs on a five-year cycle; the 2022 Census results released 13 February 2024 reported 1.9 million U.S. farms on 880 million acres, an average farm size of 463 acres and an average producer age of 58.1 years.
- For the economics: the ERS Farm Income Forecast is revised several times a year. It listed fertiliser expenditure at $35.8 billion for 2026, about $523 million below 2025, and net farm income at $153.4 billion.
- For your own break-even: get written quotes including the correction-signal subscription and the platform renewal, then run the calculator above with your actual acreage.
Farmonaut's Digital Farming Platform
Farmonaut supplies the satellite and analytics layer of the sequence above — steps four through seven — without requiring machinery replacement: multispectral crop health and soil moisture monitoring, Jeevn AI advisory, blockchain traceability, carbon footprint tracking, fleet tools, and satellite-verified crop loan and insurance reporting for lenders and insurers. Subscriptions scale with area monitored and update frequency, on Android, iOS, web and API.



Frequently Asked Questions
-
What is the single best first step to adopt digital farming?
Activating guidance and section control on equipment you already own. It has the highest measured return per dollar, needs the least training, and USDA ARS attributes fertiliser overlap and gap reductions of up to 20 percent to tractor guidance systems.
-
How much does precision agriculture actually improve profit?
USDA ERS measured 1 to 3 percent on corn farms in 2010 — around 1 percent from VRT and close to 3 percent from GPS yield and soil maps. Treat any claim above that range as needing evidence.
-
How can precision farming technology be implemented effectively?
Sequence it. Fix field boundaries and records first, deploy guidance, collect yield and soil data for at least two seasons before acting on it, add satellite monitoring for whole-farm coverage, then apply VRT only to demonstrably variable fields. Leave check strips so you can measure the effect.
-
Is digital farming worth it on a smaller farm?
It depends on break-even acres, not farm size labels. USDA ARS notes guidance can be profitable even for small-scale producers because overlap savings are proportional to area worked. Run the calculator above with your quoted annual cost.
-
Why do adoption rates differ so much between technologies?
ERS attributes it to ease of use and functionality. Guidance is easy to use, mapping is highly functional, and VRT rates low on both — which matches its lower adoption across every crop USDA surveys.
-
Can I integrate my existing sensors and software?
Yes — via the Farmonaut API and developer docs, which let you pull satellite and weather layers into an existing farm management system rather than replacing it.
The durable test: before any digital farming purchase, write down the annual cost including subscriptions, the acres it covers, and the per-acre benefit you expect. If the break-even area exceeds your farmed area, the answer is custom hire, a shared purchase, or waiting — regardless of what the technology can do.

 JJM Farms
 WeMe Global
 Pixxel
 Agrotoken
 Blue BearX
 Insignito
 Croptimum
 DnCubed
 Field Capacity
 Indosistim Teknologi
 Liquify Digital
 CU Foods
 BeyondTech Global
 Rouge VC
 AgroGreen Dynamics
 AgroRisk
 Oath Inc
 Reddane Farming
 Esri North East Africa
