
Revolutionizing Agriculture: How Satellite Imagery API Enhances Precision Farming and Crop Health Monitoring
“Farmonaut’s Satellite Imagery API offers access to at least 3 vegetation indices: NDVI, EVI, and NDWI.”
In the ever-evolving landscape of modern agriculture, satellite imagery for agriculture has emerged as a game-changing tool, revolutionizing the way we approach farming and crop management. At the forefront of this technological revolution is Farmonaut’s innovative Agromonitoring Satellite Imagery API, a cutting-edge solution that’s transforming precision farming technologies and empowering farmers with unprecedented insights into their crops and land.
As we delve into the world of agricultural remote sensing and its applications, we’ll explore how Farmonaut’s API is setting new standards in crop health monitoring and sustainable farming practices. From providing access to crucial vegetation indices to offering comprehensive data analysis tools, this agritech solution is equipping agricultural professionals with the information they need to make informed decisions and optimize their farming strategies.

The Power of Satellite Imagery in Agriculture
Satellite imagery has revolutionized the agricultural sector by providing farmers and agronomists with a bird’s-eye view of their fields. This technology allows for the collection of vast amounts of data over large areas, offering insights that were previously impossible to obtain through traditional on-ground methods.
- Wide-area coverage: Satellites can capture images of entire farms or regions in a single pass, enabling comprehensive analysis.
- Frequent updates: Regular satellite passes provide up-to-date information on crop conditions, allowing for timely interventions.
- Non-invasive monitoring: Satellite imagery doesn’t require physical presence in the fields, reducing disturbance to crops and soil.
- Historical data: Archives of satellite images enable long-term trend analysis and year-over-year comparisons.
With these capabilities, satellite imagery has become an indispensable tool in precision farming, enabling data-driven decision-making and more efficient resource management.
Introducing Farmonaut’s Agromonitoring Satellite Imagery API
Farmonaut’s Agromonitoring Satellite Imagery API is a comprehensive solution designed to harness the full potential of satellite data for agricultural applications. This powerful tool provides users with access to a wealth of information, including various vegetation indices, true and false color images, and customizable search parameters.
Key features of the API include:
- Access to multiple vegetation indices (NDVI, EVI, NDWI, etc.)
- True and false color image retrieval
- Customizable polygon-based searches
- Data output in various formats (PNG, GeoTIFF)
- Drought monitoring capabilities
- Crop yield prediction tools
- Zonal statistics for in-depth analysis
By integrating these features, Farmonaut’s API empowers users to gain deep insights into their agricultural operations, enabling more precise and efficient farming practices.
Explore Farmonaut’s Agromonitoring Satellite Imagery API
Understanding Vegetation Indices
Vegetation indices are mathematical combinations of different spectral bands captured by satellites. These indices provide valuable information about vegetation health, density, and other characteristics. Farmonaut’s API offers access to several key vegetation indices, each serving a specific purpose in crop health monitoring.
| Index Name | Purpose/Application | Ideal Crop Types | Interpretation Range | Benefits for Precision Farming |
|---|---|---|---|---|
| NDVI (Normalized Difference Vegetation Index) | General vegetation health and density | Most crops | -1 to 1 (Higher values indicate healthier vegetation) | Identify areas of stress, monitor crop growth stages |
| EVI (Enhanced Vegetation Index) | Improved sensitivity in high biomass regions | Dense canopy crops (e.g., forests, mature corn) | -1 to 1 (Less susceptible to saturation than NDVI) | Better performance in areas with high leaf area index |
| NDWI (Normalized Difference Water Index) | Water content in vegetation and soil moisture | Water-sensitive crops (e.g., rice, cotton) | -1 to 1 (Higher values indicate more water content) | Optimize irrigation, detect drought stress |
| EVI2 (Two-band Enhanced Vegetation Index) | Vegetation monitoring without blue band | Suitable for most crops | Similar to EVI | Useful when blue band data is unavailable or unreliable |
By leveraging these indices, farmers and agronomists can gain a comprehensive understanding of their crops’ health and make data-driven decisions to optimize yield and resource use.
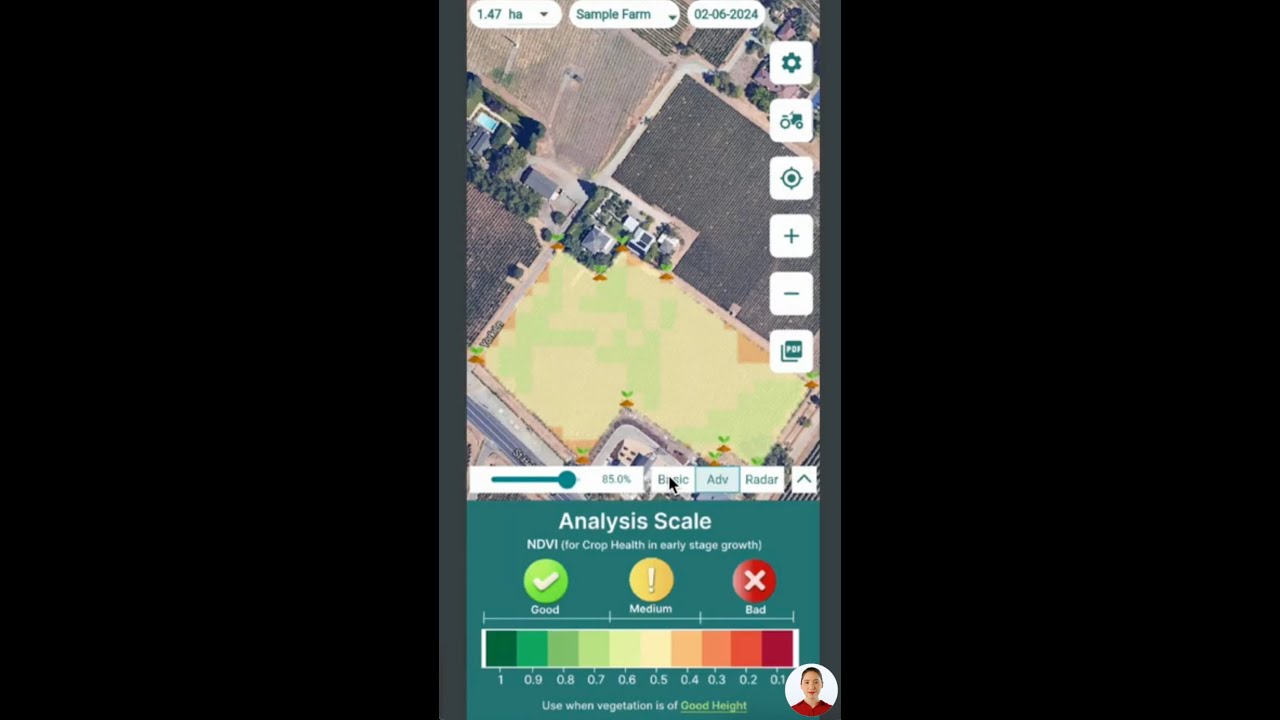
NDVI for Crop Health Monitoring
The Normalized Difference Vegetation Index (NDVI) is one of the most widely used vegetation indices in agriculture. It provides valuable insights into crop health, growth stages, and potential stress factors.
How NDVI works:
- NDVI measures the difference between near-infrared (NIR) and red light reflection by vegetation.
- Healthy plants reflect more NIR and absorb more red light, resulting in higher NDVI values.
- NDVI values range from -1 to 1, with higher values indicating healthier vegetation.
Applications of NDVI in agriculture:
- Early detection of crop stress
- Monitoring crop growth stages
- Identifying variations in field productivity
- Guiding fertilizer and irrigation management
- Estimating crop yields
By integrating NDVI data from Farmonaut’s API into their farming practices, agricultural professionals can make more informed decisions about crop management, leading to improved yields and resource efficiency.

Leveraging True and False Color Images
Farmonaut’s API provides access to both true color and false color satellite images, each offering unique benefits for agricultural analysis:
True Color Images
True color images represent the Earth as it would appear to the human eye from space. These images are valuable for:
- Visual inspection of crop conditions
- Identifying physical features like roads, buildings, and water bodies
- Monitoring changes in land use over time
False Color Images
False color images use non-visible spectral bands to highlight specific features of interest. In agriculture, common false color combinations include:
- Near-Infrared (NIR) false color: Emphasizes vegetation health and density
- Short-Wave Infrared (SWIR) false color: Highlights soil moisture and mineral content
These false color images enable farmers and agronomists to:
- Quickly identify areas of stress or poor crop health
- Assess soil moisture levels across large areas
- Detect early signs of disease or pest infestations
By combining true and false color imagery, users of Farmonaut’s API can gain a comprehensive understanding of their agricultural landscapes and make more informed management decisions.
“Satellite imagery in agriculture provides data in multiple formats, including PNG and GeoTIFF, for comprehensive analysis.”
Customizable Search and Analysis Tools
One of the key strengths of Farmonaut’s Agromonitoring Satellite Imagery API is its flexibility in data retrieval and analysis. Users can customize their searches and analyses in several ways:
Polygon-based Searches
The API allows users to define specific areas of interest using polygons. This feature enables:
- Precise monitoring of individual fields or parcels
- Analysis of irregular-shaped areas
- Comparison of different zones within a larger agricultural area
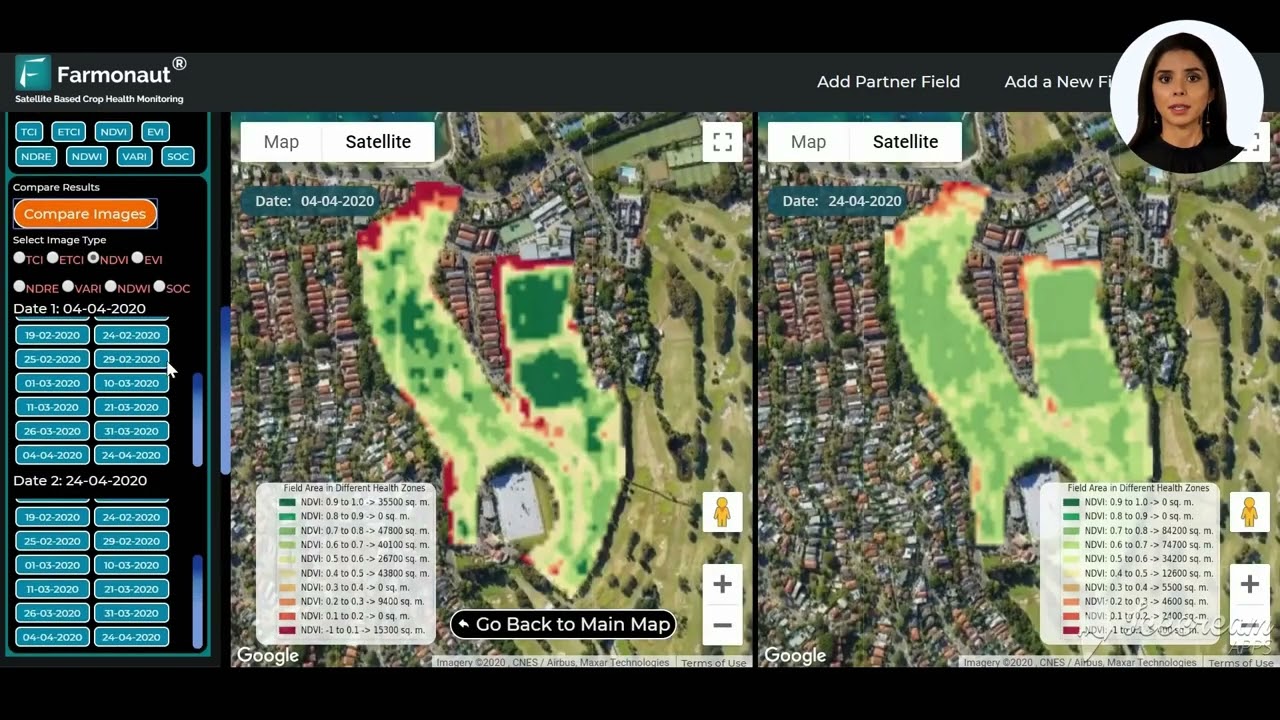
Temporal Analysis
Users can specify date ranges for their searches, facilitating:
- Tracking of crop development over time
- Comparison of current conditions with historical data
- Identification of long-term trends in field productivity
Customizable Output Formats
The API provides data in various formats to suit different analysis needs:
- PNG: Ideal for quick visual inspections and easy sharing
- GeoTIFF: Supports detailed spatial analysis in GIS software
These customizable features allow agricultural professionals to tailor their use of satellite data to their specific needs and workflows, enhancing the efficiency and effectiveness of their precision farming practices.
Advanced Features for Precision Agriculture
Farmonaut’s API goes beyond basic satellite imagery analysis, offering advanced features that further enhance precision farming capabilities:
Drought Monitoring
The API includes tools for assessing and monitoring drought conditions, enabling farmers to:
- Identify areas at risk of water stress
- Optimize irrigation strategies
- Plan for potential drought impacts on crop yields
Crop Yield Prediction
By analyzing historical data and current crop conditions, the API provides crop yield prediction capabilities, allowing users to:
- Estimate potential yields early in the growing season
- Adjust management practices to maximize productivity
- Plan for harvesting and marketing activities
Zonal Statistics
This feature allows users to calculate statistical measures for defined areas, providing insights such as:
- Average NDVI values for specific fields
- Variability in crop health within management zones
- Comparison of productivity across different parcels
These advanced features transform raw satellite data into actionable insights, enabling farmers and agronomists to make data-driven decisions that optimize crop production and resource use.
Explore Farmonaut’s API Developer Documentation
Integrating Satellite Data with Other Agricultural Technologies
The true power of satellite imagery in agriculture is realized when it’s integrated with other precision farming technologies. Farmonaut’s API facilitates this integration, enabling a holistic approach to farm management:
GIS in Agriculture
Geographic Information Systems (GIS) play a crucial role in modern agriculture. By combining satellite imagery with GIS tools, farmers can:
- Create detailed maps of their fields
- Analyze spatial patterns in crop health and productivity
- Plan and implement site-specific management strategies
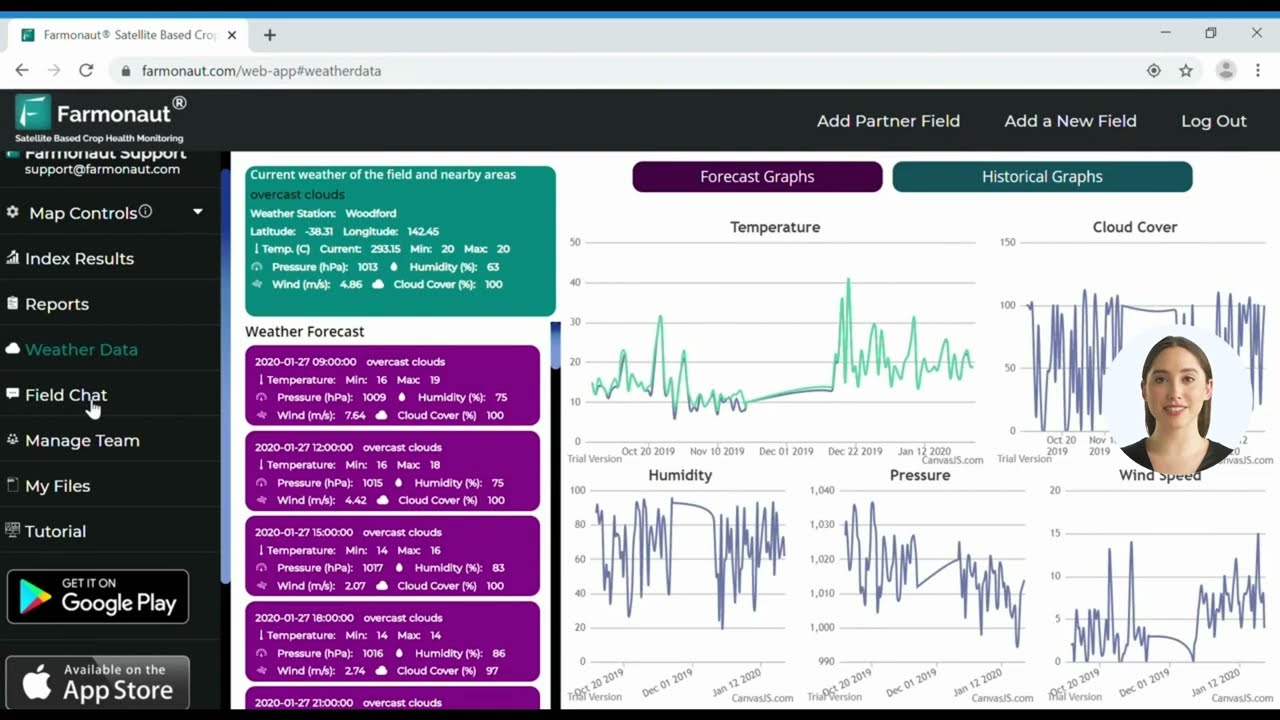
IoT Sensors and Weather Data
Integrating satellite data with ground-based sensors and weather information provides a more comprehensive view of farm conditions:
- Correlate satellite observations with on-ground measurements
- Enhance weather forecasting and climate modeling for specific fields
- Improve the accuracy of crop growth models and yield predictions
Farm Management Software
By incorporating satellite data into farm management software, agricultural professionals can:
- Centralize all farm data for easier analysis and decision-making
- Generate automated alerts based on satellite-detected changes in crop conditions
- Create detailed reports and visualizations to guide farm operations
This integration of technologies creates a powerful ecosystem for precision agriculture, enabling farmers to make more informed decisions and optimize their operations like never before.
The Future of Satellite Imagery in Agriculture
As technology continues to advance, the role of satellite imagery in agriculture is set to expand even further. Some exciting developments on the horizon include:
- Higher resolution imagery: Improved satellite sensors will provide even more detailed views of crops and fields.
- Increased revisit frequency: More satellites in orbit will enable daily or even multiple daily observations of agricultural areas.
- Advanced AI and machine learning: These technologies will enhance the interpretation of satellite data, providing even more accurate and actionable insights.
- Integration with autonomous farming systems: Satellite data could directly inform the operations of self-driving tractors and other automated farm equipment.
As these technologies evolve, Farmonaut remains committed to staying at the forefront of agricultural innovation, continually updating and improving its Agromonitoring Satellite Imagery API to meet the changing needs of farmers and agricultural professionals.
Conclusion: Embracing the Satellite-Powered Agricultural Revolution
The integration of satellite imagery into agriculture through tools like Farmonaut’s Agromonitoring Satellite Imagery API represents a significant leap forward in precision farming technologies. By providing farmers and agronomists with unprecedented access to detailed, timely, and actionable data about their crops and fields, these agritech solutions are revolutionizing the way we approach agriculture.
From enhancing crop health monitoring to optimizing resource use and predicting yields, satellite imagery is proving to be an indispensable tool in the quest for more sustainable and productive farming practices. As we face the challenges of feeding a growing global population in an era of climate change, the insights provided by satellite technology will play a crucial role in shaping the future of agriculture.
By embracing these innovative solutions and integrating them into their daily operations, farmers and agricultural professionals can position themselves at the forefront of this technological revolution, driving improvements in productivity, sustainability, and profitability across the agricultural sector.
FAQ Section
Q: What is Farmonaut’s Agromonitoring Satellite Imagery API?
A: It’s a powerful tool that provides access to satellite imagery and various vegetation indices for agricultural applications, enabling precision farming and crop health monitoring.
Q: What types of data can I access through the API?
A: The API offers access to vegetation indices like NDVI, EVI, and NDWI, as well as true and false color images, drought monitoring data, and crop yield predictions.
Q: How can satellite imagery benefit my farming operations?
A: Satellite imagery can help you monitor crop health, optimize resource use, detect issues early, predict yields, and make more informed management decisions.
Q: Is the API suitable for small-scale farmers?
A: Yes, the API is designed to be scalable and can benefit farmers of all sizes, from small family farms to large agricultural operations.
Q: How often is the satellite data updated?
A: The frequency of updates depends on the satellite sources used, but typically ranges from daily to weekly updates.
Q: Can I integrate the API with my existing farm management software?
A: Yes, the API is designed to be easily integrated with various farm management systems and GIS software.
Q: How accurate are the crop yield predictions?
A: Yield predictions are based on historical data and current conditions, and while they provide valuable estimates, actual yields may vary due to unforeseen factors.
Q: Is training provided on how to interpret the satellite data?
A: Yes, Farmonaut provides documentation and resources to help users interpret and utilize the satellite data effectively.
Q: Can the API help with irrigation management?
A: Absolutely. The NDWI index and drought monitoring features can provide valuable insights for optimizing irrigation practices.
Q: Is the API available worldwide?
A: Yes, the API provides global coverage, allowing farmers and agricultural professionals worldwide to benefit from satellite imagery analysis.


