

Precision farming · Monitoring guide
Agriculture Monitoring Systems: What Each Layer Tracks
Satellite images, soil probes, weather stations, combine yield monitors and livestock sensors each answer a different question at a different time. Here is what each layer measures, how many US farms use precision tools (22% in 2025, USDA NASS), and how to judge payback.
Key takeaways
- 22% of US farms used precision agriculture practices in 2025, down from 27% in 2023 (USDA NASS Technology Use, August 2025).
- Adoption is highest in row-crop states: 50% of North Dakota farms and above 40% in Iowa, Illinois, Nebraska and South Dakota in 2025.
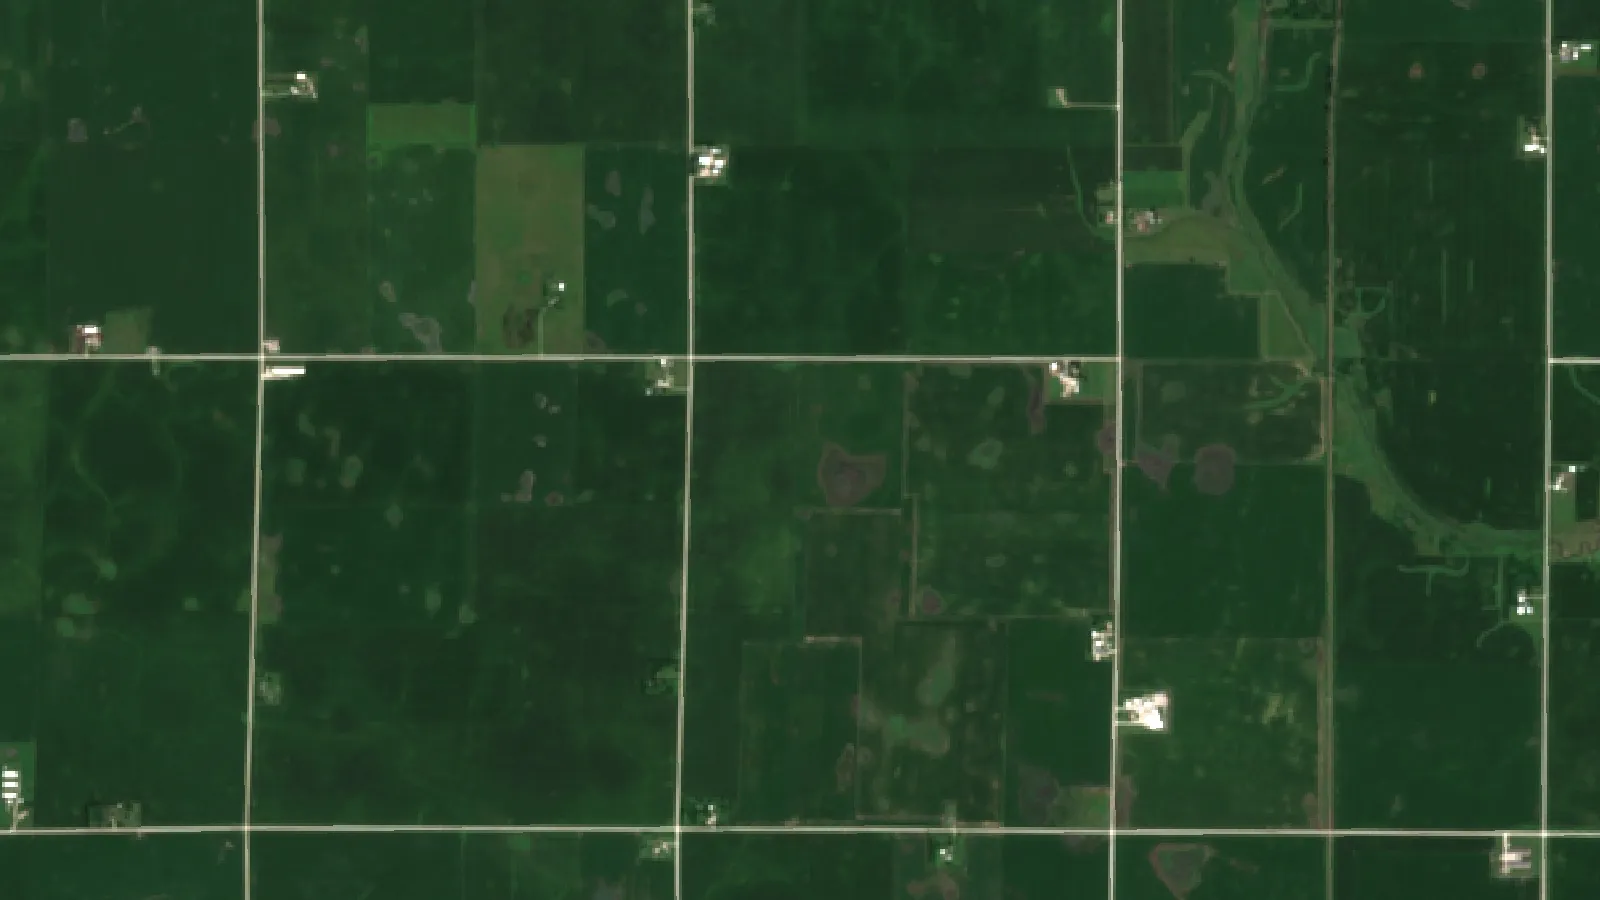
- Sentinel-2 revisits regular areas every five days with two satellites, so satellite monitoring can show crop change through the season.
- A yield monitor measures grain flow, moisture and position at harvest; the 2025 US corn average was a record 186.5 bu/acre (USDA NASS).
- Break-even test: divide the monitoring cost per acre by the crop price to see the extra yield it must deliver.
In this article
- What is an agriculture monitoring system?
- The layers of a farm monitoring system
- Satellite and drone crop monitoring
- Soil moisture sensors and weather stations
- How many US farms use precision agriculture?
- What a yield monitor measures
- What farmers do with yield monitor data
- In-season monitoring: acting before harvest
- Livestock monitoring on mixed farms
- Tracking inputs, carbon and records
- Agriculture monitoring outside the US
- What a monitoring system costs and how to judge payback
- How to choose an agriculture monitoring system
- How to check the latest figures
An agriculture monitoring system is the set of tools a farm uses to track what is happening in its fields and herds: satellite or drone images of crop health, soil moisture sensors, weather stations, combine yield monitors and, on livestock farms, animal sensors. Each layer answers a different question at a different time of the season. In 2025, 22% of US farms used some form of precision agriculture to manage crops or livestock, down from 27% in 2023, according to the USDA NASS Technology Use report of August 2025.
This guide explains what each layer of a farm monitoring system measures, how often it reports, what it costs to run, and how a yield map at harvest checks whether the rest of the system was right. It includes US adoption data by state, the latest national yields, and a calculator that shows how much extra yield a monitoring service must deliver to pay for itself on your own farm.
What is an agriculture monitoring system?
An agriculture monitoring system collects data about crops, soil, weather and animals, links it to a location on the farm, and shows it in a form a farmer can act on. The data can come from space, from the air, from the ground or from machines. Software then turns the readings into maps, alerts and records.
A simple system might be a phone app with satellite crop-health maps and a weather forecast. A larger one might add soil probes in every irrigated field, a weather station on the farm, a yield monitor in the combine and collars on the dairy herd. The goal is the same in both cases: see problems early, put inputs where they are needed, and keep a record of what happened.
USDA groups these tools under “precision agriculture”. Its survey question names GPS guidance, GPS yield monitoring and soil mapping, variable rate input applications, drones for scouting fields or monitoring livestock, electronic tagging, precision feeding and robotic milking. A farm that uses any one of them counts as an adopter in the NASS figures.
It helps to separate two ideas that are often mixed up:
- Crop and farm monitoring happens during the season. It tells you what is happening now, while you can still act.
- Yield monitoring happens at harvest. It tells you what the season produced, field zone by field zone.
A good agriculture monitoring system uses both. In-season data guide decisions, and the yield map shows which of those decisions paid off.
The layers of a farm monitoring system
Each layer has its own sensor, its own timing and its own blind spots. The table sums them up; the sections below explain each one.
| Layer | What it measures | How often | Main blind spot |
|---|---|---|---|
| Satellite crop monitoring | Plant vigor (NDVI and other indices), field-wide | Every few days, cloud permitting | Clouds; cannot see the cause of stress |
| Drone imagery | Plant vigor and plant counts at very fine detail | When someone flies it | Labor and flight time; small area per flight |
| Soil moisture sensors | Water in the soil at set depths | Continuous | One point per sensor; needs calibration |
| Weather station | Rain, temperature, humidity, wind, solar radiation | Continuous | One location; fields far away may differ |
| Combine yield monitor | Grain flow, moisture and position | Once a year, at harvest | Too late to change this season |
| Livestock sensors | Activity, rumination, temperature, location | Continuous | Cost per animal; alert overload |
Most farms build their system one layer at a time rather than buying it as a single package. The order usually follows the biggest risk on the farm: water on irrigated land, disease in humid regions, uneven yields on large row-crop fields.
Satellite and drone crop monitoring
Satellites give the widest view for the least effort. The European Sentinel-2 mission, for example, carries a 13-band multispectral camera and, with two satellites in orbit, revisits regular areas every five days under the same viewing angles, according to the Copernicus Sentinel-2 mission page. Its imagery is open to anyone, which is why many crop monitoring services start from it.
From these images, software calculates vegetation indices. The best known is NDVI, which compares red and near-infrared light. Healthy, dense leaves reflect a lot of near-infrared light and absorb red light, so they score high. Stressed, thin or bare patches score lower. Our guide to NDVI ranges from agricultural land to vegetation health explains what the numbers mean.
What satellite monitoring does well:
- It covers every acre, not only the rows a scout walked.
- It shows change over time, so a patch that falls behind its neighbors stands out.
- It needs no hardware in the field.
What it cannot do: it cannot see through clouds, and it cannot tell you why a patch is stressed. Low NDVI might mean drought, a nutrient shortage, disease, insects, hail or a planting problem. The map tells you where to look; a field visit tells you what you are looking at.
Drones fill a different gap. They fly under the clouds and can show single plants, which helps with stand counts and spot checks. But each flight covers a limited area and needs a pilot, so drones suit targeted checks more than weekly whole-farm coverage.
▶ How satellite NDVI maps show crop stress across a large farm before it is visible from the field edge. · 4:09
Soil moisture sensors and weather stations
Water is one of the biggest swing factors in yield. Soil moisture sensors measure how much water is in the root zone, so you can irrigate before the crop shows stress. There are about four main types of in-field technology: neutron probes, TDR and FDR sensors (both read the soil’s dielectric constant), tensiometers and gypsum blocks. TDR, FDR and tensiometers are the most common, according to UC Agriculture and Natural Resources guidance on soil moisture sensors. The same source notes that sensors measuring volumetric water content need site calibration to be accurate and are sensitive to salinity.
Cost is often the deciding factor. Single-depth sensors usually range from $100 to $700, and wireless gateway equipment usually costs $399 to $2,250, with repeaters around $150 to $200, according to University of Arizona Cooperative Extension guidance on soil moisture sensor selection. These are dealer and list price ranges published by the extension service, not quotes; check current prices with suppliers. Data plans come on top.
A weather station on the farm records rain, temperature, humidity, wind and solar radiation where your crops actually grow. That matters for disease models, spray timing and irrigation scheduling, because rain can vary a lot over a few miles. A station only represents its own spot, so farms spread over a wide area may need more than one, or a gridded weather service to fill the gaps.
Moisture data become more useful when they guide where water goes. In a two-year study in west-central Nebraska, variable rate irrigation prescribed less water than uniform irrigation in the 2018 soybean season (265 mm versus 282 mm under full irrigation), and grain yield did not differ significantly in either the 2017 maize or the 2018 soybean season, as reported in a peer-reviewed study of variable rate irrigation in west-central Nebraska. Results depend on soils and season, so treat this as one trial, not a general rule. For more on the sensors and networks behind this, see our overview of IoT systems for smart farming.
How many US farms use precision agriculture?
USDA asks this question every two years. The national share of farms using precision agriculture practices was 25% in 2021 and 27% in 2023, according to the NASS Technology Use report of August 2023. In the August 2025 report it was 22%. The figures count farms, not acres, and the US has about 1.9 million farms, many of them small, so a large share of crop acres can be monitored even when the farm share is modest.
Chart
US farms using precision agriculture
Percent of farms using precision agriculture practices to manage crops or livestock, survey years
Adoption is far higher in row-crop states. In 2025, half of North Dakota farms used precision agriculture, and Iowa, Illinois, Nebraska and South Dakota were each above 40%. Several eastern and western states were below 15%. A University of Illinois analysis in farmdoc daily (January 2026) links this pattern to farm size: tools such as auto-guidance, variable-rate application and yield monitors are fixed-cost add-ons that become cheaper per acre as acreage grows. The same analysis notes California as an exception, where high land, labor and water costs can justify the tools on specialty crops.
By crop, the longer-run picture is clearer. Auto-steer guidance was used on 5.3% of planted corn acres in 2001 and 58% in 2016, according to the USDA Economic Research Service report Precision Agriculture in the Digital Era. The same report found yield maps, soil maps and variable rate technology on only 5% to 25% of planted acres of winter wheat, cotton, sorghum and rice.
Chart
Precision agriculture use by state, 2025
Percent of farms using precision agriculture practices; the ten highest states and the US figure
What a yield monitor measures
A yield monitor sits in the combine. It has three parts: a mass flow sensor that measures grain flowing through the machine, a moisture sensor that corrects the weight to marketable grain, and a GPS receiver that records where each reading was taken. That description comes from the full ERS report (EIB-248), which also lists 1993 as the year the in-cab yield monitor was commercialized.
Put the readings on a map and you get a yield map: a grid showing where the field produced more and where it produced less. A national average hides all of that. The 2025 US corn yield was a record 186.5 bushels per acre and the soybean yield was 53.0 bushels per acre, according to the USDA NASS Crop Production report of March 2026. Inside a single field, yields can swing well above and below the field average from one zone to the next. The yield map shows where.
A yield monitor has limits:
- Calibration. Readings are only as good as the calibration. Each crop, and sometimes each moisture range, needs its own.
- Timing. It reports once a year, when nothing can be changed for the current crop.
- Data cleaning. Start and end of passes, overlaps and grain flow delay create errors that need cleaning before analysis.
Our guide to yield mapping in precision agriculture covers how to build and use the maps.
What farmers do with yield monitor data
Farmers use the same machine for different jobs depending on the crop. ERS found that corn and winter wheat growers relied on yield monitors mainly to track grain moisture, while cotton, soybean and sorghum growers used them mainly to help decide chemical input use. The data can also guide tile drainage, irrigation changes and lease talks.
Chart
Main use of yield monitor data by crop
Percent of yield-monitored planted acres; moisture tracking for corn and wheat, chemical input decisions for the others
The most useful step is to compare the yield map with the in-season data. If a zone looked weak on satellite images in July and also yielded poorly, the cause probably began before harvest and is worth investigating: soil, drainage, compaction or fertility. If a zone looked healthy in July but yielded poorly, the problem came late: disease, lodging, harvest loss or a calibration error. Over a few seasons, this comparison shows which zones are always weak and which were unlucky in one year.
Many precision tools are used together. ERS found that combining yield or soil maps with variable rate technology was used on about 2% of corn and soybean acres, while maps combined with guidance ranged from 7% of cotton acres to 15% of soybean acres. The full benefit comes when maps feed decisions, not when they sit in a folder.
In-season monitoring: acting before harvest
The real value of an agriculture monitoring system is time. A yield monitor tells you what happened. In-season monitoring tells you what is happening while you can still act. A simple weekly routine:
- Check new satellite images after each clear pass. Look for zones that fall behind the rest of the field.
- Read the weather record. Did the weak zone get less rain, more heat, or a frost?
- Check soil moisture where you have sensors. Is the root zone dry?
- Visit the zone. Dig, look at roots and leaves, and check for insects or disease.
- Decide and record. Irrigate, apply, replant or wait, and write down what you did.
- Compare with the yield map at harvest to learn whether the action worked.
This routine also builds a record. Lenders and insurers increasingly ask for evidence of crop condition, and buyers ask for proof of how crops were grown. A dated series of satellite images and field notes is a simple way to provide it.
Before acting on any fertilizer or crop-protection decision, check the product label and local rules, and get advice from a qualified agronomist where needed. Monitoring data show where to look; they do not replace a diagnosis.
▶ How to read a satellite farm advisory that flagged a drop in expected maize yield during the season. · 9:13
Livestock monitoring on mixed farms
On farms that run cattle alongside crops, monitoring extends to the herd. Ear tags, collars and leg sensors track activity, rumination time and sometimes body temperature. Changes in these patterns can flag illness, lameness or heat (estrus) before a person would notice in a routine check. Electronic tagging and robotic milking are both named in the NASS precision agriculture question, so they count in the adoption figures above.
Before buying, ask the vendor for evidence from farms like yours: how many days earlier the system flags a problem, how many false alarms it raises, and what it costs per animal per year. A system that sends too many alerts is soon ignored.
Satellite monitoring helps on the pasture side too. Grazing land can be watched for regrowth after grazing and for drought stress, which helps decide when to move animals.
Tracking inputs, carbon and records
The same data that guide yield decisions also support record-keeping. A monitoring system lets a farm:
- log water, fertilizer and spray use against the crop’s actual need;
- keep dated evidence of crop condition through the season;
- estimate emissions linked to fuel and inputs for buyer or regulatory reports;
- trace produce from a field to a buyer.
Rules on emissions reporting and traceability differ by country and buyer. In the UK and EU, for example, supply-chain rules and buyer schemes are changing; check the current rules that apply to your farm and get professional advice where needed.
Agriculture monitoring outside the US
The tools work the same way in Canada, the UK, Europe, Australia and New Zealand. A flow sensor and GPS receiver on a header in New South Wales measure wheat the same way as a combine in Illinois measures corn. Sentinel-2 imagery covers all these regions on the same five-day revisit cycle.
What changes is the benchmark. Australian growers compare their season with the ABARES crop reports, which forecast winter and summer crop production by state. Canadian growers use Statistics Canada field crop estimates, and UK growers use Defra’s cereal and oilseed production figures. A yield map is most useful when you compare it with your own farm’s history first and a regional figure second.
What a monitoring system costs and how to judge payback
Costs vary a lot by layer. Satellite crop monitoring is usually sold as a subscription per acre or per hectare. Soil moisture sensors involve hardware, a gateway and a data plan, with the ranges given earlier. Yield monitors usually come with the combine or as a dealer add-on. Livestock sensors are priced per animal.
A simple way to judge any of them is the break-even yield gain: how many extra bushels per acre the system must help you produce, or save, to cover its cost. Divide the cost per acre by the crop price. At an example cost of US$3 per acre and an example price of US$4.20 per bushel, you need about 0.7 extra bushels per acre, under 0.4% of a 186.5-bushel corn crop. Savings on water, fertilizer or spray count too, so add them to the gain side.
The calculator below lets you test your own numbers. Keep your own estimate of the gain modest. The research on precision tools shows a wide range of results by crop, soil and region, and a single trial is not a forecast for your farm.
Try the numbers for your own farm below.
Calculator
How much extra yield must a monitoring system deliver?
Enter your own acres, cost, price and expected gain.
- Break-even gain as share of normal yield: 0.4 %
- Total yearly cost (US$): 3,000 US$
- Value of your expected gain (US$): 2,940 US$
- Net result per year (US$): -60 US$
Example values only, not a benchmark or a forecast; every number is your input. Price input: example, use today’s price. Cost should include subscriptions, hardware spread over its life and data plans. Count input savings (water, fertilizer, spray) as part of the gain.
How to choose an agriculture monitoring system
Start with the decision you want to improve, not the gadget. Some questions to ask:
- What is my biggest risk? Water, disease, uneven fields or animal health each point to a different first layer.
- How big and spread out is the farm? Satellite monitoring scales easily across many fields; in-field sensors scale with the number of devices.
- Who will look at the data? A system nobody checks each week adds cost without value.
- Does it export data? Make sure maps and records can move to your farm management software, agronomist or lender.
- Is there local support? The farmdoc daily analysis reports industry concern about a shortage of farm service technicians, so ask who will install and maintain the hardware.
- Can I test it first? Try it on a few fields for one season and compare with the yield map.
Farmonaut provides the satellite layer of this stack: you draw your fields once and see crop health, vegetation and soil moisture maps for them through the season on web, Android or iOS, with weather data alongside. It does not replace a combine yield monitor; it fills the gap between planting and harvest. For a closer look at the AI side, see our article on AI-powered crop monitoring, and for a wider view of new farm tools, our roundup of agriculture technologies.
Related pages on our site: carbon footprint tracking · crop loan and insurance checks · product traceability · farm fleet management · large-scale farm management · satellite and weather API documentation · web and mobile apps

▶ A step-by-step tour of monitoring crops by satellite in a web app. · 8:43
How to check the latest figures
Every number in this guide has a date. These public releases give the newest figures:
- US yields: USDA NASS Crop Production reports, with the annual summary each January. See the NASS guide to its agricultural yield surveys for how the estimates are made.
- US precision agriculture adoption: the NASS Technology Use report, published in August of odd-numbered years. The next one is due in August 2027.
- Detailed adoption by crop: USDA ERS reports based on the Agricultural Resource Management Survey.
- Australia: ABARES crop reports, published several times a year.
FAQ
What is an agriculture monitoring system?
It is a set of tools that track crops, soil, weather and animals on a farm and link each reading to a location. Common layers are satellite or drone crop images, soil moisture sensors, weather stations, combine yield monitors and livestock sensors.
What is the difference between crop monitoring and yield monitoring?
Crop monitoring happens during the season and shows crop health while you can still act. Yield monitoring happens at harvest: a sensor in the combine measures grain flow and position to build a yield map. Most farms that use both compare the two to learn what worked.
How many US farms use precision agriculture?
22% of US farms in 2025, down from 27% in 2023, according to the NASS Technology Use reports. Adoption was 50% in North Dakota and above 40% in Iowa, Illinois, Nebraska and South Dakota.
How often do satellites monitor a field?
Sentinel-2 revisits regular areas every five days with two satellites in orbit. Clouds block optical images, so the number of usable images depends on the weather.
Is a farm monitoring system worth the cost?
Divide the cost per acre by the crop price to get the extra yield needed to break even. At low per-acre costs the break-even gain is small, but it still has to be earned. Test on a few fields for a season and compare results with your yield map.
Does satellite monitoring replace a yield monitor?
No. Satellite monitoring covers the season before harvest; a yield monitor measures the result at harvest. They answer different questions and work best together.
Farmonaut crop monitoring
See your own fields from space
Draw your fields once and Farmonaut shows satellite crop health and soil moisture maps for them through the season, on web, Android or iOS.




Sources
- USDA NASS, Technology Use (Farm Computer Usage and Ownership), August 2025: esmis.nal.usda.gov
- USDA NASS, Technology Use (Farm Computer Usage and Ownership), August 2023: esmis.nal.usda.gov
- USDA NASS, Crop Production, released 10 March 2026: esmis.nal.usda.gov
- USDA NASS, Guide to NASS Surveys: Agricultural Yield: nass.usda.gov
- McFadden, Njuki and Griffin, Precision Agriculture in the Digital Era: Recent Adoption on U.S. Farms, USDA ERS EIB-248 (summary page), February 2023: ers.usda.gov
- USDA ERS, EIB-248 full report (PDF), February 2023: ers.usda.gov
- Copernicus, Sentinel-2 mission (SentiWiki): sentiwiki.copernicus.eu
- UC Agriculture and Natural Resources, Soil Moisture Sensors: ucanr.edu
- University of Arizona Cooperative Extension, Guidance for Soil Moisture Sensor Selection: extension.arizona.edu
- Variable Rate Irrigation of Maize and Soybean in West-Central Nebraska Under Full and Deficit Irrigation (PMC): pmc.ncbi.nlm.nih.gov
- Kalva and Janzen, The People Behind the Machines, farmdoc daily, January 2026: farmdocdaily.illinois.edu
- ABARES, Australian Bureau of Agricultural and Resource Economics and Sciences: agriculture.gov.au
Discussion
Questions, corrections or field experience? Share them below. First-time comments are reviewed before they appear, and your email is never published.
No comments yet. Be the first to add a question or your experience.

 Patrick America
 Red Dog Management
 Liquify Digital
 Ascentya
 CU Foods
 BeyondTech Global
 Rouge VC
 AgroGreen Dynamics
 AgroRisk
 Oath Inc
 Reddane Farming
 Esri North East Africa
 Cresol
 MDCV UK
 Zerella Group
 Etech Consulting Madagascar
 Vestlandsforsking
 Delicio
 WB Dev
 Sama Premium
 Prochecker
 Tres Valles

 Exploration consultancy · South Africa · Gold
 Licence holder · Niger · Gold
 Client · Tanzania · Gold
 Client · Somalia · Gold










