

Reviewed August 2026 against the European Commission’s Common Agricultural Policy funding pages, the European Investment Bank, and USDA Economic Research Service data.
Try it: Enter your numbers and click Calculate. →
If you’re asking how to invest in farming right now, there are three real entry points: EU Common Agricultural Policy (CAP) funding for farms and agribusinesses operating in the EU, European Investment Bank (EIB) co-financed loans for sustainable agriculture SMEs, and direct or fund-based investment in the sustainable agriculture market itself, which independent market research puts at $44.7 billion globally in 2026. None of these are passive index-fund clicks — each has eligibility rules, application windows, and geography restrictions that determine whether your money (or your labor, if you’re the one farming) actually qualifies. This article breaks down what each route requires, what it pays, and how to check whether you’re eligible before you apply.
Table of Contents
- EU Agriculture Funding: CAP Budget and How It’s Split
- EU Eco-Schemes: The “Eco Farming Fund” Explained
- EIB’s €3 Billion: Financing for Farm SMEs
- How to Invest in Agriculture as an Outside Investor
- Sustainable Farming Investment: What the Numbers Say
- US Conservation Practice Adoption: What’s Actually Happening on the Ground
- Organic Farming Economics: Premiums and Profitability
- Jobs in Horticulture and a Youth Roadmap for Agriculture
- Calculator: Estimate Your Sustainable Farming Transition Payback
- Where Farm Technology Fits Into the Investment Case
- Try it: Enter your numbers and click Calculate.
EU Agriculture Funding: CAP Budget and How It’s Split
The EU’s core farm-funding instrument is the Common Agricultural Policy, and for the 2021-2027 budget period it totals €386.6 billion, according to the European Commission’s CAP funding page. That figure splits into two “pillars”: €270 billion goes to Pillar 1, which funds direct income-support payments to farmers, and €95.5 billion goes to Pillar 2, the European Agricultural Fund for Rural Development, which covers investment grants, agri-environmental schemes, young-farmer start-up aid, and rural infrastructure. If you search “eu funding agriculture” or “eu agriculture funding” looking for where to apply, Pillar 2 is almost always the relevant door — Pillar 1 payments flow through national paying agencies to farmers already registered in the system, while Pillar 2 rural development grants are the ones open to new applicants, including agribusiness SMEs and young entrants.
Two things to check before assuming you qualify. First, CAP funding is disbursed through each EU member state’s national or regional Rural Development Programme, not directly from Brussels — the application portal, deadlines, and co-financing rate differ by country, so the starting point is your national agriculture ministry’s CAP strategic plan page, linked from the European Commission’s own site. Second, the Commission states that 40% of total CAP expenditure for 2023-2027 is dedicated to climate and environmental action — meaning nearly half the budget is explicitly gated to environmental criteria, not open to any farm activity. Full detail: European Commission, CAP funds.
EU Eco-Schemes: The “Eco Farming Fund” Explained
If you’ve searched “eu eco farming fund,” there isn’t a single fund by that name — the mechanism is the CAP eco-scheme, a Pillar 1 instrument. Under the 2023-2027 CAP rules, member states must ring-fence 25% of their direct-payment budget specifically for eco-schemes: annual, voluntary payments to farmers who adopt practices such as cover cropping, extended crop rotation, reduced tillage, or organic conversion, on top of their base income support. That 25% ring-fence is a Commission-mandated minimum, confirmed on the Commission’s eco-schemes page, not a voluntary target member states can skip.
Eligibility and payment rates are set nationally within Commission guardrails, so a French arable eco-scheme payment per hectare differs from a German or Polish one. There is no consolidated public dataset yet showing 2024-2025 participation rates by member state and farm size — that is a genuine gap in current public reporting, not something this article can responsibly estimate. To get your farm’s specific rate, the method is: identify your country’s CAP Strategic Plan (searchable from the European Commission agriculture site), then check the eco-scheme annex for your region and crop type. Source: European Commission, eco-schemes.
EIB’s €3 Billion: Financing for Farm SMEs
Separately from CAP, the European Investment Bank announced €3 billion in EIB Group financing for sustainable farming, aquaculture, and bioeconomy projects in its 2024 announcement. This is loan financing, not a grant — it’s channeled through the EIB and national promotional banks to reach small and mid-sized agricultural enterprises, with the stated aim of mobilizing further private co-investment on top of the base €3 billion. The primary objectives behind this financing line are:
- Promoting green farming practices
- Enhancing climate resilience in agriculture
- Supporting small and medium-sized enterprises (SMEs) in the agricultural sector
- Fostering innovation in bioeconomy projects
- Improving soil health and water management
- Empowering young farmers and women in agriculture
Unlike a CAP grant, EIB financing works through intermediary banks — a farm SME applies through a participating national or regional bank, which uses the EIB credit line to offer longer repayment terms or lower collateral requirements than a standard commercial loan. That structure matters for anyone searching “invest agriculture” expecting a direct-to-investor product: this is farm-side financing, not a retail investment vehicle. Source: European Investment Bank, 2024 press release.

How to Invest in Agriculture as an Outside Investor
For readers in the United States searching “how to invest in farming” or “agriculture investment” without a farm to run themselves, the honest answer is that direct EU CAP and EIB programs above are not accessible — those are EU-farm-only. The routes that are open to a US-based outside investor generally fall into three categories, none of which this brief can quote a verified current return figure for:
- Farmland REITs and agriculture ETFs — publicly traded vehicles holding farmland or agribusiness equities. Returns are visible via each fund’s own disclosures; no single verified return figure applies across the category.
- Direct farmland ownership or farm-operator partnerships — requires land acquisition capital and typically local operating knowledge; USDA’s National Agricultural Statistics Service (NASS) publishes farmland value data by state, the starting point for underwriting a purchase.
- Impact or ESG-focused agriculture funds — the research brief for this article could not locate a verified IRR or NPV figure for sustainable-agriculture-focused investment vehicles; that data is not consistently published across funds, so treat any IRR claim from a single fund’s marketing material as that fund’s own number, not an industry benchmark.
What is verifiable is the size of the market these vehicles invest into: the global sustainable agriculture market was valued at $44.7 billion in 2026 by Markets & Markets, and separately projected by Precedence Research to reach $68.31 billion by 2035. Markets & Markets’ own figures put the compound annual growth rate at 10.0% for 2026-2036. Those are two different research firms with two different methodologies and end years, so treat them as directional market-size signals, not a single reconciled number — sources: Markets & Markets and Precedence Research.
Sustainable Farming Investment: What the Numbers Say
“Young farmer support and women in agriculture initiatives are key components of the EU’s sustainable farming funding lines.”
“Sustainable farming investment” and “investing in sustainable agriculture” both point to the same underlying question: does adopting sustainable practices pay, or is it purely a compliance cost? The clearest US data point comes from a long-running Iowa Farmers Union field study, which found organic farming systems generating $200 per acre in additional annual net returns compared with conventional systems, averaged over the long term of the trial. Separately, market analysis from Agriculture.Institute found organic farms running at 2.7 to 3.8 times the profitability of conventional operations in the 2020s, driven substantially by a 20-40% retail price premium organic products command over conventional equivalents.
Those figures answer “does it pay” for organic conversion specifically. They do not extend automatically to every sustainable practice — cover cropping, reduced tillage, and agroforestry have different cost-and-payback profiles that this brief’s sources do not quantify individually. For a farm-specific estimate, the calculator further down this page uses the $200/acre and premium-percentage figures above so you can model your own acreage and current yield.
US Conservation Practice Adoption: What’s Actually Happening on the Ground
For US readers, the more useful benchmark than EU policy is how many American farms have already adopted sustainable practices, because that tells you whether you’re ahead of or behind the curve. USDA’s Economic Research Service reports that conservation tillage was used on 76% of US corn acreage in 2021, and no-till specifically — the most intensive form of reduced soil disturbance — covered 36% of US corn acres that same year. Between 2012 and 2017, US farmers added a net 7.9 million acres of no-till production across major cash crops, per the same USDA ERS dataset.
That data is from 2021 — USDA ERS notes it draws on periodic tillage practice surveys, and NASS’s Conservation Practice Survey is updated annually each December with new acreage figures. If you need a current-year number rather than the 2021 baseline above, that December NASS release at nass.usda.gov is the correct source to check, not a rerun of the 2021 figure. Source: USDA Economic Research Service.
One further gap worth naming directly: this brief could not locate a current, verified count of certified organic farms or acreage in the United States for 2024-2026 — USDA’s own organic census data available at research time only went back to 2001. If your investment decision hinges on organic farm count or acreage growth, the correct current source is the USDA NASS Certified Organic Survey, released periodically, rather than any older figure repeated as if current.
Organic Farming Economics: Premiums and Profitability
The economics above break down into three separate levers, and conflating them is the most common mistake in ROI claims about organic conversion:
| Lever | Figure | What it actually measures | Source |
|---|---|---|---|
| Retail price premium | 20-40% above conventional | What organic-labeled products sell for at point of sale, not farm-gate margin | Agriculture.Institute |
| Net return differential | +$200/acre/year | Long-term average additional net return to the farm operation itself | Iowa Farmers Union |
| Overall profitability multiplier | 2.7x-3.8x conventional | Combined effect of premium pricing, yield differences, and input cost changes | Agriculture.Institute |
Note what’s missing from public data: a standardized transition-period cost (organic certification in the US typically requires a multi-year transition during which a farm cannot yet sell at organic premiums) is not quantified in this brief’s sources with a specific dollar figure — USDA’s NASS Agricultural Prices report, updated monthly, is where organic premium prices by commodity are tracked going forward, so check that report directly rather than relying on the 20-40% range indefinitely.
Jobs in Horticulture and a Youth Roadmap for Agriculture
Two of the smaller but real queries this page serves: “jobs in horticulture” and “youth roadmap ag.” On the EU side, the CAP funding structure described above includes explicit young-farmer provisions under Pillar 2 rural development — start-up grants, mentorship connections to experienced operators, agricultural education funding, and land-access support for new entrants, all financed from within the €95.5 billion Pillar 2 envelope. These are administered nationally, so a young farmer in Ireland applies through a different scheme window than one in the Netherlands, even though both draw on the same EU-level budget line.
For US readers specifically searching “jobs in horticulture,” the durable starting point rather than a point-in-time figure is the Bureau of Labor Statistics Occupational Outlook Handbook entry for agricultural and food science technicians and for grounds maintenance/horticultural workers, which BLS updates on its own annual cycle with employment counts, median pay, and projected growth — that handbook, not a static number repeated here, is the correct reference to check for current openings and wage data by state.
A durable checklist for evaluating any agriculture investment or funding claim
- Who pays and who applies? — CAP Pillar 1 flows to registered farmers automatically; Pillar 2 and EIB financing require an application through a national body or intermediary bank.
- What’s the vintage of the figure? — a CAP budget figure, a USDA adoption rate, and a market-size forecast each carry different publication dates; check the date before comparing two numbers.
- Is the return farm-gate or retail? — a price premium at the store shelf is not the same as net return to the grower.
- Does the program apply to your geography? — EU CAP and EIB financing are EU-farm-only; they do not extend to US, UK, or other non-EU operations.
- Is there a refresh source named? — treat any figure without a named, checkable source as unverified, regardless of how specific it sounds.
Green Farming Practices Behind the Investment Case
Whether financed through CAP, EIB, or private capital, the practices these funding lines actually pay for are consistent: green farming methods including organic transition, precision agriculture, agroforestry, and conservation tillage. These are the same practice categories the USDA adoption data above tracks in the US and that EU eco-schemes pay for per hectare. Investment case aside, the underlying environmental logic is that reduced tillage and cover cropping cut soil erosion and improve soil organic carbon, which is also the mechanism behind the long-term yield stability that supports the $200/acre return differential cited above.

Calculator: Estimate Your Sustainable Farming Transition Payback
Use your own acreage, current yield value, and the organic premium range above to see a rough payback range for transitioning acreage — every input is yours to change, not assumed.
Enter your numbers and click Calculate.
Assumptions and exclusions: uses the $200/acre long-term net return differential (Iowa Farmers Union) as a floor and your selected retail premium percentage (Agriculture.Institute, 20-40% range) applied to your entered per-acre revenue as a ceiling estimate. It excludes certification fees, yield dips common during transition years, and any state or CAP eco-scheme payments you may separately qualify for — add those manually. This is a planning estimate, not a guarantee of return.
Where Farm Technology Fits Into the Investment Case
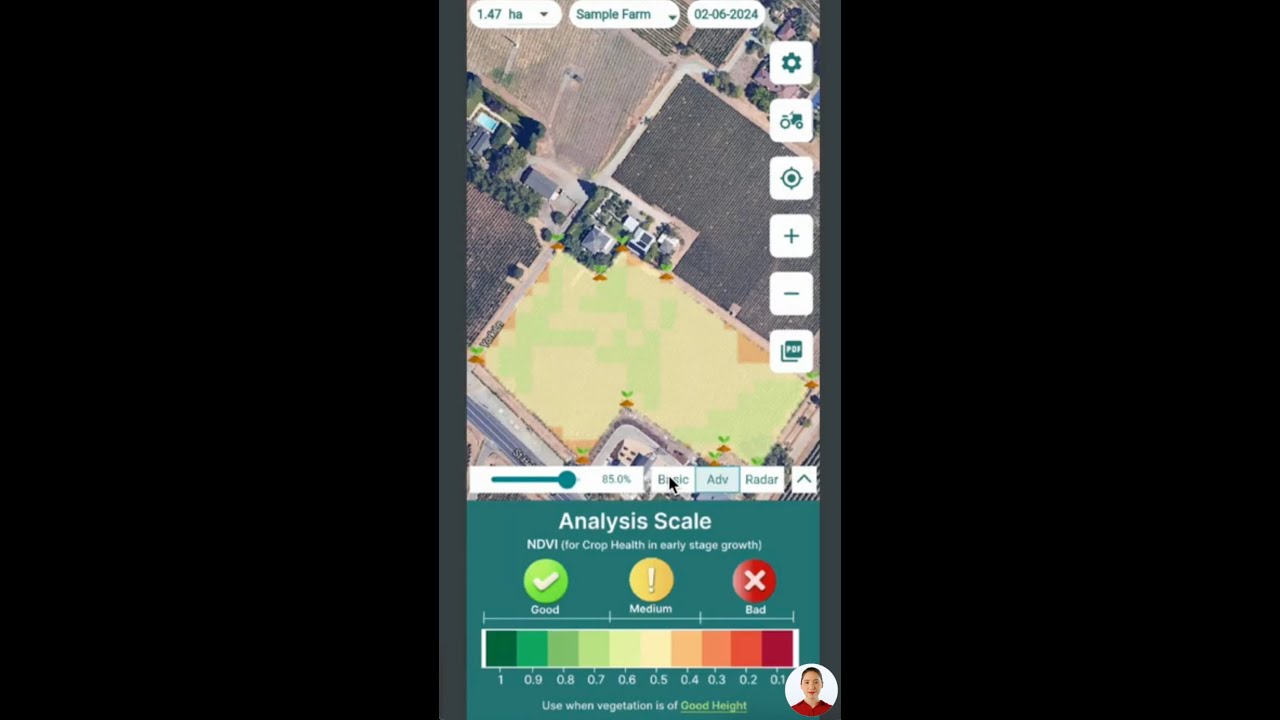
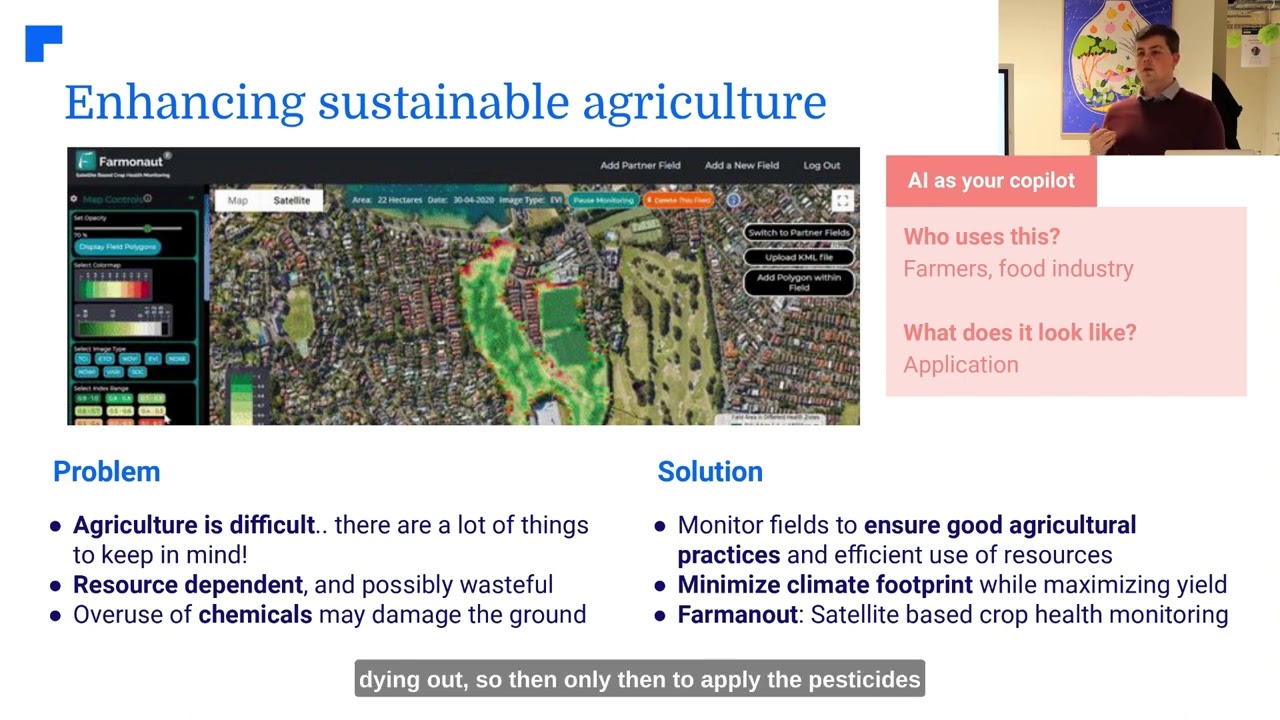
Every funding route above — CAP eco-schemes, EIB SME loans, or private capital chasing the sustainable agriculture market — ultimately pays out based on documented practice change: proof of reduced tillage, verified water management efficiency, or measured soil health improvement. That documentation burden is exactly where satellite-based farm monitoring platforms fit. Farmonaut provides satellite crop health tracking, AI-based advisory, and resource management tools that can generate the field-level records eco-scheme audits and lender due diligence increasingly ask for.
Farmonaut is accessible through a web app, mobile apps for Android and iOS, and a developer API:



Developers integrating satellite and weather data into their own underwriting or compliance-tracking systems can review the API documentation for available endpoints. The same monitoring approach underpins sustainable resource management across supply chains, climate-resilient farming practices, and drought-response planning such as the climate-smart agriculture measures Zimbabwean farmers have used against drought. Extreme-weather exposure is also where agricultural insurance solutions increasingly rely on the same satellite verification data to price index-based coverage.

Farmonaut Subscriptions
Further reading:
FAQs
- Q: What’s the fastest way to check if I qualify for EU agriculture funding?
A: Identify your country’s CAP Strategic Plan through the European Commission’s agriculture site, since Pillar 2 rural development grants — the ones open to new applicants — are administered nationally, not centrally from Brussels. - Q: Is the EU’s €3 billion EIB financing available to US or UK farms?
A: No. EIB Group financing and CAP funding are both restricted to farms and agribusinesses operating within the EU; US and UK readers should look to USDA and Defra programs respectively for equivalent domestic support. - Q: How does organic conversion actually pay off, in numbers?
A: A long-running Iowa Farmers Union study found $200 per acre in additional annual net returns for organic versus conventional systems, and Agriculture.Institute found organic operations running at 2.7-3.8 times conventional profitability, driven by a 20-40% retail price premium. - Q: What share of US corn acreage uses conservation tillage?
A: USDA’s Economic Research Service reported 76% conservation tillage and 36% no-till on US corn acreage in 2021; NASS releases updated Conservation Practice Survey data annually each December for a current figure. - Q: Does this investment address climate resilience directly?
A: Yes — both CAP’s 40% climate-and-environment expenditure share and EIB’s SME financing line explicitly fund drought-resistant crop research, efficient irrigation, and early-warning systems for extreme weather. - Q: Where do I find current organic premium prices for my specific crop?
A: USDA NASS’s Agricultural Prices report is updated monthly and tracks organic premiums by commodity — check that report directly rather than relying on the general 20-40% range cited here.
The through-line across every query this page answers — EU funding mechanics, US adoption data, organic economics, or career entry points — is the same: check the primary source’s publication date, confirm it still applies to your geography, and use the named refresh path above to pull a current figure before committing capital or acreage.

 Vizexec Transformation
 GalaxEye Space
 Sun Palm Australia
 Grandstream Algérie
 XOS Realty
 Geospatial Lab Africa
 Agro La Gándara
 HIPSAC
 ZOL Zimbabwe
 Juligerm
 AdBio
AdBio MISE Maroc
 NWNS
NWNS Red August Group
 Farm Inc
 WeMe Global
 Agrotoken
 Blue BearX
 Insignito
 DnCubed
