

For forests, plantations, farms and power lines
A wildfire monitoring system that flags fires while they're small
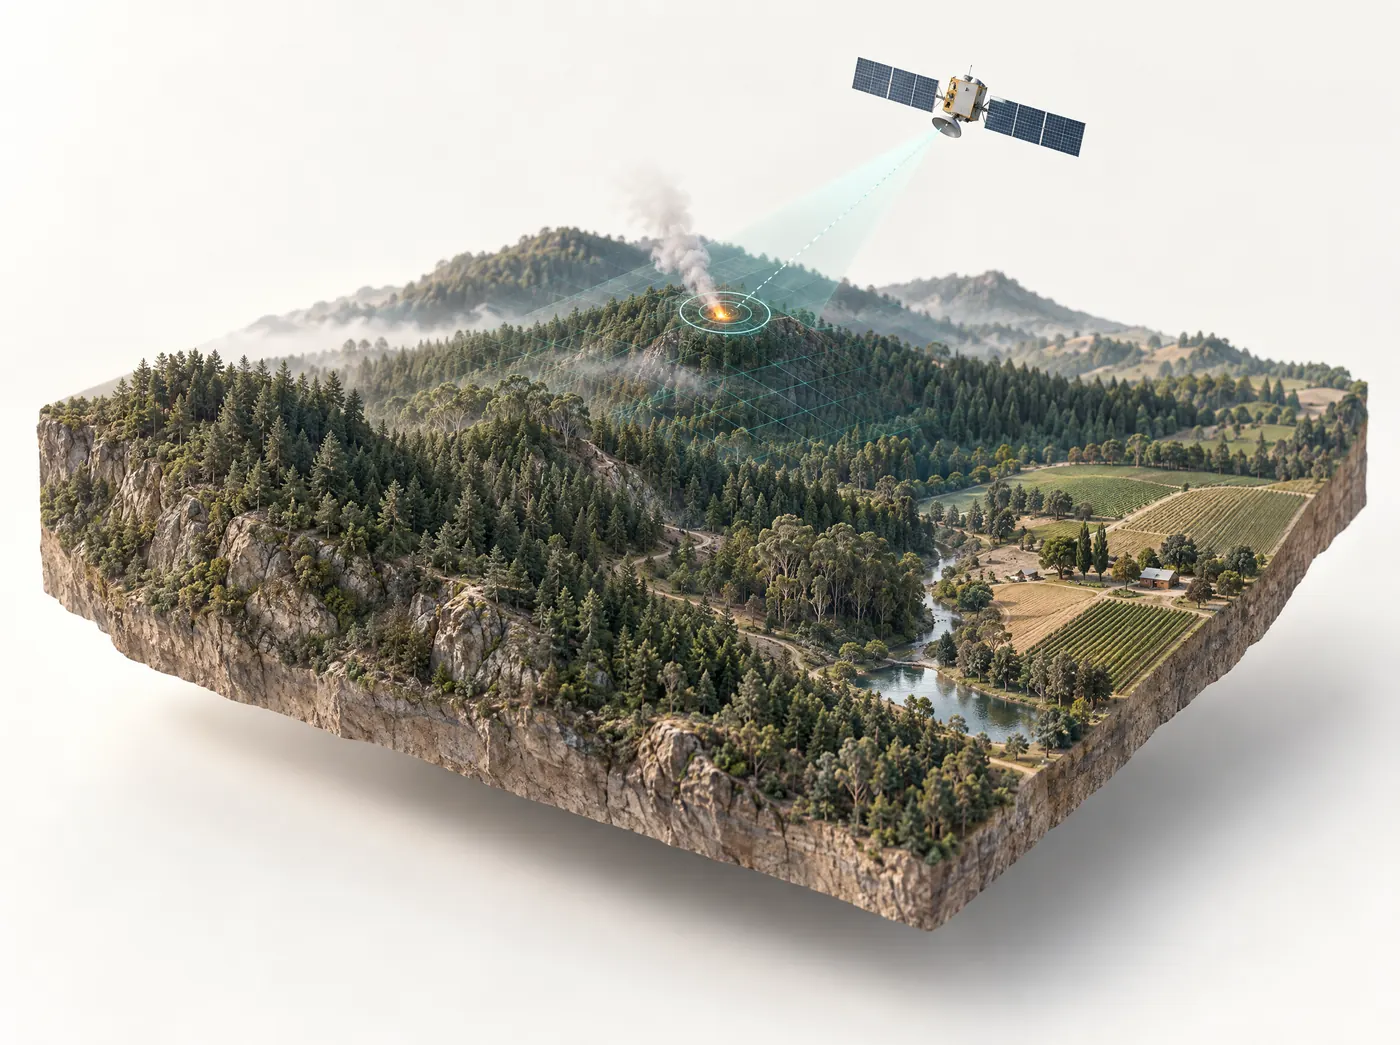
You draw the boundary, whether that's one plantation or a whole national park, and our wildfire monitoring system checks it against MODIS, VIIRS and Sentinel satellite fire data. Detections go through an AI filter that drops likely false alarms. When a real fire turns up, you get an SMS, email or app alert with the fire on a map and a forecast of where it's heading.
Fire was the main cause of record forest loss in 2024
More tree cover was lost in 2024 than in any year on record, and fire did more of the damage than logging. In hotter, drier seasons, a fire that might once have burned out on its own is more likely to reach a plantation, a power line or a town. An early alert gives a crew a chance to reach the fire while it's still small.
Source: World Resources Institute / Global Forest Watch, "Global forest loss shatters records in 2024, fueled by massive fires", May 2025.
How satellite wildfire detection works
Satellites carry thermal sensors that pick up the heat from an active fire. We pull those detections for your area, screen out the ones that probably aren't wildfires, and alert you about the rest.
Draw your area
Draw the boundary on the map or upload it. It can be a forest block, a plantation, a farm, a power line corridor or a reserve, anywhere in the world.
We check the feeds
MODIS, VIIRS and Sentinel feeds are checked for new fire signals inside your boundary as often as every 2.5 minutes.
False alarms are removed
An AI model screens out signals that are likely false positives. The fire clusters that remain are ranked by how serious they look.
Your team is alerted
The alert goes out by SMS, email and the app, with the fire's location, its intensity and a spread forecast for the next 1, 3 and 6 hours.
How quickly a fire shows up depends on when a satellite next passes over and how much cloud there is, so we suggest using the alerts alongside your ground crews, cameras and local fire services rather than in place of them.
What's on each dashboard
During fire season, most teams want to know three things: which areas are running hot, where something is burning right now, and where it's likely to spread. There's a wildfire dashboard for each.

Heat and fire-risk map
A surface heat map from satellite thermal data, with wind direction, temperature, humidity and soil moisture overlays. Use it to spot which blocks are fire-prone before anything ignites.

Active fires
Active fire clusters with fire radiative power (FRP), area, coordinates and local weather for each one, sorted by severity with the worst at the top.

Spread forecast
A forecast of growth rate, direction and likely impact over the next 1, 3 and 6 hours. It's based on weather, forest type, fuel load and slope, and there's a time-series view to see how the fire has grown.
SMS, email, app and API
How fire alerts reach your team
Raw satellite fire data picks up heat signals that aren't wildfires. Our AI wildfire detection step filters those out before an alert is sent, which keeps your crews from chasing false alarms.
- Fewer false alarms: AI filtering screens out heat signals that are unlikely to be wildfires.
- Ranked by priority: alerts are ranked by nearby people, ecological sensitivity and urgency.
- Full event reports: each event comes with a spread map, a forecast and a growth trend.
- Any area: set up custom areas anywhere, from one farm to a whole network of reserves.
SMS
Reaches field crews with no data signal.
Full event details for the duty desk and managers.
App
Push alerts with the fire on the map.
API
Send events into your own control-room systems.
Fire monitoring isn't only for fire agencies
If you own, insure or run assets on land in fire country, a forest fire monitoring system is just as useful to you as it is to a fire service.
Forest owners and timber companies
Keep an eye on each compartment of a forest estate without putting a lookout tower on every ridge.
Plantations
Oil palm, rubber, pulpwood and orchard estates spread over thousands of hectares, often in remote country.
Farms and ranches
Farm fire monitoring for crops, pasture, hay and buildings, including bushfire monitoring on Australian properties.
Utilities
Monitor transmission and distribution corridors and get alerts when a fire starts near the line.
Insurers
Know which insured areas are near an active fire, and keep a dated fire record for each area.
Parks and governments
National parks, reserves and agencies covering large areas with small teams.
How satellite monitoring compares with towers and patrols
Satellite alerts don't replace people on the ground. Cameras and patrols confirm each detection, and the satellite covers remote areas they can't reach.
| Towers, patrols and ground sensors | Satellite wildfire monitoring | |
|---|---|---|
| Coverage | Each lookout, camera or sensor covers a limited view or radius | Covers whatever boundary you draw, whatever its size or location |
| Remote ground | Remote or rugged areas are often not covered at all | Covered like any other part of your boundary |
| Equipment | Hardware needs installing, power and maintenance | No equipment to put in the field |
| How a fire gets reported | Someone has to see the smoke and call it in | Automatic alerts by SMS, email and app, filtered by AI, with fire intensity and a 1, 3 and 6-hour spread forecast |
How satellites detect active fires
Burning vegetation is several hundred degrees hotter than the ground around it, and at those temperatures it gives off far more energy in the mid-infrared, around 4 micrometers, than cool land does. Fire sensors measure that band alongside a thermal band near 11 micrometers. When a pixel is much brighter at 4 micrometers than its neighbors, the detection algorithm marks it as an active fire, usually called a hotspot. A hot flaming front covering only a small part of a pixel can be enough.
MODIS, on NASA's Terra and Aqua satellites, produces a 1 km active fire product. VIIRS, on Suomi NPP, NOAA-20 and NOAA-21, has a 375 m fire band, so it finds smaller fires and outlines the front more closely. Sentinel-2 shows fire fronts and burn scars at 20 m but passes over any one place far less often. NASA publishes MODIS and VIIRS detections worldwide through FIRMS, its Fire Information for Resource Management System. Terra and Aqua are near the end of their missions: NASA expects them to begin shutting down in late 2026 or early 2027 and points users to the equivalent VIIRS products.
| Source | Pixel size | How often it looks |
|---|---|---|
| MODIS (Terra, Aqua) | 1 km | Up to about four looks a day between the two satellites |
| VIIRS (Suomi NPP, NOAA-20, NOAA-21) | 375 m | About two passes a day from each satellite |
| Sentinel-2 | 10 to 20 m | About every 5 days, daylight only |
| Geostationary weather satellites such as GOES and Himawari (for comparison; our alerts use the MODIS, VIIRS and Sentinel feeds above) | About 2 km or coarser | Every 10 to 15 minutes |
What fire radiative power means
Fire radiative power (FRP) is the rate at which a fire gives off radiant heat, in megawatts. A low reading is often a small or smoldering fire; a high one usually means an intense front with a lot of fuel burning at once. It's most useful as a trend, so compare FRP for the same fire from one pass to the next. Our active-fire dashboard shows it for every cluster.
Why detection time depends on satellite passes and cloud
We check the feeds for your area as often as every 2.5 minutes. That's how often our system looks for new data, which is different from how often a satellite is overhead. A fire can only be detected after a satellite with a fire sensor has passed over it, the data has reached a ground station and been processed, and the hotspot has been published. Polar-orbiting satellites give a handful of looks at any place each day, with gaps of several hours between them, so a fire that starts just after a pass can burn for a while before the next one.
Thick cloud blocks the infrared bands used for fire detection, so a fire under heavy overcast won't show up until the cloud moves. Smoke is less of a problem: mid-infrared light passes through most smoke, which is why hotspots often appear under a plume that hides the fire in a true-color image. A dense canopy can hide a low-intensity surface fire until it gets hotter or opens a gap.
If your cloudy season overlaps with fire season, ask any provider how many clear looks you actually get in those months.
The 1-hectare threshold and false alarms
One hectare is a square 100 m on each side, about 2.5 acres. Our wildfire monitoring system is designed to flag fires from about that size, but heat matters as much as area. A hectare of dry grass burning hot is far easier to pick up than smoldering peat or a fire creeping under closed canopy. For a crew, a fire found at that stage is often still a local job. Found a few hours later, after a wind change, it can need aircraft.
Where false alarms come from
A fire algorithm reacts to heat, and plenty of things are hot without being a wildfire: sun-heated rock and dark roofs, sunlight glinting off water or metal, gas flares, kilns and smelters, volcanoes, and planned fires such as stubble burning or prescribed burns. A filter can check whether a hotspot sits where something is always hot, whether the land there can burn, and whether a second pass or sensor agrees. That screening is where most of the work in AI wildfire detection happens. Ours drops detections that are unlikely to be wildfires and groups the rest into fire events before anyone is alerted. There's more on the AI side in how AI and satellites spot wildfires in minutes.
What goes into a fire-spread forecast
Fire behavior models, from the Rothermel model behind many US tools to the McArthur meters Australia used for decades, rest on the same drivers:
- Wind speed and direction, usually the biggest single factor in how fast and which way a fire runs. Wind also carries embers ahead of the front.
- Fuel type, load and dryness. Grass carries fire quickly and burns out fast; litter, shrubs and timber burn longer and hotter.
- Slope. Flames lean into the fuel above them and preheat it, so fire runs faster uphill.
- Temperature and humidity, which decide how dry fine fuels get over the day.
Our spread dashboard uses weather, forest type, fuel load and slope to forecast growth rate, direction and likely impact 1, 3 and 6 hours ahead. Lean on the 1-hour view. Forecasts get less certain the further ahead they look, because the wind shifts or embers jump a road and start a spot fire no model can place exactly. Use the 3- and 6-hour views to plan which roads may close and which assets to protect first, and check them again with each new detection.
Building a fire response workflow around alerts
An alert only helps if the person who gets it knows what to do next. Settle these points before the season starts:
- Who gets which alerts. SMS reaches phones with no data signal, so it suits field crews; email and the app suit the duty desk.
- How a detection gets confirmed, whether by camera, drone, patrol or a call to the local brigade, and how fast.
- When to escalate. A confirmed fire near houses or a power line might go straight to the fire service, while a weak hotspot in a known burn area gets checked first. Alerts arrive ranked by nearby people, ecological sensitivity and urgency, which helps here.
- Who calls the fire service. If people or property are at risk, call your emergency number (911 in the US, 000 in Australia) first.
- What gets kept. Each event has a spread map, a forecast and a growth trend, a dated record for insurers and your post-season review.
A control room can take fire events through the API straight into its dispatch system or control-room dashboard. Insurers and lenders who want fire history next to crop and yield data can look at our crop loan and insurance tools, and what California's 2024 wildfires taught us about fire prevention covers preparation lessons from a hard season.
How to choose a wildfire monitoring system
Most wildfire detection systems sound alike on a product sheet. These are the questions we'd ask in your place:
- Which satellites does it use, and how often does each one pass over your area?
- When it says it checks every few minutes, is that new satellite data or the software polling for it?
- What's the smallest fire it's designed to flag, and in what conditions?
- How are false alarms handled, and can you see why each alert was raised?
- Can different areas alert different people, including crews without data signal?
- Does it forecast spread, from which inputs, and how far ahead?
Then think about what it will sit alongside. A satellite-based forest fire monitoring system covers large and remote ground without hardware, camera towers watch a fixed view continuously, and patrols confirm what's burning. Our overview of wildfire technology compares cameras, drones, sensors and satellites in more detail.
 Bushfire monitoring in Australia
In southern Australia the main fire season runs through summer. Across the tropical north most fires burn in the dry season, and many are planned early-season burns by land managers and ranger groups. Those show up as hotspots too, so bushfire monitoring on a northern property needs a quick way to tell a neighbor's planned burn from one nobody started on purpose.
Eucalypt forests are known for spotting, where burning bark is carried ahead of the front and lights new fires beyond a road or firebreak. On bad fire weather days, read a spread forecast there as a guide to direction rather than an exact line. Grassfires move faster still, which is why farm fire monitoring matters for paddocks, fences and hay.
State fire agencies issue the official warnings under the Australian Fire Danger Rating System, introduced nationally in 2022, and Geoscience Australia runs a public hotspot map, DEA Hotspots. Our alerts add to those: they're tied to your boundary, go to your own people, and come with FRP and a spread forecast. If you also farm the land, satellite crop monitoring covers crop health and water need on the same property.
Before you buy a wildfire monitoring system
What is a wildfire monitoring system?
It's a service that checks an area for signs of fire and alerts the people responsible as soon as one is found. Ours uses satellite thermal data to detect active fires inside the areas you define, then sends alerts with the fire's location, its intensity and a forecast of how it may spread.
How does satellite wildfire detection work?
Sensors on satellites such as MODIS, VIIRS and Sentinel measure heat coming from the ground. An active fire shows up as a hot spot against cooler surroundings. We check these feeds for your area, use AI to filter out signals that are unlikely to be wildfires, and group the rest into fire events.
How quickly will I be alerted?
Your area is checked for new fire signals as often as every 2.5 minutes, and an alert goes out as soon as a filtered detection is confirmed. The total time also depends on when a satellite last passed over and on cloud cover. The guide above explains how both affect timing.
How small a fire can it detect?
The system is designed to flag fires from about 1 hectare in size. Very small or very short-lived fires, and fires under thick cloud, may not be visible to satellites.
What is fire radiative power (FRP)?
FRP is the rate at which a fire gives off radiant heat, measured in megawatts and calculated from the satellite's mid-infrared reading. A higher value means more fuel burning at once. Each active fire cluster on our dashboard shows its FRP, which helps you see which fires are burning hardest and whether one is building between passes.
Which satellites are used for wildfire detection?
The most widely used are MODIS on NASA's Terra and Aqua satellites (1 km pixels) and VIIRS on Suomi NPP, NOAA-20 and NOAA-21 (375 m pixels). Sentinel-2 adds 10 to 20 m detail of fire fronts and burn scars, though it passes less often. Our system fuses MODIS, VIIRS and Sentinel feeds.
Can satellites detect fires through smoke or cloud?
Through most smoke, yes, because the mid-infrared light used for fire detection passes through it. Thick cloud is different: it blocks those bands, so a fire under heavy cloud usually won't be detected until the cloud clears.
How does AI wildfire detection work?
The satellite sensor finds the heat, and the AI decides which heat signals are worth an alert. Plenty of hot things aren't wildfires, from industrial sites to sun-heated rock. Our model screens out signals that are unlikely to be wildfires, groups the rest into fire events, and ranks alerts by nearby people, ecological sensitivity and urgency.
Is a wildfire detection system the same as an early warning system?
Not quite. Detection finds fires that have already started, while fire danger warnings come from weather-based ratings issued by fire agencies. Our heat and fire-risk map sits between the two: it shows which blocks are running hot and dry, with wind, humidity and soil moisture overlays, before anything ignites.
Can it forecast where a fire will spread?
Yes. The spread dashboard forecasts fire growth for the next 1, 3 and 6 hours, using weather, forest type, fuel load and terrain, and shows the expected direction and growth rate.
Does it work for bushfire monitoring in Australia?
Yes. You can monitor any area in the world, including farms, plantations and reserves in Australian bushfire country. Alerts arrive by SMS, email and app wherever your team is.
Can I connect fire alerts to my own systems?
Yes. Fire events are available through an API, which you can use to push them into a control-room dashboard, a dispatch system or your own app.
How much does wildfire monitoring cost?
Pricing depends on the size of the area, the number of users and the alerts and dashboards you need. Contact our team for a quote.
Before the next fire season
Which forest, estate or corridor should we cover?
All we need is the boundary, drawn on a map or uploaded, and the list of people who should get the alerts. Our team sets up the monitoring and dashboards from there.
More Farmonaut solutions