

Reviewed August 2026 against USDA Economic Research Service and Clemson University Department of Agricultural Sciences data.
Try it: Run your own numbers →
Table of Contents
- Introduction: What Advanced Farming Technologies Actually Deliver
- The Numbers: Adoption and Yield Data
- What Is Precision Farming (and How Is It Different From Advanced Farm Technologies)?
- Benefits of Precision Farming, Measured
- 7 Advanced Farm Technologies Boosting Crop Yields
- Technology Impact Comparison Table
- Soil Moisture Monitors and Wireless Crop Monitors: What the Data Shows
- Calculator: Soil Moisture Sensor ROI for Your Acreage
- Farmonaut: A Farming Monitor Without the Hardware Bill
- Where Advanced Farming Technologies Are Headed
- Challenges and Considerations
- Getting Started With Farmonaut
- Frequently Asked Questions
- Conclusion
Advanced Farming Technologies: Real Yield Data & Adoption
27% of US farms had adopted some form of precision agriculture technology as of 2023, according to the USDA Economic Research Service — but that headline number hides a much sharper split by farm size: 68% of large crop farms (over $1 million in annual income) use it, versus a small share of the smallest operations. Soil moisture sensors alone added an average $202.28 per acre in net income across a six-farm South Carolina field study run by Clemson University’s Department of Agricultural Sciences in 2021 — a 19.42% average increase in net income for those farms. Those two data points, adoption rate and dollar return, are the actual answer to “do advanced farming technologies work,” and they are also the numbers an AI summary won’t hand you with sourcing attached.
This article is deliberately data-first. It defines precision agriculture (also called agronomy‘s applied, technology-driven branch — agronomy itself is the science of soil management and crop production, and precision farming is how that science gets executed with GPS, sensors, and satellite data), walks through the seven technology categories driving the 27%-to-68% adoption gap, and gives you a comparison table plus a working ROI calculator so you can size the decision for your own acreage rather than take a marketing claim on faith.

The Numbers: Adoption and Yield Data
Guidance autosteering — GPS-driven equipment that keeps tractors on a precise pass without manual correction — shows the same size split. USDA ERS reported 70% of large-scale crop farms using autosteering guidance systems in 2023, against 52% of midsize farms. That gap matters if you’re benchmarking your own operation against “advanced farming technologies”: the technology curve isn’t uniform, it’s a function of farm income and acreage, and the data below lets you place your own operation on it rather than assume a single national average applies to you.
What Is Precision Farming? (And How to Define Agronomy)
Precision farming is a data-driven agricultural practice that uses GPS, GIS, remote sensing in agriculture, IoT devices, and AI-driven analytics to manage variability within a field rather than treating the whole field as one uniform unit. To define agronomy in the same breath: agronomy is the branch of agricultural science concerned with soil management, crop production, and the biology behind both. Precision farming is agronomy’s operational layer — the tools that take agronomic knowledge (what a crop needs, and when) and apply it at the scale of square meters instead of whole fields.
In practice, this means fertilizer, water, and pesticide only go where and when a field actually needs them, based on mapped and measured variability rather than a blanket application rate.



TIP: You can use the Farmonaut API and API Developer Docs to integrate satellite crop monitoring systems and remote sensing into your own farm management tools.
Benefits of Precision Farming, Measured
- Higher net income on soil moisture data: the Clemson field study measured a $202.28/acre average net income gain across the six participating South Carolina farms in 2021 — a 19.42% average increase — directly attributable to soil moisture sensor-guided irrigation timing.
- Adoption tracks farm scale: 68% of large crop farms versus 27% of all US farms (USDA ERS, 2023) means the return is real enough that the biggest operations have already moved, even as many smaller farms have not yet made the jump.
- Guidance systems are now the norm on large operations: 70% of large-scale crop farms run autosteering guidance (USDA ERS, 2023), which reduces input overlap and pass-to-pass waste directly.
- A market big enough to fund cost-share support: the US agriculture sensor market was valued at $540.8 million in 2024 (GMI Insights), part of a global environmental agricultural wireless sensor market valued at $2.957 billion in 2024 (Market Research Future) — scale that has attracted government cost-share programs offsetting up to 75% of precision agriculture hardware and subscription costs in some reported 2024 market analyses.
- Try it: Run your own numbers

7 Advanced Farm Technologies Boosting Crop Yields
“Advanced farming technologies” is a category, not one product. Here are the seven components that make it up, what each actually does, and where independent sources back the yield claims. A note before the list: published per-technology yield ranges for GPS, GIS, VRT, and farm management software specifically are not consistently broken out in current USDA data — where that’s the case below, we say so rather than assign a number, and point you at the underlying source instead.
-
1. Global Positioning System (GPS)
GPS delivers accurate location data for mapping, soil sampling, and input application. USDA ERS’s 2023 data shows the practical adoption picture: 70% of large-scale crop farms and 52% of midsize farms now run guidance autosteering, the main GPS-enabled application on tractors and sprayers.
- Main Functions: Field mapping, yield monitoring, tractor guidance, and machine management.
- Benefits: Resources are allocated efficiently, chemical inputs are applied with precision, and overlap/skip waste is minimized.
- Use Case: GPS-guided tractors enable site-specific input application, directly reducing pass-to-pass waste.
Resource:
University of Missouri Extension: GPS in Precision Farming -
2. Geographic Information Systems (GIS)
GIS tools map soil types, moisture levels, and crop health into layered, analyzable field data, letting you identify zones that need different treatment rather than one blanket rate.
- Main Functions: Mapping and analysis of field variability, spatial monitoring of crop conditions, supporting data-driven input decisions.
- Benefits: Targeted interventions and multi-season tracking of field performance.
Resource:
Point One Navigation: GIS for Precision Agriculture -
3. Remote Sensing (Satellite Imagery and Drones)
Remote sensing uses satellite imagery and aerial drones for crop health monitoring, soil moisture assessment, and pest detection, feeding real-time field conditions to a screen instead of requiring a walk-through.
- Main Functions: Crop monitoring, soil moisture measurement, pest and disease detection, growth stage tracking.
- Benefits: Early issue identification, reduced crop loss, optimized input timing.
-
4. Variable Rate Technology (VRT)
VRT applies water, fertilizer, and pesticide at varying rates across a field, based on the mapped variability that GIS and remote sensing produce, instead of one flat rate for the whole acreage.
- Main Functions: Site-specific input application, nutrient prescription mapping, fertilizer/pesticide optimization.
- Benefits: Reduced input costs and lower over-application of chemicals into runoff.
Resource:
Relevant Software: VRT Solutions -
5. Internet of Things (IoT) — Soil Moisture and Wireless Crop Monitors
IoT connects soil moisture sensors, weather stations, and automated irrigation regulators to a central dashboard. This is the category behind “soil moisture monitor” and “wireless crop monitor” as products, and it’s the one with the clearest dollar figure attached: the Clemson field study’s $202.28/acre average net income gain (2021, six South Carolina farms) came specifically from soil moisture sensor-informed irrigation scheduling, not from GPS or VRT.
- Main Functions: Continuous monitoring of field conditions, automated irrigation and input control, real-time alerts.
- Benefits: Measured net income increase of 19.42% average across the study farms, plus lower labor time spent on manual soil checks.
-
6. Artificial Intelligence (AI) and Machine Learning
AI in precision agriculture processes farm data to flag pest infestations, forecast crop disease pressure, and time irrigation and harvest. It’s the analysis layer sitting on top of GPS, GIS, remote sensing, and IoT data streams.
- Main Functions: Yield forecasting, pest/disease detection, irrigation scheduling, resource-optimization analytics.
- Benefits: Faster, pattern-based decisions across large data volumes that would take a person days to review manually.
Resource:
EOS Data Analytics: AI in Agriculture -
7. Farm Management Software & Data Analytics Platforms
Farm management software aggregates data from every sensor and device above into one dashboard for tracking crop health, operations, and profitability by field.
- Main Functions: Data aggregation, visualization, action planning, resource tracking, profitability analysis.
- Benefits: A single source of truth across GPS, GIS, VRT, and IoT inputs, instead of separate logins per device vendor.
Resource: Relevant Software: Farm Management Tools
Technology Impact Comparison Table: Precision Farming Technologies
The table below separates what is independently measured from what is not yet published at the same rigor. Where USDA or Clemson data gives a specific figure, it’s shown with its source; where a category’s yield contribution isn’t broken out in current federal or university data, that’s stated directly rather than filled with an estimate.
| Technology | Main Function | Measured Adoption / Impact | Source & Date |
|---|---|---|---|
| GPS Guidance / Autosteering | Instrument guidance, field mapping | 70% of large-scale crop farms, 52% of midsize farms | USDA ERS, 2023 |
| GIS | Spatial data analysis and visualization | No separate USDA adoption figure published; bundled into overall precision ag adoption rate | USDA ERS, 2023 |
| Remote Sensing (Satellite/Drones) | Crop health, soil moisture, pest monitoring | Component of the 27% overall precision ag adoption rate; no isolated figure published | USDA ERS, 2023 |
| Variable Rate Technology (VRT) | Input application at variable rates | No separate USDA adoption figure published for VRT alone | USDA ERS, 2023 |
| IoT Soil Moisture Sensors | Continuous soil moisture and field monitoring | $202.28/acre net income gain, 19.42% average increase (6-farm SC study) | Clemson University, 2021 |
| Precision Ag Overall (all categories) | Combined GPS/GIS/RS/VRT/IoT/AI adoption | 27% of all US farms; 68% of large crop farms (>$1M income) | USDA ERS, 2023 |
| US Agriculture Sensor Market | Hardware market for the above categories | $540.8 million market size (US); $2.957 billion (global environmental ag wireless sensors) | GMI Insights / Market Research Future, 2024 |

Soil Moisture Monitors and Wireless Crop Monitors: What the Data Shows
If you searched for a “soil moisture monitor” or “wireless crop monitor” specifically, here’s the data that applies directly rather than the general precision-ag adoption numbers above. The Clemson University Department of Agricultural Sciences field study, run across six South Carolina farms in 2021, is the most specific dollar figure available for this category: soil moisture sensor use produced a $202.28 per acre average increase in net income, a 19.42% average increase, driven by more accurately timed irrigation instead of calendar-based or guesswork scheduling.
That figure has two limits worth stating plainly. First, it comes from a six-farm academic study, not a federal survey — it’s the best available and it’s real, but it isn’t a USDA-scale sample. Second, there is no federal (USDA) study specifically measuring soil moisture sensor efficacy at national scale as of this review; the Clemson data is the most rigorous public figure we found, and no soil-moisture-specific adoption percentage (distinct from the broader 27% precision ag figure) is published for the US farm population. If you want a number closer to your own region, university cooperative extension services — Clemson’s among them — run ongoing irrigation and soil moisture field trials, publishing results in seasonal cooperative extension bulletins for South Carolina and North Carolina; that’s the right place to look for an updated or regionally specific figure rather than relying on one study indefinitely.
On the market side: the environmental agricultural wireless sensor market — the hardware category that “wireless crop monitor” products belong to — was valued at $2.957 billion globally in 2024 (Market Research Future), while the narrower US agriculture sensor market alone was valued at $540.8 million in 2024 (GMI Insights). Both firms publish updates; Mordor Intelligence and Market Research Future issue quarterly market tracking, so check their current reports rather than treating a 2024 figure as static.
Calculator: Soil Moisture Sensor ROI for Your Acreage
Use the Clemson study’s measured $202.28/acre average net income gain as your baseline, then adjust it to your own acreage, current input cost, and expected sensor system cost to see a payback estimate in your own numbers.
Run your own numbers
Assumptions and exclusions: the default $202.28/acre figure is the average net income gain measured across six South Carolina farms in a 2021 Clemson University field study — your own crop, irrigation system, and regional water costs will shift this. The calculator does not account for financing costs, sensor maintenance beyond year one, or yield variability from weather. The 75% cost-share ceiling reflects government cost-share offsets reported in 2024 precision farming software market analyses and may not apply in every US state or program; check your local USDA Natural Resources Conservation Service or state extension office for current program terms before assuming eligibility.
Farmonaut: A Farming Monitor Without the Hardware Bill
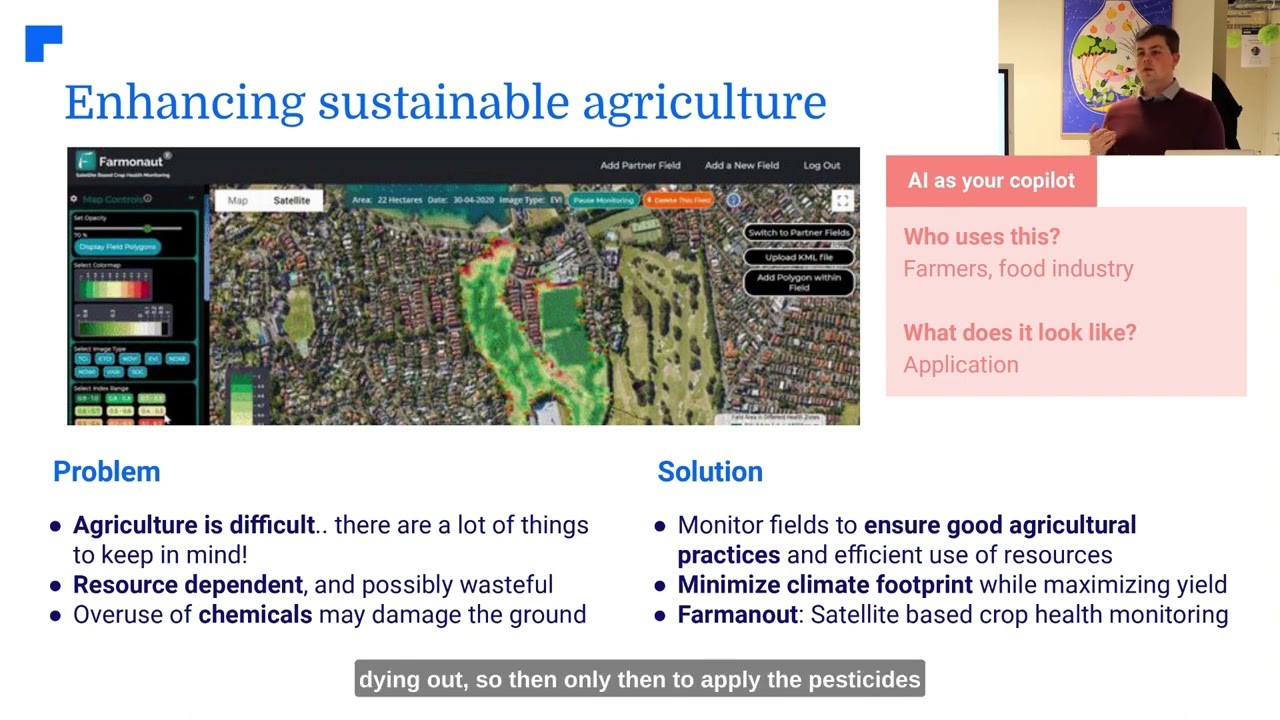
Farmonaut approaches "farming monitor" and "soil moisture monitor" from a different angle than physical sensors: instead of installing IoT hardware in the ground, it uses satellite imagery to estimate crop health and soil moisture conditions remotely, at a subscription cost rather than a hardware capital outlay. That matters directly against the adoption data above — the 27%-versus-68% gap between all US farms and large crop farms is partly a capital-cost gap, and a satellite-based approach is one way to close it without requiring the $3,500-plus sensor network cost modeled in the calculator above.
The platform delivers satellite-based crop health monitoring, AI-driven advisory, and blockchain traceability through a smartphone, web browser, or API, without requiring on-field hardware installation.
Key Precision Farming Features on Farmonaut
-
Satellite-Based Crop Monitoring: Multi-spectral satellite imagery for real-time vegetation health (NDVI), soil moisture monitoring, and pest detection, enabling timely interventions without ground sensor hardware.
Learn more about Large-Scale Farm Management with Farmonaut - Jeevn AI Advisory System: An AI-driven advisor that analyzes satellite data and provides crop management recommendations, weather forecasts, and pest management advisory.
-
Blockchain Traceability: Every step of the crop journey, from farm to consumer, can be tracked and verified on a secure blockchain ledger.
Explore Blockchain-Based Agriculture Traceability -
Resource & Fleet Management: Track fleet and optimize farm machinery usage, reducing operational costs.
Optimize Fleet with Farmonaut Solutions -
Carbon Footprinting: Monitor and quantify farming emissions.
Discover Sustainability Monitoring -
Satellite-Based Crop Loan & Insurance Management: Satellite verification for crop loan approvals and insurance claims.
Learn about Crop Loan & Insurance Verification
Where Advanced Farming Technologies Are Headed
The adoption gap documented by USDA ERS — 27% overall versus 68% for large crop farms, 52% versus 70% for guidance autosteering by farm size — is the trend to watch, not a single new gadget. As sensor hardware costs continue to be tracked by GMI Insights and Market Research Future (both publishing update cycles through 2024 and beyond), and as government cost-share programs continue offsetting a reported 75% of hardware and subscription costs in some 2024 market analyses, the practical question for any given farm is whether the capital-cost barrier that currently separates large and midsize operations closes for their size and region.
- Continued size-based adoption convergence: whether midsize and small farms close the gap toward the 68% large-farm adoption rate depends heavily on cost-share program availability and hardware pricing over the next several USDA Census of Agriculture reporting cycles.
- Satellite-based monitoring as a lower-capital alternative: platforms substituting subscription access for on-field sensor hardware are one direct response to the capital-cost gap in the adoption data.
- AI and predictive analytics layered on existing data: as more farms already run GPS guidance (70% of large farms) and IoT sensors, the next value layer is analysis of that existing data stream rather than new hardware categories.
Challenges and Considerations
The USDA ERS adoption data itself points to the primary barrier: capital cost. The 68%-versus-27% gap between large and all farms, and the 70%-versus-52% guidance autosteering gap between large and midsize farms, both track farm income and scale — not access to information or willingness to adopt.
- High Initial Costs: the same capital gap visible in USDA's own size-based adoption breakdown. Government cost-share programs reportedly offsetting up to 75% of hardware and subscription costs (2024 market analysis) are one mitigation route; satellite-based platforms that avoid hardware purchase entirely are another.
- Technical Expertise: using precision agriculture technologies demands training. Simplified interfaces and AI-driven advisory tools reduce this barrier without eliminating it.
- Data Management & Security: the data volume from GPS, IoT, and remote sensing streams requires storage, analysis, and privacy safeguards.
- Connectivity Issues: reliable rural internet remains a limiting factor for continuous IoT data transmission in some regions; offline functionality and API integrations reduce but don't eliminate this friction.
Getting Started With Farmonaut
A mobile phone or web browser is the only hardware requirement to begin. Here's how:
- Register on the Farmonaut Platform via web, Android, or iOS app for access to your crop monitoring dashboard.
- Add your fields: Draw or upload boundaries for satellite-based monitoring.
- Monitor Your Crops: Track vegetation health, soil moisture, pest risks, and get alerts and recommendations.
- Automate Resources: Use the Jeevn AI Advisor for strategies covering irrigation, fertilizer use, and pest control.
- Scale Up As Needed: From single fields to large plantations, Farmonaut adapts to your operation's scale.
Want to automate farm data integration? Access Farmonaut's API and Developer Docs for advanced applications.
Choose a Farmonaut Subscription Plan:
Frequently Asked Questions (FAQ)
What percentage of US farms use precision agriculture?
27% of all US farms used precision agriculture technology as of 2023, per the USDA Economic Research Service. That rate rises to 68% among large crop farms with over $1 million in annual income, showing that adoption tracks farm scale closely. Check USDA ERS's data products page for the next Census of Agriculture update, expected around 2027, for a more current figure.
What is precision agriculture's yield increase, and is 15–30% accurate?
There is no single confirmed US federal figure covering a 15–30% yield increase across all precision agriculture categories. What is documented: soil moisture sensors produced a 19.42% average net income increase ($202.28/acre) across six South Carolina farms in a 2021 Clemson University study. Net income increase and yield increase are different measures — the Clemson figure is income, not tonnage or bushels per acre. No USDA-published yield-percentage study for soil moisture monitoring specifically was located as of this review.
Define agronomy in relation to precision farming.
Agronomy is the science of soil management and crop production. Precision farming is the applied, technology-driven execution of agronomic decisions — using GPS, GIS, remote sensing, IoT, and AI to apply agronomic knowledge at the scale of specific field zones rather than a whole field.
What's the difference between a soil moisture monitor and a wireless crop monitor?
"Soil moisture monitor" typically refers to an in-ground sensor measuring water content at root depth. "Wireless crop monitor" is a broader term covering any sensor network — soil, weather, or plant-mounted — that transmits field data wirelessly to a dashboard. Both fall under the IoT category in the IoT section above, and both are part of the $540.8 million US agriculture sensor market (GMI Insights, 2024).
How does remote sensing in agriculture benefit farmers?
Remote sensing, including satellite imagery and drones, offers near-real-time assessment of crop health, soil moisture, and potential threats, supporting early detection of pest or disease outbreaks and reducing crop losses through targeted intervention.
Is Farmonaut suitable for small and midsize farms given the adoption gap?
Yes — Farmonaut's satellite-based, subscription model is built specifically to address the capital-cost gap that USDA ERS data shows separates large farms (68% precision ag adoption) from the broader farm population (27%), since it avoids the upfront hardware purchase that drives that gap.
Further reading:
Conclusion: Advanced Farming Technologies, By the Numbers
The measurable case for advanced farming technologies rests on a small set of hard figures: 27% of US farms have adopted precision agriculture as of 2023, rising to 68% among large crop farms; guidance autosteering runs on 70% of large farms and 52% of midsize farms; and soil moisture sensors produced a $202.28/acre, 19.42% average net income gain in a 2021 Clemson University field study. Those numbers, not a blanket "boosts yields" claim, are what should drive an investment decision.
Farmonaut's satellite-based approach is one way to access the monitoring layer of this technology stack — crop health, soil moisture, pest detection — without the hardware capital cost that the USDA's own size-based adoption data shows as the likely reason smaller farms lag behind large ones.

 Sarvome
 Polaris Digitech
 Teledarbas
 Wild Oak Farm
 SFX
SFX BACF Africa
 Doodlakine
 Exurbia Geospatial
 FieldZero
 Indico Company
 Kubota
 FFBS
FFBS Jontra
