

Crop indices · NDRE explained
NDRE Full Form: NDVI vs NDRE and When to Use Each
NDRE stands for Normalized Difference Red Edge. It swaps NDVI’s red band for red edge light, which kept responding longer in North Dakota corn and California rice trials.
Key takeaways
- NDRE = (NIR − red edge) / (NIR + red edge); NDVI = (NIR − red) / (NIR + red).
- Red NDVI readings commonly bunch at 0.85 to 1.0 once leaves cover the row (Sharma et al., 2015).
- In California rice, drone NDVI saturated at 96 kg N/ha uptake and drone NDRE at 130 (Rehman et al., 2022).
- NDRE was no better than NDVI for rice biomass (Scientific Reports, 2017), so the choice depends on the question.
- Sentinel-2 offers NDRE at 20 m; Landsat 8 and 9 have no red edge band (ESA, USGS).
In this article
- NDRE full form and formula
- What NDVI stands for
- NDVI vs NDRE: the five differences
- 1. The bands they use
- 2. How they behave in a dense canopy
- 3. When in the season they work best
- 4. What each one tells you about nitrogen
- 5. Where you can get each one
- What field trials show
- Corn in North Dakota
- Rice
- Corn in a nitrogen rate trial
- NDVI or NDRE: which should you use?
- What about water stress, pests and yield forecasts?
The NDRE full form is Normalized Difference Red Edge, a crop index worked out as (NIR − red edge) / (NIR + red edge). NDVI uses the red band instead of red edge. In 15 North Dakota corn trials, the two predicted yield about equally at V6, and red edge NDVI did better in most comparisons at V12 (Sharma et al., 2015).
So the short rule is this: use NDVI while the canopy is still filling in, and add NDRE once rows close or when nitrogen is the question. Below you will find the five differences, the field evidence, where each index falls short, and a calculator that works out both from your own reflectance values.
NDRE full form and formula
NDRE stands for Normalized Difference Red Edge. Some papers call the same idea “red edge NDVI”. Each word tells you something:
- Normalized difference: one band minus another, divided by their sum. This keeps the result between −1 and +1.
- Red edge: the narrow part of the spectrum between red and near-infrared (NIR) light.
The formula is NDRE = (NIR − Red Edge) / (NIR + Red Edge). Take a NIR reflectance of 0.45 and a red edge reflectance of 0.22. The result is 0.23 / 0.67, or about 0.34.
What NDVI stands for
NDVI is the Normalized Difference Vegetation Index. The USGS gives its formula as (NIR − R) / (NIR + R), where R is red. Healthy plants absorb most visible light and reflect a large share of NIR. NASA notes that zero means no vegetation and values of 0.8 to 0.9 mean very dense green leaves.

▶ How NDVI works and how it is used to monitor crop health. · 7:48
NDVI vs NDRE: the five differences
This table is the quick view. The sections below give the evidence for each row.
| Difference | NDVI | NDRE |
|---|---|---|
| 1. Bands | Red and NIR | Red edge and NIR |
| 2. Dense canopy | Flattens out sooner | Flattened later in the studies below |
| 3. Best timing | Before canopy closure | Around and after canopy closure |
| 4. Main signal | Green cover and biomass | Closer link to chlorophyll and nitrogen uptake |
| 5. Data access | Sentinel-2 at 10 m, Landsat 8-9 at 30 m | Sentinel-2 at 20 m; no Landsat 8-9 band |
1. The bands they use
Both indices share NIR. The only change is the second band. On Sentinel-2, red sits at about 665 nm and the red edge bands at about 704, 740 and 783 nm, with NIR bands at about 833 and 865 nm (ESA SentiWiki).
Chart
Where the bands sit on Sentinel-2
Approximate centre wavelength in nm, red to near-infrared
2. How they behave in a dense canopy
Once leaves fully cover the row, red NDVI readings commonly fall into a narrow range of 0.85 to 1.0. That is called saturation. Real differences in yield potential become hard to see, because every part of the field looks about the same.
A University of California, Davis study of California rice put numbers on this. It compared each index with total nitrogen uptake at panicle initiation. Yields stopped rising at about 109 kg N/ha of uptake. Drone NDVI saturated at 96 kg N/ha, below that point, while handheld NDVI held to 111 and drone NDRE to 130 (Rehman et al., 2022).
Chart
Nitrogen uptake at which each index saturated
kg N/ha at panicle initiation, California rice, sufficiency-index basis
3. When in the season they work best
A systematic review of drone studies (41 papers) combined three wheat and cotton studies. In those, NDVI saturated shortly after stem elongation, while NDRE kept rising in a near-straight line until spike emergence in wheat. The authors see NDVI as workable for a first nitrogen application, before the canopy closes (Scientific Data, 2024).
4. What each one tells you about nitrogen
The red edge has a closer tie to leaf chlorophyll than red, according to the North Dakota authors. That is why NDRE gets used for nitrogen management. The same review reports NDRE R² values of 0.80 for wheat and 0.67 for cotton against nitrogen uptake, in the three studies it combined from Switzerland, Australia and the United States.
NDVI still has a clear job. It tracks green cover well, which makes it useful for spotting thin stands and weak patches across modern agriculture systems of all kinds.
5. Where you can get each one
Sentinel-2 carries 13 bands: four at 10 m, six at 20 m and three at 60 m (NASA Earthdata). NDVI can use its 10 m red and NIR bands. NDRE relies on red edge bands at 20 m, so each pixel covers four times the ground area. Landsat 8 and 9 list blue, green, red, NIR and shortwave bands at 30 m with no red edge band (USGS), so NDRE is not possible from them.
Timing also matters. The Sentinel-2 pair gives a revisit of five days at the Equator, and clouds can block any given pass. Drones give far finer detail: the UC Davis flights averaged 3.7 cm per pixel.
What field trials show
Results depend on crop, stage, soil and sensor. NDRE does not win everywhere, so it helps to look at the numbers.
Corn in North Dakota
The study above ran nitrogen rate trials at 15 sites in 2013 with two ground sensors. The fits below use each reading divided by growing degree days (the authors’ INSEY value), not the raw reading. At V12 on medium-textured, conventional-till soils, red edge explained 58% of yield variation and red explained 47% on the Crop Circle sensor. On high-clay soils, the fit was weak for both, and on the GreenSeeker sensor red did better there at V12 (20%, against 4% to 6% for red edge). On the GreenSeeker sensor, the 710 nm red edge band beat 735 nm.
Chart
How well red and red edge readings fit corn yield
r² of INSEY (reading divided by growing degree days) with yield, Crop Circle sensor (670 nm vs 730 nm), conventional-till sites, 2013
Rice
A rice study at two sites in Northeast China, with a handheld sensor, found NDRE explained 69% to 87% of plant nitrogen uptake, while NDVI fell to 51% at heading. Yet for biomass, the same paper found NDRE was no better than NDVI at any stage. Its authors also concluded that using the two default indices together was good enough to diagnose rice nitrogen status (Scientific Reports, 2017).
Corn in a nitrogen rate trial
At the Oakes Irrigation Research Site, North Dakota State University reported that grain yield, chlorophyll meter readings and NDRE all rose with nitrogen rate in strip-till corn after corn (2014). A single trial like this shows the signal can follow nitrogen in one place. It does not set a rate for your field.
NDVI or NDRE: which should you use?
Match the index to the decision. These are starting points drawn from the studies above, not fixed rules.
| Your question | Start with | Why |
|---|---|---|
| Thin or patchy stand | NDVI | Canopy is open and 10 m pixels show more detail |
| First nitrogen pass | NDVI, then NDRE | NDVI works before canopy closure |
| Late nitrogen in corn | NDRE | Red edge did better at V12 in North Dakota |
| Total biomass | NDVI | NDRE was no better in the rice study |
| Dense, closed canopy | NDRE | NDVI compresses into a narrow range |
| Field comparison over time | Both | Two signals are easier to cross-check |
What about water stress, pests and yield forecasts?
Both indices can show that part of a field has changed. Neither tells you why. A low patch might be dry soil, compaction, disease, insects or nitrogen shortage. Purdue makes a similar point about chlorophyll meters in corn: so many factors can influence greenness that readings need calibrating in each field. Walk the low spots and take soil or tissue samples before acting.
The same caution applies to yield forecasts. In the North Dakota work, sensor fit with yield ranged from weak to moderate, and it varied by soil and tillage. Treat any index map as a guide to where to look, not a yield number. The same maps can support organic farming too, since they measure the crop and not the input used.
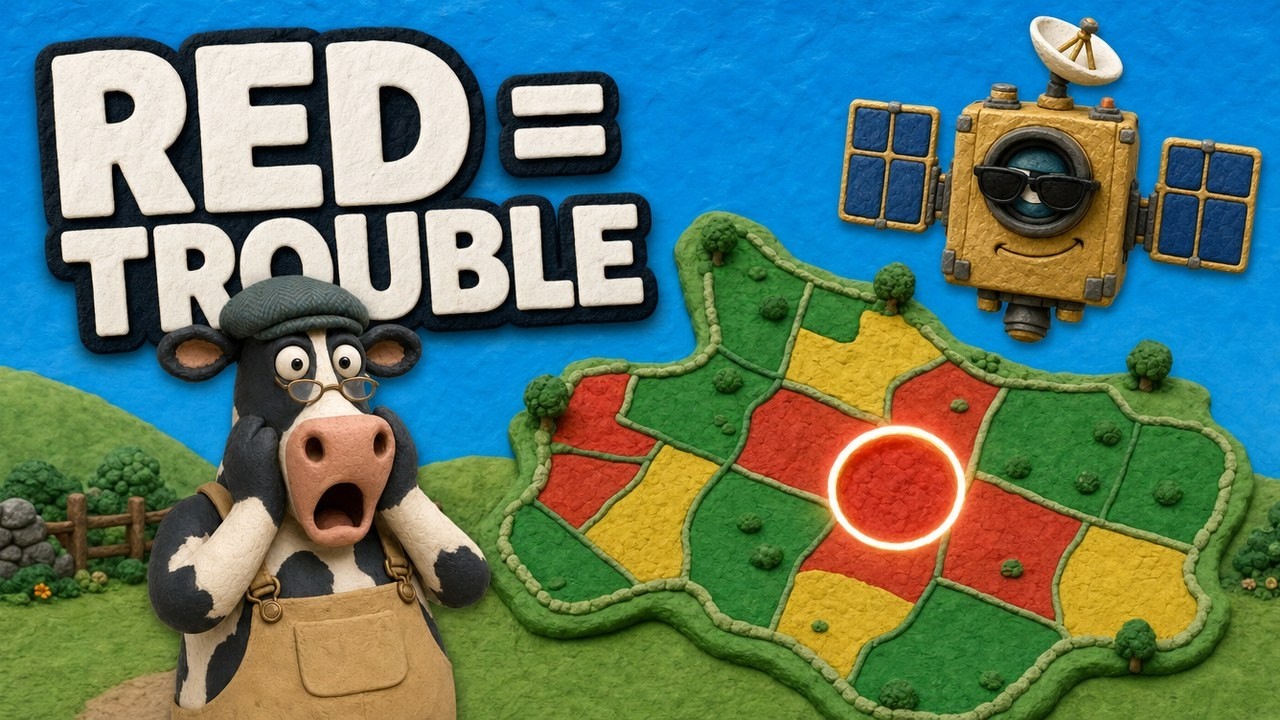
▶ How satellite NDVI maps show crop stress across a large farm. · 4:09
Work out NDRE from your own readings
Enter reflectance values from your sensor or image export, on a 0 to 1 scale. The calculator returns both indices and compares your NDRE with a well-fertilized reference strip.
Purdue describes the reference strip idea for a chlorophyll meter in corn: three to five strips per field, 6 to 12 rows wide, given 10% to 25% more nitrogen than usual. For that meter, a reading below 95% of the strip signals a likely response to more nitrogen. That cut-off belongs to the meter, so do not apply it to NDRE without local calibration. Follow local rules and get agronomic advice before changing fertilizer rates.
Try the numbers for your own farm below.
Calculator
What are NDRE and NDVI for your readings?
Enter your own reflectance values on a 0 to 1 scale.
- NDVI for this reading: 0.84
- NDRE as a share of reference strip: 98 %
Example values only, not benchmarks or targets. The result is plain arithmetic from your inputs; no cut-off is built in. The reference value is whatever you read on your own well-fertilized strip.
How to read an NDRE map in five steps
- Check the date and clouds. Discard any pass with cloud or haze over the field.
- Compare within one field. Look for zones that differ from the rest, not for one magic value.
- Check the stage. Early in the season, bare soil pulls the values down.
- Go and look. Visit one low zone and one high zone, and sample both.
- Compare with last time. A zone that keeps dropping matters more than one low reading.
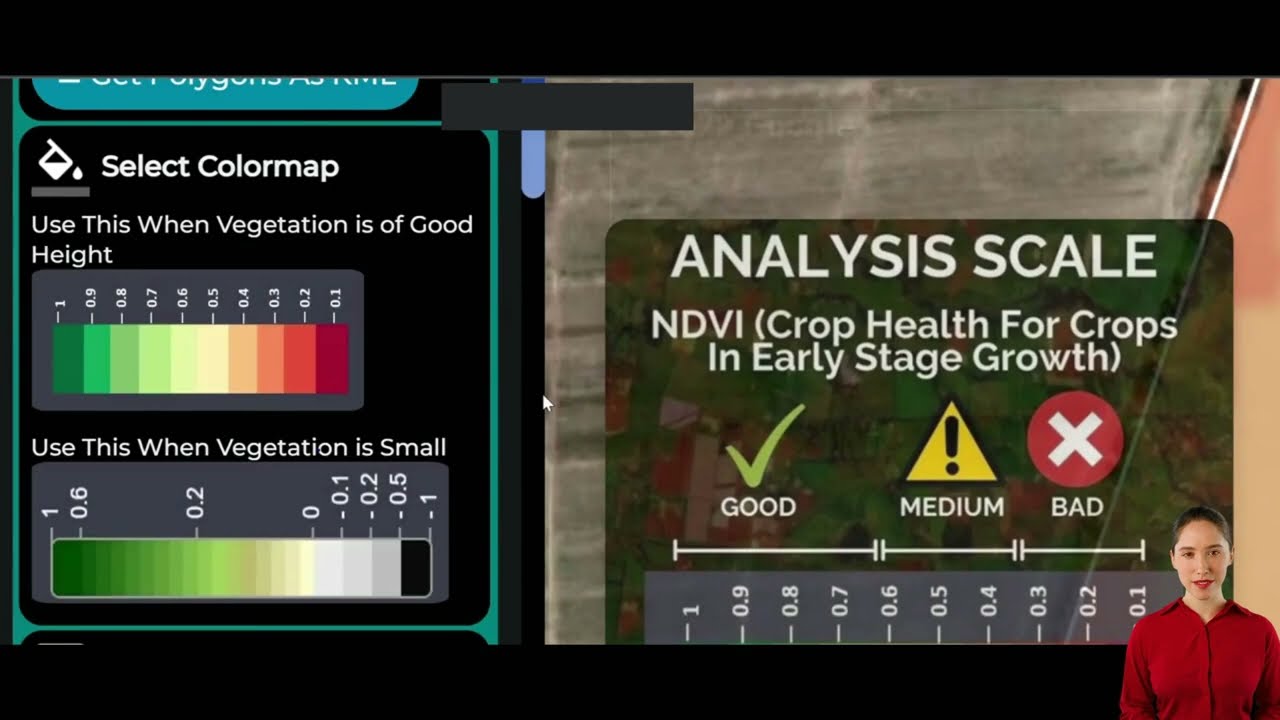
▶ A walkthrough of how to interpret satellite data sets for your fields. · 10:16
Common mistakes when comparing the two
- Comparing raw values across indices. An NDRE of 0.34 and an NDVI of 0.84 can come from the same example reading, because the bands differ. The UC Davis team converted each index to a sufficiency index before comparing them.
- Comparing different sensors directly. In that same study, drone and handheld NDVI saturated at different uptake levels.
- Ignoring residue. The North Dakota authors reported inconsistent V6 readings on long-term no-till sites, and they pointed to ground residue as the likely reason.
Satellite, drone or ground sensor for NDRE?
Each platform trades detail against coverage and effort. The figures come from the sources above.
| Factor | Satellite | Drone | Ground sensor |
|---|---|---|---|
| Pixel size | 20 m red edge (Sentinel-2) | 3.7 cm in the UC Davis flights | Reading per pass or plot |
| Repeat | 5 days at the Equator, clouds permitting | When you fly | When you drive or walk |
| Light source | Sunlight | Sunlight | Own light on active sensors |
| Weather limit | Clouds block the view | Wind, rain, flight rules | Field access |
| Best fit | Whole farms, many fields | Trials, problem spots | Strips and plots |
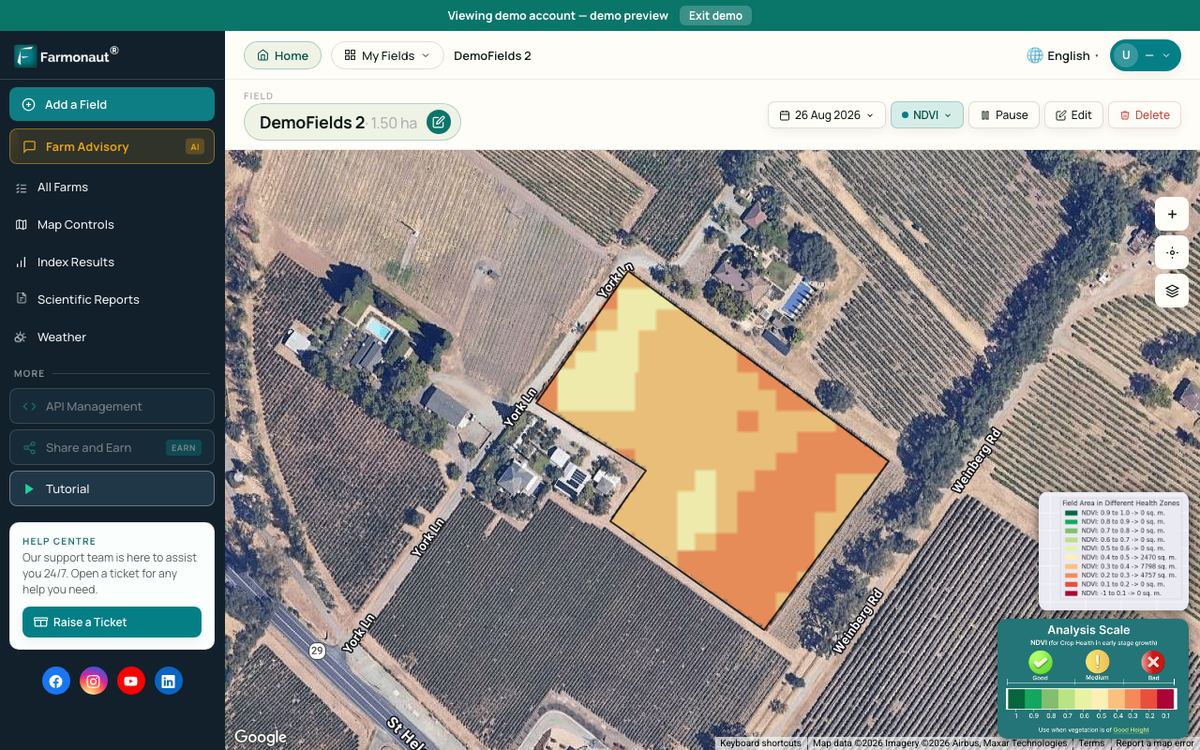
Satellite data needs no flight or field visit to collect, which suits farms with scattered fields. Related reading on satellite-based monitoring covers a different industry but the same idea. Farmonaut offers NDVI and NDRE maps of your own fields on Android, iOS and the web interface, and developers can pull the data through the satellite data API (see the documentation available here).
FAQ
What is the full form of NDRE?
NDRE stands for Normalized Difference Red Edge. It compares near-infrared light with red edge light reflected by a crop.
Is NDRE better than NDVI?
Not in every case. NDRE did better for late-stage corn yield prediction and rice nitrogen uptake in the studies above. NDVI matched or beat it for rice biomass and early corn.
What is a good NDRE value?
The studies here do not set one universal value, as it shifts with crop, stage and sensor. Compare zones in the same field, or compare with a well-fertilized strip.
Can NDRE be calculated from Sentinel-2?
Yes. Use a red edge band such as B5 (about 704 nm) with a NIR band such as B8A (about 865 nm). Both are 20 m bands.
Can NDRE tell me how much nitrogen to apply?
Not by itself. It points to differences in the crop. Rates need local calibration, a reference strip or tissue tests, and local rules and professional advice.
Related pages on our site
See also sustainable farming practices and farm management software, plus a Russian-language piece on farm sector cooperation.
Farmonaut crop monitoring
See NDVI and NDRE for your own fields
Draw your fields once and Farmonaut shows satellite vegetation maps through the season, on web, Android or iOS.



Keep reading
Sources
- Sharma et al., Active-Optical Sensors Using Red NDVI Compared to Red Edge NDVI, North Dakota corn (Sensors, 2015): ncbi.nlm.nih.gov
- Rice nitrogen status diagnosis with RapidSCAN (Scientific Reports, 2017): nature.com
- Rehman, Lundy and Linquist, Comparative Sensitivity of Vegetation Indices in rice, UC Davis (Remote Sensing, 2022): linquist.ucdavis.edu
- ESA Copernicus SentiWiki, S2 Mission: sentiwiki.copernicus.eu
- NASA Earth Observatory, Measuring Vegetation: NDVI and EVI: earthobservatory.nasa.gov
- USGS, What are the band designations for the Landsat satellites?: usgs.gov
- USGS, Landsat Normalized Difference Vegetation Index: usgs.gov
- Brouder and Mengel, Purdue Extension AY-317-W, chlorophyll meter for corn sidedress: extension.purdue.edu
- North Dakota State University, Oakes Irrigation Research Site, Strip-Till Corn on Corn Nitrogen Rate Study (2014): ag.ndsu.edu
- NASA Earthdata, Sentinel-2 Multispectral Imager: earthdata.nasa.gov
- Global dataset for nitrogen-related plant traits using drone imagery (Scientific Data, 2024): pmc.ncbi.nlm.nih.gov
Discussion
Questions, corrections or field experience? Share them below. First-time comments are reviewed before they appear, and your email is never published.
No comments yet. Be the first to add a question or your experience.

 Wild Oak Farm
 KJBN Labs
 SFX
 BACF Africa
 Doodlakine
 Exurbia Geospatial
 FieldZero
 Indico Company
 Kubota
 FFBS
 Jontra
 Tucor

 Licence holder · Niger · Gold
 Licence holder · Nigeria · Gold + lithium
 Client · Tanzania · Gold










