

Reviewed September 2026 against USDA Economic Research Service, USDA NASS, and University of Maryland Extension.
Try it: Run your own numbers →
An agribusiness strategy is the written plan that connects market analysis, diversification, supply chain management, risk management, and technology investment into one operating system for a farm or agricultural enterprise. It matters because the margin between a farm that survives a bad commodity year and one that does not is rarely luck — it is whether that plan existed before the year turned bad. Below, we work through the seven components that make up a complete agribusiness strategy, using current USDA and university extension figures so you can benchmark your own operation against the national picture.
USDA NASS counted 1,865,000 farms operating in the United States in 2025, averaging 469 acres each — down from the mid-20th-century peak, a consolidation trend that makes deliberate strategy, not just production skill, the deciding factor in which operations remain viable.
Summary: What an Agribusiness Strategy Actually Is
Agribusiness strategy is the comprehensive planning and execution of activities across farming, forestry, and allied enterprises to drive growth, profitability, and resilience. It goes beyond production planning into the integration of business functions — production, marketing, finance, and risk — with modern agricultural practice, including the kind of diversified, value-adding operations described in our piece on sustainable farming for snack crops.
For managing agricultural enterprises at any scale — a 469-acre row-crop operation or a diversified specialty farm — the strategy has to answer five questions: what to grow or produce, how to sell it, how to protect against loss, where to invest in technology, and how to stay compliant. In its September 3, 2026 forecast, USDA’s Economic Research Service put 2026 U.S. net farm income at $158.4 billion, down $4.3 billion (2.6%) from 2025 in nominal terms and 5.5% after inflation, while production expenses rose (USDA ERS farm income forecast). That single number — income essentially flat to down while costs climb — is the reason agribusiness strategy has shifted from “how do we grow more” to “how do we protect margin.”
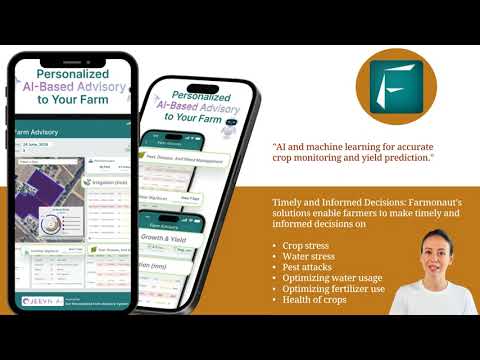
Farmonaut supports this shift with precision agriculture technology: satellite-driven crop health monitoring, AI-based advisory, blockchain traceability, and sustainability reporting, built to make agribusiness planning tools that were once enterprise-only accessible to operations of any size.



Key Components of an Agribusiness Strategy
A working agribusiness strategy is built from seven interlocking components, plus a compliance layer that touches all of them. This is the same structure we use when advising on modern agribusiness management more broadly, narrowed here specifically to strategic planning and growth:
- Market Analysis and Demand Forecasting
- Diversification and Value Addition
- Supply Chain Optimization
- Risk Management in Farming
- Technology and Sustainability Investment
- Strategic Partnerships and Collaborations
- Brand Development and Marketing
- Policy Advocacy and Compliance
1. Market Analysis and Demand Forecasting
Market analysis in agribusiness means tracking price signals, input costs, and demand shifts closely enough to plan production before the season starts, not after. For row-crop operations, the starting point is cost per acre: University of Maryland Extension’s 2025 field crop budgets put conventional-till corn production cost at $747 per acre, soybeans at $439 per acre, and wheat at $497 per acre (UMD Extension field crop budgets). Any market analysis that doesn’t start from your actual per-acre cost structure is guessing at breakeven.
- Strategic insights: Studying demand trends and price movement aligns planting and marketing decisions with the highest-probability return, not just the highest historical yield.
- Forecasting: Data-driven demand forecasting reduces overproduction risk and keeps input purchasing aligned with realistic sales volume.
- Cost-basis planning: Comparing your cost per acre against regional extension budgets shows whether a crop switch actually improves margin or just changes which risk you’re carrying.
Farmonaut’s satellite-based crop health monitoring and AI-driven advisory bring real-time NDVI, soil moisture, and weather data into this planning process, so market decisions are backed by field-level conditions rather than regional averages.
Did you know? Our large-scale farm management solution combines remote sensing, data analytics, and centralized fleet and field management into one view of the operation for planning purposes.

2. Diversification and Value Addition
Diversification in agribusiness spreads risk across crops, markets, or product lines so a single price collapse or weather event doesn’t determine the year’s outcome. In practical terms this means adding a second or third crop, moving into value-added processing (dried fruit, honey, specialty grain), or entering new sales channels alongside a primary commodity.
- Multiple income streams reduce dependency on any one crop’s price cycle.
- Value-added products capture margin that raw commodity sales leave on the table.
- Diversified operations have more room to absorb a bad season in one enterprise while another carries the year.
We use advisory platforms to evaluate optimal crop selection and rotation by soil type, moisture, and market signal — the same data layer that informs which fields are candidates for a diversification move and which are better left in a stable rotation.

3. Supply Chain Optimization
Agricultural supply chain management connects input sourcing, on-farm logistics, and buyer relationships into one system that reduces cost and loss at every handoff. It is a core piece of any agribusiness solution because the margin lost to spoilage, delayed delivery, or poor inventory timing is often larger than the margin gained by better production alone.
We focus on:
- Sourcing quality inputs: matching seed, fertilizer, and crop protection purchases to the cost budgets above rather than to list price alone.
- Inventory management: tracking stock levels against forecast demand to avoid both spoilage and under-supply.
- Supplier and buyer relationships: stable, trust-based networks lower transaction costs and improve access to forward contracts.
Farmonaut’s fleet and resource management tools track logistics and asset geolocation, which cuts delivery overhead and gives a clear audit trail for buyers who require traceability.
Combining these agricultural supply chain management practices with real-time field data doesn’t just improve efficiency — it gives you the documentation trail that institutional buyers and processors increasingly require before they’ll sign a contract.
4. Risk Management in Farming
Risk management in farming means identifying weather, price, and operational exposure before it becomes a loss, then having a specific plan for each. USDA’s Economic Research Service adoption survey (2023) found that among large-scale crop farms, 70% used GPS guidance systems, 68% used yield monitors and soil mapping, 45% used variable-rate technology, and just 12% used drones (USDA ERS precision agriculture adoption report). That gap between GPS adoption (70%) and drone adoption (12%) is a useful proxy for where the rest of the industry — smaller and mid-size operations especially — still has ground to make up.
- Identifying risks: analyzing environmental, operational, and financial exposure with real-time field data rather than end-of-season review.
- Diversification: spreading resources across crops, markets, and supply channels, as covered above.
- Insurance: satellite-based crop verification simplifies crop loan and insurance applications, which speeds claims processing and improves access to financing.
- Contingency planning: a written plan for input cost spikes — relevant given USDA’s projection of a 28.8% increase in fuel and oil expenses for 2026 (American Farm Bureau Federation, citing USDA) — and for weather and disaster exposure.
Precision agriculture and remote sensing tools reduce the lag between a developing risk and a decision, which is usually where the largest avoidable losses occur.
5. Technology, Sustainability, and Agribusiness Planning
Agricultural sector transformation and growth strategy increasingly runs through technology adoption rather than acreage expansion — the number of U.S. farms has been declining while average size has grown to 469 acres (USDA NASS, 2025), meaning the growth strategy for most operators is doing more with the land already in production. That’s where sustainable agriculture practices and precision technology overlap.
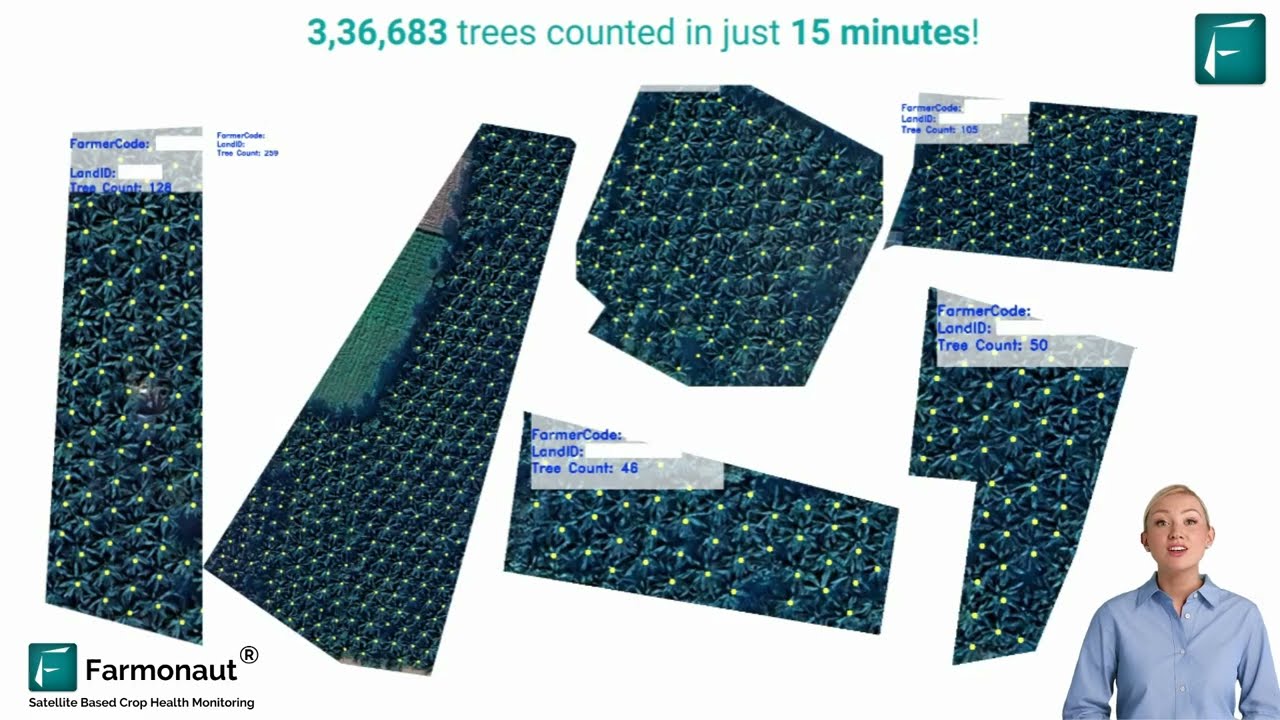
- Adopting precision agriculture technology — satellite imagery, GPS-directed operations, AI-based input recommendations — to raise output per acre while lowering input volume.
- Using carbon footprinting tools to monitor and report environmental impact for both compliance and buyer requirements.
- Applying sustainable land management principles to meet eco-standards and reach environmentally conscious buyers.
Real-time monitoring for soil health, water use, and pest pressure through this kind of platform positions an operation ahead on both regulatory compliance and market preference — two pressures that are only going to tighten, not loosen.

6. Strategic Partnerships and Collaborations
Partnerships within the agricultural ecosystem extend market reach and speed up access to new tools and practices faster than building everything in-house. As an agricultural business strategist, we treat this as a core lever, not a nice-to-have:
- Engaging technology providers for access to data and tools before competitors adopt them.
- Participating in research and knowledge-sharing networks — extension services, grower associations, cooperative research — for practices validated outside your own operation.
- Working with buyers and processors as stakeholders in operational planning, not just as customers at the point of sale.
These relationships are what let a strategy adapt when conditions change quickly — a single input cost shock, like the 28.8% fuel and oil expense increase USDA projects for 2026, moves through partner networks faster than through public data releases.
7. Brand Development and Marketing
Farm marketing strategies distinguish an operation in a market where most buyers can’t tell one bushel of corn from another on sight — brand and traceability are how that distinction gets made. We rely on:
- Digital marketing for direct-to-consumer engagement, especially for value-added and specialty products.
- Storytelling around sustainable practices, backed by verifiable data rather than general claims.
- Blockchain-based traceability to prove supply chain transparency to buyers and end consumers.
- Automated inventory and production tracking to show real-time availability and provenance to retail and wholesale partners.
Buyers who ask for traceability documentation are no longer a niche segment — they’re increasingly standard in contracts with processors and larger retail partners, which makes this a growth strategy issue, not just a marketing one.
Policy Advocacy and Compliance
No agribusiness strategy is complete without a compliance layer running underneath all seven components above. This includes:
- Tracking regulations affecting production, export, sustainability reporting, and traceability requirements.
- Participating in advocacy through grower associations and commodity groups for favorable policy conditions.
- Maintaining compliance with food safety, sustainability, and labor standards through consistent record-keeping and reporting.
Policy conditions change — the specific subsidy, insurance, or reporting requirement in effect this season may not be next season’s — so this piece of the strategy needs a standing habit of checking current USDA and state agricultural agency guidance rather than a one-time review.
How to turn a SWOT analysis into an agribusiness growth strategy
Most extension programmes start strategy work with a SWOT analysis: the farm’s strengths and weaknesses, and the opportunities and threats outside it. University of Wisconsin–Madison Extension then pairs them to produce four kinds of strategy:
- Strength + opportunity: use what the farm already does well to chase a new market, such as selling a high-quality crop direct to a processor.
- Weakness + opportunity: fix a gap that stops you taking an opening, such as adding storage so you can forward-sell.
- Strength + threat: use an advantage to defend against an outside risk, such as low debt carrying you through a price slump.
- Weakness + threat: shrink exposure where you are weak and the risk is real, such as insuring a single-crop operation.
Strategies that show up in more than one box are the ones to rank first, the extension team advises. Most planners work to a three- to five-year window with shorter milestones along the way (Farm Progress).
Each chosen strategy then needs a number attached. For a row-crop farm that usually means cost per acre, expected price and yield, and the margin left over, which is what the calculator further down this page works out.
Strategy Comparison Table
USDA does not publish cost or return figures by strategy type; the closest benchmark is the aggregate net farm income series from USDA ERS, linked above.
Implementing an Agribusiness Planning Process
Turning strategy into results is a matter of process, not intent. Here’s how the seven components above translate into a working annual cycle:
- Continuous market research: revisit cost-per-acre and price assumptions at least quarterly using USDA NASS QuickStats and current extension budgets, since input costs move faster than an annual review can track.
- Technology investment: adopt precision agriculture technology where the ERS adoption data above shows the largest gap to your own operation — for most mid-size farms, that’s variable-rate technology and drone-based monitoring.
- Risk management plans: use geospatial and field-level data for early risk identification rather than waiting for visible crop stress.
- Relationship building: maintain documented, ongoing relationships with suppliers, buyers, and extension contacts.
- Continuous improvement: review cost, yield, and margin data against the prior period on a fixed schedule, not ad hoc.
- Data-driven decisions: use real-time field data and current USDA forecasts, re-checked at each release, rather than one static plan carried through the year.
We recommend Farmonaut’s satellite imagery and weather API (API Developer Docs) for operations that want to pull field intelligence directly into their own planning systems — dashboards, automated alerts, and reporting built around your specific acreage.
Per-Acre Margin Calculator
Use the calculator below with your own expected price and yield to see where your operation sits relative to the 2025 University of Maryland Extension cost benchmarks cited above ($747/acre corn, $439/acre soybeans, $497/acre wheat).
Run your own numbers
Assumptions: production cost figures are 2025 University of Maryland Extension conventional-till budgets and will not match every region or tillage system exactly — pull your own state extension budget for a closer estimate. The calculator excludes land rent/ownership cost, crop insurance premiums, and marketing fees, and does not account for basis, storage, or forward-contract pricing.
Farmonaut Subscription Packages
Affordable precision agriculture solutions are available for farms and agribusinesses of all sizes. Choose a subscription that fits your operational needs, from real-time monitoring to advanced advisory and compliance tools.
Precision Agriculture Technology with Farmonaut
Farmonaut supports modern agribusiness management by putting advanced agricultural innovation and sustainability tools within reach of operations that once couldn't access enterprise-grade systems. Available on Android, iOS, and web, the platform includes:
- Satellite-Based Crop Health Monitoring: real-time NDVI, soil moisture, and weather data for field-level decisions.
- Personalized AI-Driven Advisory (Jeevn AI): crop-specific guidance and management recommendations.
- Blockchain-Based Traceability: proof of product origin and journey for buyer and consumer trust. Learn more about Product Traceability.
- Resource & Fleet Management: vehicle, equipment, and personnel tracking from a single dashboard. Explore Fleet Management.
- Carbon Footprinting: environmental impact tracking for compliance and sustainability-focused buyers. See Carbon Footprinting Tools.
This approach supports efficient agricultural supply chain management, operational optimization, real-time decision support, and sustainability reporting for agribusinesses from individual farms to corporate operations. For a broader look at where the field is headed, see our roundup of farming innovation discussions and advances in agriculture.
FAQs: Agribusiness Strategy, Planning, and Technology
What is an agribusiness strategy?
It's the comprehensive planning and execution of business activities across agriculture and forestry — market analysis, diversification, supply chain management, risk management, technology adoption, and compliance — aimed at profitability, resilience, and sustainable growth. USDA NASS counted 1,865,000 U.S. farms operating in 2025 at an average of 469 acres, a scale where strategy, not just production, determines outcomes.
What does agribusiness planning involve day to day?
Agribusiness planning means setting cost-per-acre benchmarks (UMD Extension put 2025 corn at $747/acre, soybeans at $439/acre, wheat at $497/acre), tracking demand and price signals, and reviewing that plan against actual results on a fixed schedule — quarterly at minimum, given how fast input costs move.
How is managing agricultural enterprises different from managing a single farm?
Managing agricultural enterprises at scale means coordinating multiple crops, revenue streams, and sometimes multiple sites under one strategy, with shared systems for market analysis, supply chain, and risk management rather than separate ad hoc decisions per field.
What's a practical agribusiness solution for smaller operations?
Start with the lowest-cost, highest-adoption technology first — USDA ERS found 70% of large-scale crop farms already use GPS guidance and 68% use yield monitors, versus just 12% using drones — then layer in market analysis and supply chain tools before higher-cost technology.
How does diversification support the growth and development of agribusiness?
Diversification spreads price and weather risk across more than one crop or revenue stream, so a single bad season in one enterprise doesn't determine the year's financial outcome — a core driver of long-term growth and development of agribusiness operations of any size.
How can Farmonaut support my agribusiness strategy?
Farmonaut provides precision agriculture technology, real-time field insights, fleet and resource tracking, traceability, and sustainability reporting across web, Android, and iOS. Start your journey with Farmonaut here.
Conclusion: Building an Agribusiness Strategy That Holds Up
A well-built agribusiness strategy integrates market analysis, diversification, agricultural supply chain management, risk management in farming, technology adoption, and policy compliance into one operating system rather than treating them as separate initiatives. With U.S. net farm income forecast at $158.4 billion for 2026 — down 2.6% from 2025 before inflation and 5.5% after it, per USDA ERS — and fuel and oil expenses projected to rise 28.8% over the same period, the operations that hold their margin will be the ones running this full cycle, not just one or two pieces of it.
The durable part of this strategy doesn't change with the numbers: check USDA ERS's farm income forecast each time it's released (several times a year), check USDA NASS QuickStats for current crop and cost data, and re-run the margin calculator above with your own current price and yield assumptions rather than trusting last season's figures. Farmonaut's precision agriculture tools are built to support that ongoing cycle — streamlining operations, tracking compliance, and keeping field-level data current as conditions change.

 Qzense Labs
 Kubota
 FFBS
FFBS Jontra
 Kalustyan
 Tucor
Tucor Geno
Geno Hayleys Agriculture
 Linx Agritech
 Adinet
 Save Your Soils
 Grandstream Algérie
 XOS Realty
 Geospatial Lab Africa
 Agro La Gándara
