
Unlocking Gold Exploration: A Case Study on Satellite-Based Mineral Detection in Ghana

Executive Summary
This case study explores the application of advanced satellite-based remote sensing techniques for gold prospectivity mapping in a 50-square-kilometer Area of Interest (AOI) in Ghana, conducted between 2020 and 2025. By leveraging multispectral satellite imagery and temporal analysis, the project successfully identified high-potential gold exploration targets, offering a cost-effective and non-invasive approach to mineral exploration. The methodology integrated spectral analysis, Gold Potential Index (GPI) modeling, and temporal stability assessments to deliver prioritized exploration targets. This case study highlights the power of satellite technology in revolutionizing mineral exploration, reducing risks, and guiding efficient field investigations.
Introduction
Project Background and Objectives
Mineral exploration, particularly for gold, is a resource-intensive process that often involves significant financial and logistical challenges. Traditional methods, such as extensive fieldwork and drilling, are time-consuming and costly, especially in remote or geologically complex regions. To address these challenges, this project employed satellite-based remote sensing to streamline gold exploration in a prospective region of Ghana, known for its rich gold deposits within the West African Craton.
The primary objectives of the study were:
- Analyze Multi-Year Satellite Imagery: Process and analyze a four-year time-series of satellite data to map mineral alteration zones associated with gold deposits.
- Map Alteration Assemblages: Identify key hydrothermal alteration zones, including phyllic, argillic, propylitic, and iron oxide signatures, to narrow down exploration targets.
- Develop a Gold Potential Index (GPI): Create a robust, multi-component GPI that integrates seasonal and temporal data to enhance target reliability.
- Prioritize Exploration Targets: Deliver a ranked list of high-potential targets to guide cost-effective field investigations.
By leveraging satellite technology, the project aimed to reduce the financial and environmental footprint of exploration while maximizing the efficiency of identifying viable gold deposits.
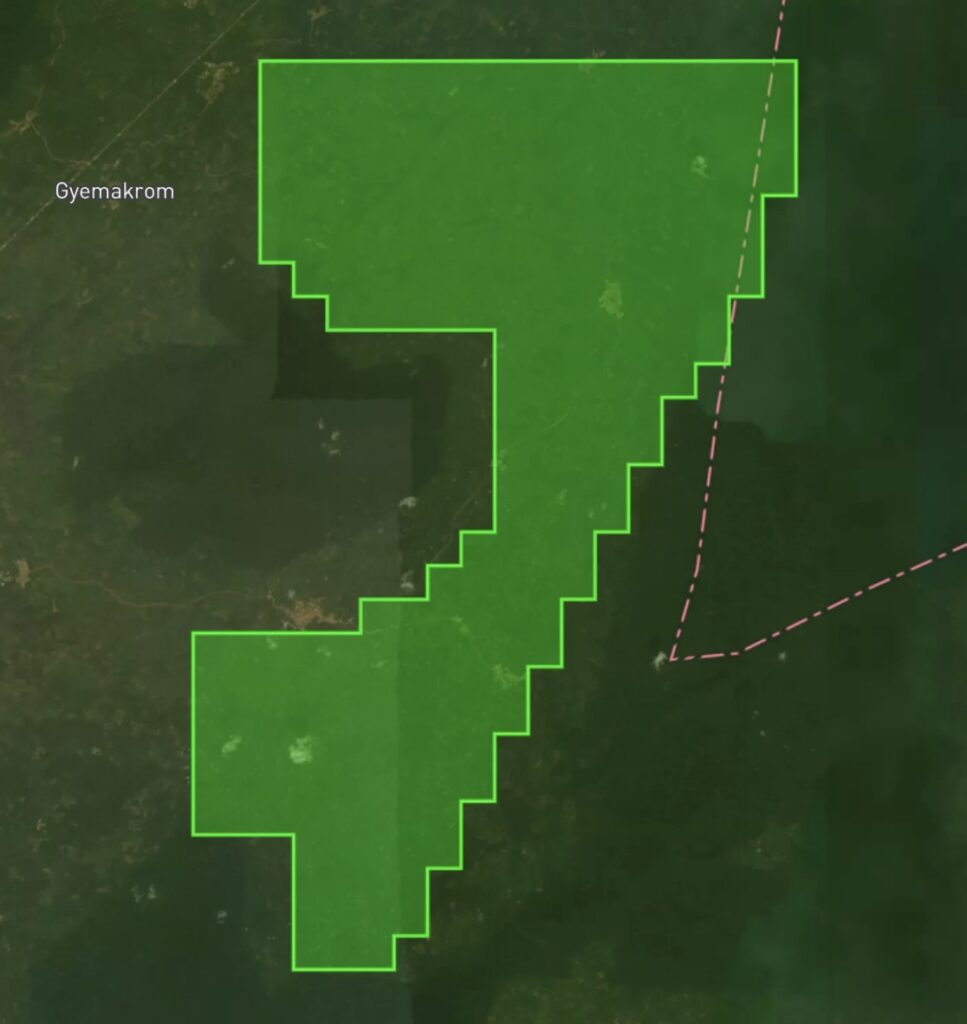
Study Area
The study focused on a 50-square-kilometer AOI in Ghana, a region renowned for its gold endowments. The area’s arid to semi-arid climate and sparse vegetation cover provided ideal conditions for remote sensing analysis, allowing clear visibility of surface geology and mineral signatures. The AOI’s geological setting within the West African Craton, characterized by ancient volcanic and sedimentary rocks, makes it a prime target for orogenic gold deposits.
Data Sources
The analysis utilized a combination of satellite imagery and topographic datasets:
- Satellite Imagery: Landsat 8 and Landsat 9 Operational Land Imager (OLI) data, specifically Collection 2, Level-2 Surface Reflectance products, were used. These datasets are radiometrically calibrated and atmospherically corrected, ensuring high-quality spectral analysis. The imagery covered the period from January 1, 2020, to June 30, 2025, with a spatial resolution of 30 meters.
- Digital Elevation Model (DEM): The Shuttle Radar Topography Mission (SRTM) 1 arc-second dataset (approximately 30-meter resolution) provided terrain information, including elevation and slope, to refine target identification.
Methodology
The methodology was designed to be systematic, repeatable, and transparent, ensuring reliable and actionable results. It comprised five key stages:
1. Data Pre-Processing
High-quality data is the cornerstone of effective remote sensing analysis. The pre-processing stage involved:
- Image Acquisition: A total of 182 Landsat 8 and 9 scenes were acquired, covering the AOI from January 2020 to June 2025.
- Cloud and Shadow Masking: Rigorous masking was applied to remove cloud- and shadow-affected pixels, ensuring only clear surface observations were used.
- Seasonal Compositing: Pixels were aggregated into two seasonal composites:
- Dry Season Composite (November–May): Optimized for observing rock and soil features with minimal vegetation interference.
- Wet Season Composite (June–October): Useful for detecting geological features influenced by moisture or vegetation contrast.
- Annual and Overall Composites: Median-value composites were generated for each year (2020–2024) and the entire study period to support temporal stability analysis.
This approach ensured that outliers, such as seasonal vegetation or soil moisture variations, were minimized, resulting in high-quality, representative datasets.
2. Spectral Analysis for Alteration Mapping
Spectral analysis was used to identify minerals associated with hydrothermal alteration, a key indicator of gold mineralization. Specific spectral indices were calculated to highlight target minerals:
- Phyllic Alteration Index: (SWIR1 / NIR) – Detects white mica minerals like sericite and illite, common in gold-bearing systems.
- Argillic Alteration Index: (SWIR2 / SWIR1 * Red / Green) – Targets clay minerals such as kaolinite and montmorillonite.
- Iron Oxide Index: (Red / Blue) – Maps iron oxides (e.g., hematite, goethite), often associated with gossans over sulfide deposits.
- Propylitic Alteration Index: (NIR / SWIR1 * Green / Red) – Identifies chlorite and epidote, forming distal halos around deposits.
- Silicification Index: (SWIR2 / SWIR1 * NIR / Red) – Detects silica enrichment linked to quartz veining.
These indices enhanced the visibility of subtle geological features, enabling precise mapping of alteration zones.
3. Gold Potential Index (GPI) Modeling
The GPI model integrated multiple data layers to produce a single prospectivity score:
- Seasonal GPI: Separate GPI scores were calculated for dry and wet seasons using a weighted overlay model. Weights were assigned based on the geological significance of each alteration type in orogenic gold systems:
- Phyllic: 30%
- Argillic: 25%
- Silicification: 20%
- Propylitic: 15%
- Iron Oxide: 10%
- Temporal Stability Analysis: The Coefficient of Variation (CoV) was calculated for each pixel across annual composites to assess signal consistency. Low CoV values indicated stable, geological signals, while high values suggested transient features (e.g., vegetation or agricultural activity).
- Combined GPI: The final GPI blended dry season (60% weight) and wet season (40% weight) scores, multiplied by a temporal stability weight to prioritize persistent anomalies.
This multi-component approach ensured that only high-confidence targets were selected for further investigation.

4. Target Identification and Filtering
Targets were identified by applying thresholds to the GPI scores and filtering based on terrain characteristics derived from the SRTM DEM. Elevation and slope data excluded topographically unsuitable areas, such as steep slopes or low-lying regions unlikely to host gold deposits.
5. Anomaly Characterization and Prioritization
High-potential anomalies were characterized based on four metrics:
- Alteration Intensity: Average GPI score within the anomaly.
- Physical Size: Area of the anomaly in hectares.
- Geological Confidence: Temporal stability of the signal.
- Seasonal Contrast: Difference between dry and wet season GPI scores.
These metrics were combined into an enhanced prioritization score, enabling a ranked list of exploration targets.
Results
The methodology produced a series of prospectivity maps and a prioritized list of exploration targets.
Prospectivity Maps
The primary deliverable was the Final Gold Anomaly Map, which displayed prioritized anomaly polygons overlaid on a true-color satellite composite of the AOI. These polygons represented high-potential targets that passed spectral, temporal, and terrain-based filters. The map provided a clear spatial context for exploration planning, highlighting areas with the highest likelihood of gold mineralization.
Key Findings
- Anomaly Distribution: The identified anomalies were non-random, suggesting structural controls on mineralization, such as regional faults or shear zones, which are typical conduits for gold-bearing fluids.
- High-Priority Targets: A ranked table of anomalies was provided, with each target assigned an enhanced prioritization score based on alteration intensity, size, temporal stability, and seasonal contrast.
Discussion
Interpretation of Results
The non-random distribution of anomalies indicates a strong geological basis for the identified targets. The alignment of high-potential zones with potential structural features, such as faults or shear zones, aligns with the characteristics of orogenic gold deposits in the West African Craton. These findings provide a robust foundation for targeted field investigations, reducing the need for broad, costly surveys.
Strengths of the Methodology
The methodology’s reliability is underpinned by two key innovations:
- Temporal Analysis: By analyzing multi-year data and comparing seasonal composites, the model filtered out transient features (e.g., seasonal vegetation or soil moisture changes). The temporal stability metric ensured that only persistent, geological signals were prioritized, reducing false positives and increasing confidence in the results.
- Enhanced Prioritization Score: The multi-criteria scoring system integrated alteration intensity, anomaly size, temporal stability, and seasonal contrast. This nuanced approach provided a commercially actionable ranking, allowing exploration teams to focus on targets with the optimal combination of characteristics.
Limitations
While the methodology is robust, certain limitations should be noted:
- Data Dependence: The analysis relies on the accuracy of satellite and topographic datasets. Errors or inaccuracies in third-party data could affect the results.
- Resolution Constraints: The 30-meter resolution of Landsat imagery limits the detection of small-scale features. Higher-resolution data could enhance precision but may increase costs.
- Geological Complexity: Remote sensing identifies surface expressions of alteration, but subsurface validation through drilling is required to confirm mineralization.
- Environmental Factors: Although seasonal compositing mitigates vegetation and moisture effects, extreme weather or land-use changes could introduce noise in some areas.
These limitations highlight the importance of integrating satellite-based findings with ground-truthing and geophysical surveys for comprehensive exploration.
Conclusion
This case study demonstrates the transformative potential of satellite-based remote sensing in gold exploration. By leveraging multispectral imagery, temporal analysis, and a robust GPI model, the project identified high-potential exploration targets in a 50-square-kilometer AOI in Ghana. The methodology’s ability to filter out transient features and prioritize geologically significant anomalies offers a cost-effective and efficient approach to mineral exploration. These findings provide a actionable roadmap for field investigations, reducing risks and optimizing resource allocation.
For organizations seeking to enhance their exploration strategies, satellite-based techniques offer a powerful tool to unlock mineral potential while minimizing environmental and financial costs. Future advancements in sensor technology and data analytics promise to further refine these methods, making remote sensing an indispensable component of modern mineral exploration.
Call to Action
Ready to revolutionize your mineral exploration strategy? Explore the power of satellite-based remote sensing with advanced analytics. Contact us at [insert generic contact link] to learn how our solutions can help you identify high-potential targets and streamline your exploration efforts.
Keywords: Satellite-based mineral detection, gold exploration, remote sensing, multispectral analysis, gold potential index, Ghana gold deposits, mineral alteration mapping, temporal stability analysis, prospectivity mapping, orogenic gold systems.
