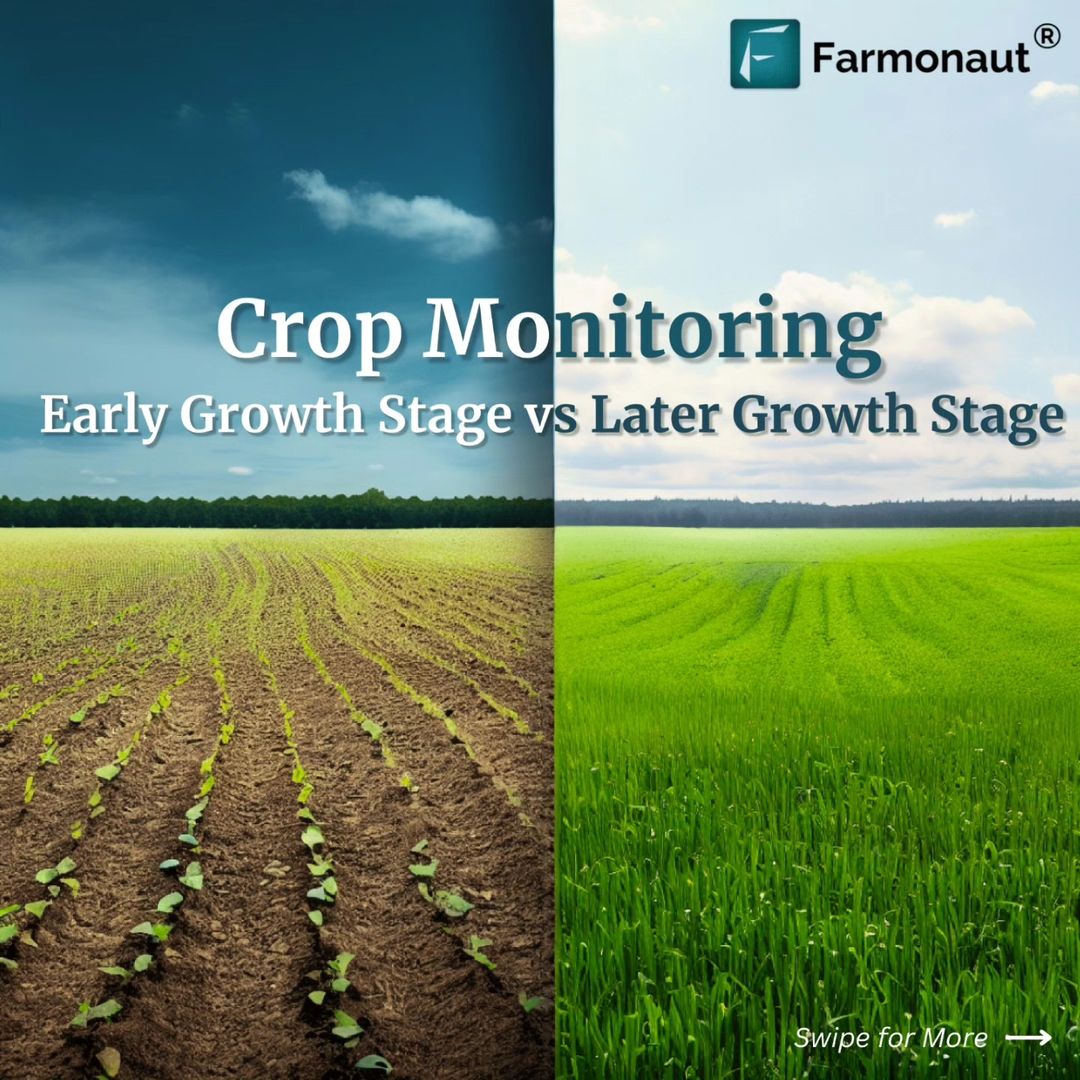
Revolutionizing Agriculture: The Power of NDVI, EVI, and NDRE in Modern Crop Monitoring
In the ever-evolving world of agriculture, staying ahead of the curve is crucial for success. At Farmonaut, we’re proud to be at the forefront of this agricultural revolution, offering cutting-edge solutions that harness the power of satellite technology to transform the way we monitor and manage crops. In this comprehensive guide, we’ll explore how our advanced NDVI, EVI, and NDRE satellite imagery is changing the face of modern agriculture, providing farmers, agribusinesses, and researchers with unprecedented insights into crop health and development.
The Rise of Precision Agriculture
Precision agriculture has emerged as a game-changer in the farming industry, allowing for more efficient use of resources, improved crop yields, and better decision-making. At the heart of this revolution lies the use of advanced technologies such as satellite imagery, which provides a bird’s-eye view of vast agricultural areas with remarkable detail and accuracy.
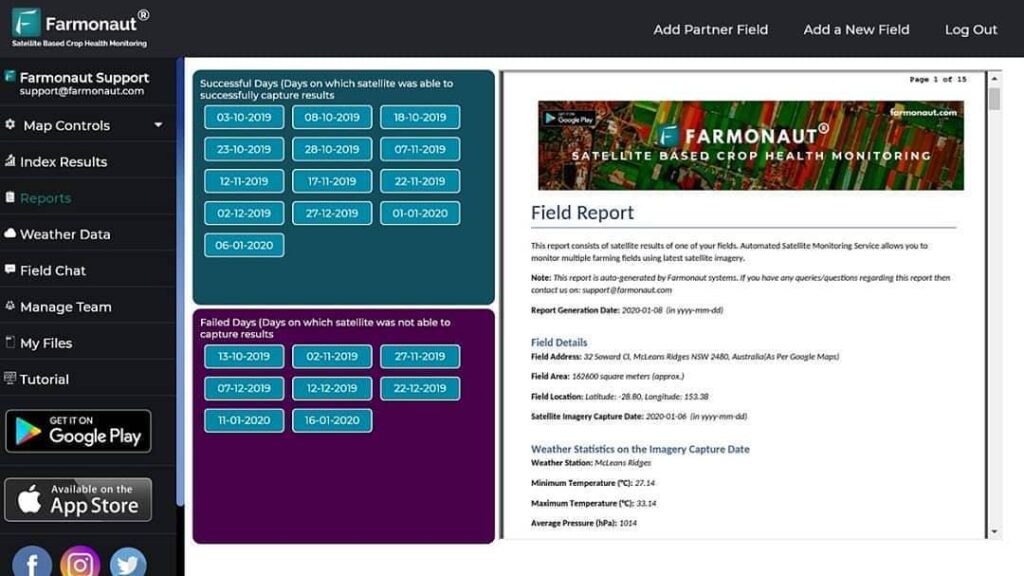
At Farmonaut, we’ve harnessed these technologies to create a powerful web app platform that puts the tools of precision agriculture at your fingertips. Our suite of services includes:
- Real-time crop health monitoring
- AI-based advisory systems
- Blockchain-based traceability
- Resource management tools
Let’s dive deeper into how our platform utilizes NDVI, EVI, and NDRE satellite imagery to revolutionize crop monitoring throughout the growth stages.
Understanding NDVI in Agriculture
NDVI (Normalized Difference Vegetation Index) is a crucial tool in modern agriculture, providing valuable insights into crop health and vigor. As pioneers in the field of satellite-based crop monitoring, we at Farmonaut have integrated NDVI technology into our comprehensive suite of agricultural solutions.
What is NDVI?
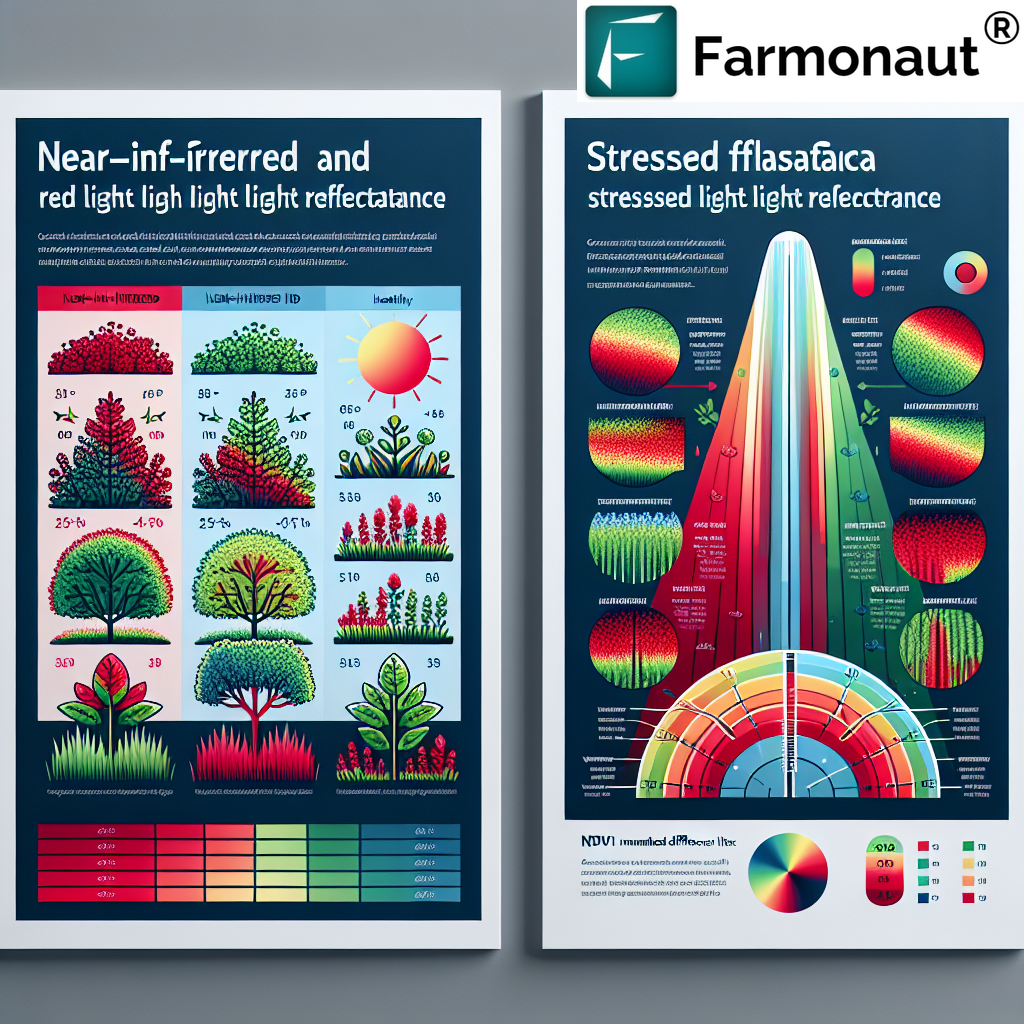
NDVI is a numerical indicator that uses the visible and near-infrared bands of the electromagnetic spectrum to analyze remote sensing measurements and assess whether the observed target contains live green vegetation or not. The NDVI value ranges from -1 to +1, with higher values indicating healthier vegetation.
NDVI Imagery in Crop Monitoring
NDVI imagery provides a visual representation of crop health across large areas. In our Farmonaut platform, we use these images to help farmers and agronomists:
- Identify areas of stress in crops
- Detect early signs of disease or pest infestation
- Monitor crop growth and development over time
- Assess the effectiveness of irrigation and fertilization practices
NDVI Value Interpretation
Understanding how to interpret NDVI values is crucial for making informed decisions in agriculture. Here’s a general guide to NDVI value interpretation:
- -1 to 0: Indicates non-vegetated areas such as water, barren land, or clouds
- 0 to 0.33: Represents unhealthy or sparse vegetation
- 0.33 to 0.66: Indicates moderately healthy vegetation
- 0.66 to 1: Represents very healthy, dense vegetation
Our Farmonaut platform provides easy-to-understand visualizations of these values, allowing users to quickly assess the health of their crops across entire fields.
NDVI Applications in Precision Agriculture
The applications of NDVI in precision agriculture are vast and varied. Some key applications include:
- Crop Health Assessment: NDVI helps in early detection of stress factors affecting crop health, allowing for timely interventions.
- Yield Prediction: By analyzing NDVI data over time, we can help farmers predict potential yields more accurately.
- Variable Rate Application: NDVI maps can guide the application of inputs like fertilizers and pesticides, ensuring they’re used only where needed.
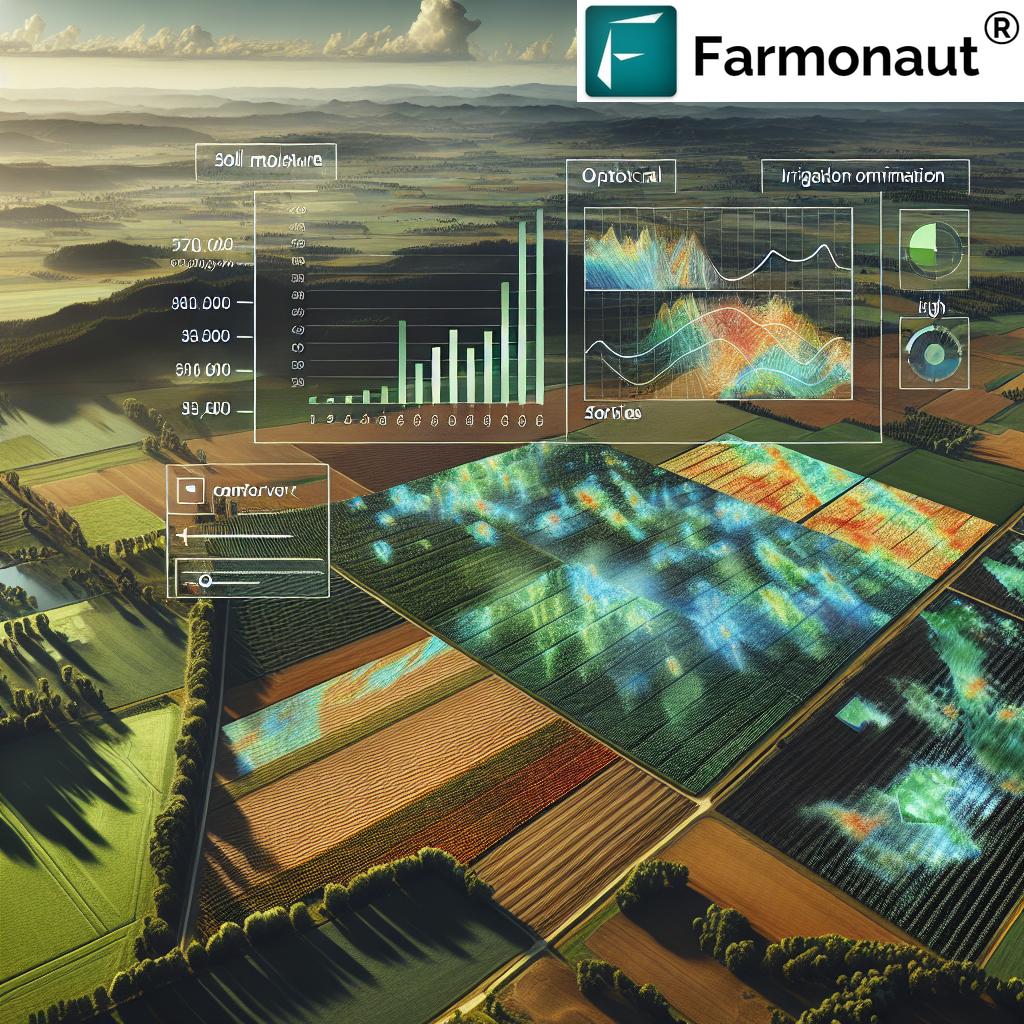
- Irrigation Management: NDVI can indicate areas of water stress, helping optimize irrigation practices.
- Crop Insurance: NDVI data can provide objective evidence of crop conditions for insurance purposes.
At Farmonaut, we’ve integrated these applications into our platform, providing farmers with actionable insights based on NDVI data.
The Power of EVI in Early Growth Stage Monitoring
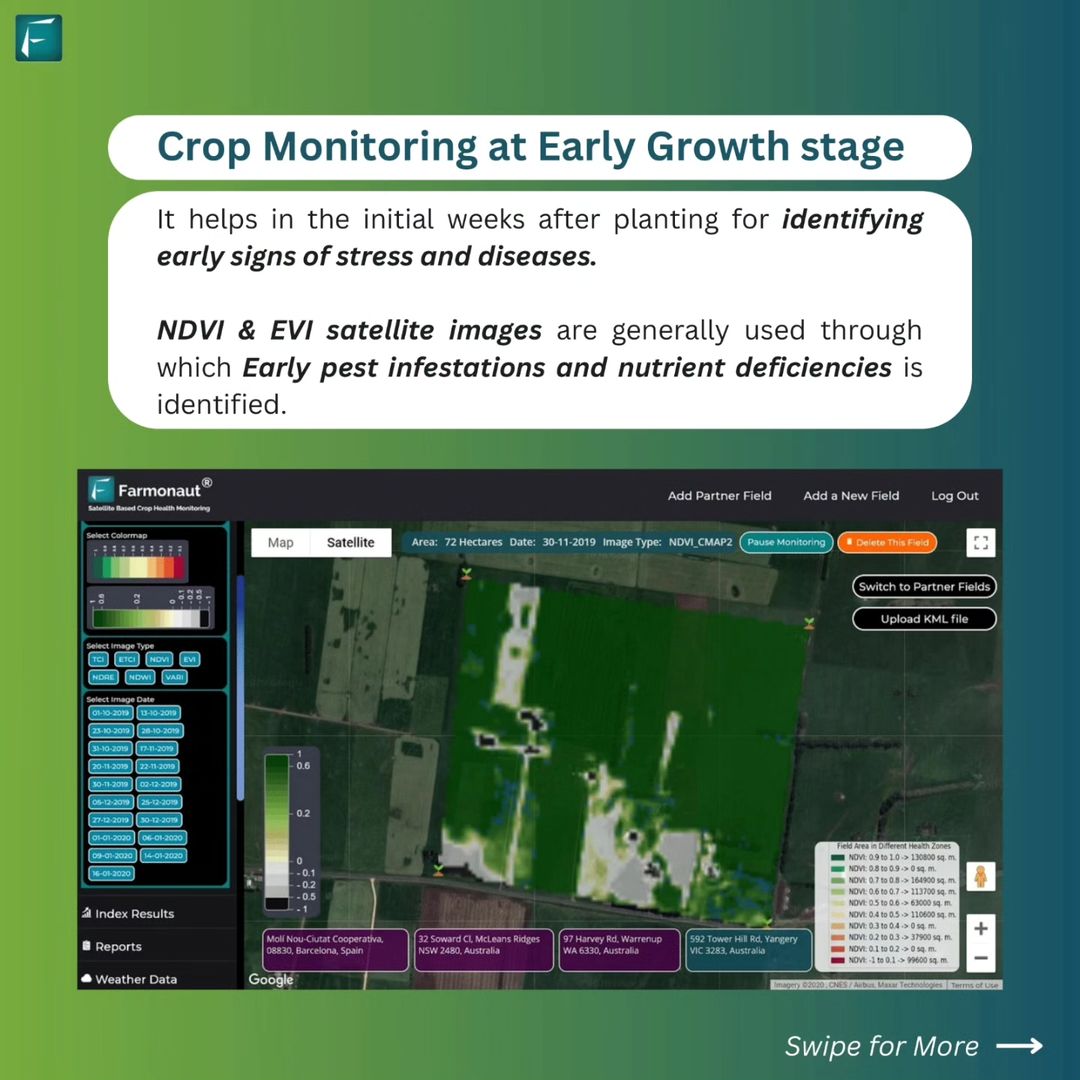
While NDVI is a powerful tool, we at Farmonaut understand that different growth stages require different monitoring approaches. That’s why we’ve incorporated the Enhanced Vegetation Index (EVI) into our platform, particularly for monitoring crops in their early growth stages.
What is EVI?
EVI is an ‘optimized’ vegetation index designed to enhance the vegetation signal with improved sensitivity in high biomass regions and improved vegetation monitoring through a de-coupling of the canopy background signal and a reduction in atmosphere influences.
Advantages of EVI in Early Growth Stage Monitoring
EVI offers several advantages over NDVI, especially during the early growth stages of crops:
- Improved sensitivity to changes in areas with high biomass
- Better performance in detecting plant chlorophyll content
- Reduced influence of atmospheric conditions and soil background
- Enhanced ability to monitor seasonal and inter-annual changes in vegetation
How We Use EVI at Farmonaut
In the early weeks after planting, our platform leverages EVI satellite images to:
- Identify early signs of stress and diseases
- Detect nutrient deficiencies
- Monitor crop establishment and uniformity
- Guide early-season management decisions
By combining EVI with NDVI, we provide a more comprehensive view of crop health during these critical early stages, allowing for timely interventions that can significantly impact final yields.
NDRE: The Key to Late-Stage Crop Monitoring
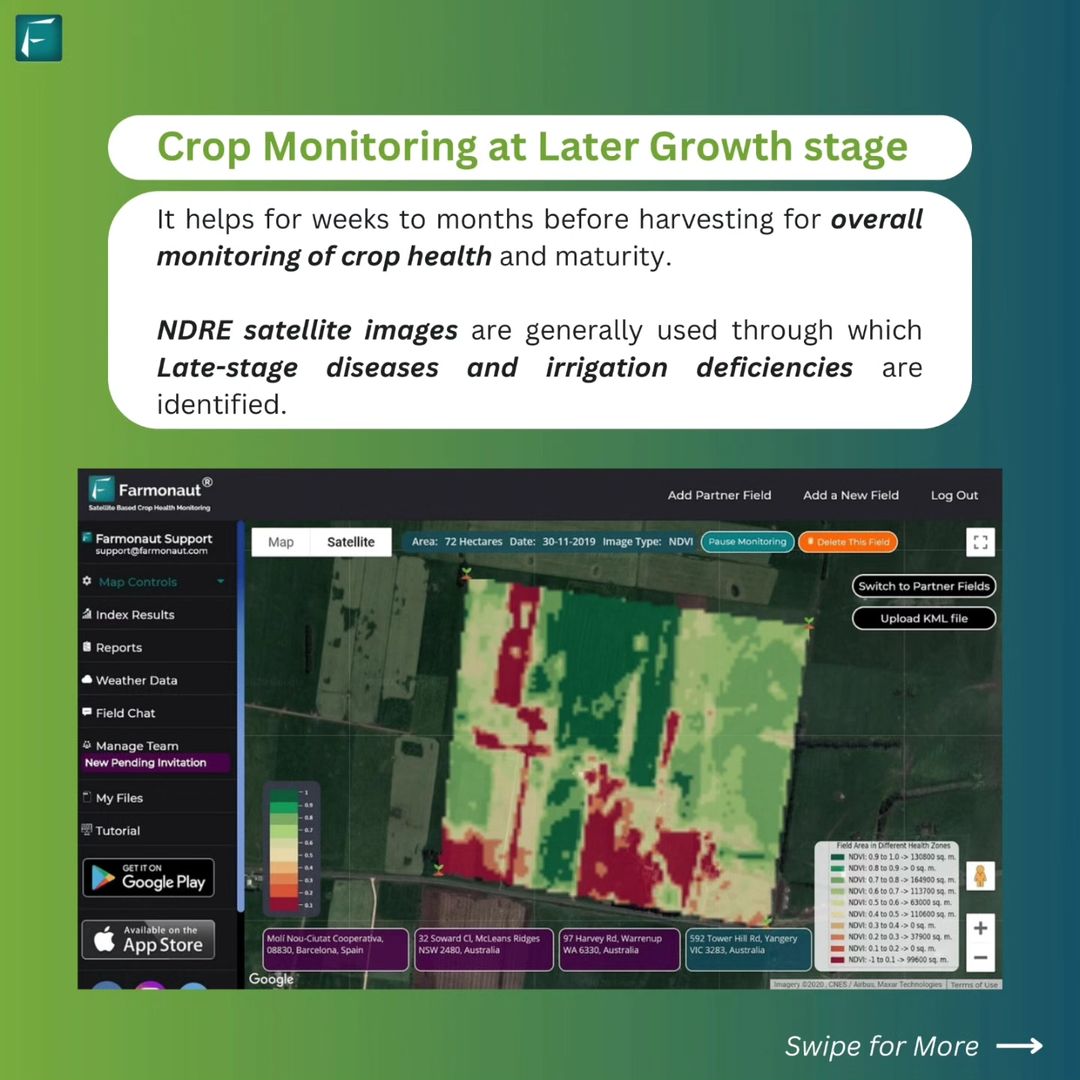
As crops progress through their growth cycle, different monitoring techniques become more effective. This is where the Normalized Difference Red Edge (NDRE) index comes into play in our Farmonaut platform.
Understanding NDRE
NDRE is a vegetation index that uses the red edge band, which is particularly sensitive to chlorophyll content in plants. This makes NDRE especially useful for monitoring crops in their later growth stages when traditional indices like NDVI may become less effective due to saturation.
Benefits of NDRE in Late-Stage Crop Monitoring
NDRE offers several advantages for monitoring crops as they approach maturity:
- Increased sensitivity to variations in chlorophyll content
- Better performance in dense canopy conditions
- Improved ability to detect nutrient stress, particularly nitrogen deficiency
- More accurate yield predictions in the weeks leading up to harvest
How We Utilize NDRE at Farmonaut
In the weeks to months before harvesting, our platform employs NDRE satellite images to:
- Monitor overall crop health and maturity
- Identify late-stage diseases and pests
- Detect irrigation deficiencies that could impact final yields
- Guide late-season management decisions, such as timing of harvest
By incorporating NDRE alongside NDVI and EVI, we provide a comprehensive crop monitoring solution that covers the entire growth cycle, from planting to harvest.
The Farmonaut Advantage: Integrating NDVI, EVI, and NDRE
At Farmonaut, we’ve developed a unique approach that integrates NDVI, EVI, and NDRE data to provide a comprehensive view of crop health throughout the entire growth cycle. This integrated approach offers several key advantages:
- Comprehensive Monitoring: By using different indices at different growth stages, we ensure that farmers have the most relevant and accurate information at all times.
- Early Problem Detection: The combination of NDVI and EVI in the early stages allows for quicker identification of issues, enabling prompt intervention.
- Improved Yield Prediction: NDRE data in the later stages provides more accurate yield estimates, helping farmers make informed decisions about harvest timing and resource allocation.
- Customized Insights: Our AI-powered platform analyzes data from all three indices to provide personalized recommendations tailored to each farm’s unique conditions.
- Historical Analysis: By tracking these indices over time, we help farmers identify long-term trends and make strategic decisions for future growing seasons.
Farmonaut’s Crop Monitoring Solutions: A Cut Above the Rest
When it comes to crop monitoring, not all solutions are created equal. Here’s how Farmonaut’s satellite-based system compares to drone and IoT-based farm monitoring:
| Feature | Farmonaut Satellite System | Drone-based Monitoring | IoT-based Monitoring |
|---|---|---|---|
| Coverage Area | Large scale (hundreds to thousands of hectares) | Medium scale (tens to hundreds of hectares) | Small scale (individual field level) |
| Frequency of Updates | Regular (every 3-5 days) | On-demand (requires manual flights) | Continuous (real-time data) |
| Initial Investment | Low (subscription-based) | High (equipment purchase) | Medium (sensors and network setup) |
| Operational Complexity | Low (automated data collection and analysis) | High (requires trained operators) | Medium (requires maintenance of sensors and network) |
| Data Analysis | Advanced (AI-powered insights) | Moderate (often requires manual interpretation) | Varied (depends on the system) |
| Weather Independence | High (can operate in most weather conditions) | Low (affected by wind, rain, etc.) | High (continuous operation) |
| Scalability | Highly scalable (can easily monitor additional fields) | Moderately scalable (limited by equipment and operators) | Limited scalability (requires additional sensor deployment) |
As you can see, Farmonaut’s satellite-based system offers a unique combination of large-scale coverage, regular updates, low operational complexity, and advanced data analysis, making it an ideal choice for modern, data-driven agriculture.
How to Get Started with Farmonaut
Ready to revolutionize your farming practices with Farmonaut’s advanced crop monitoring solutions? Here’s how you can get started:
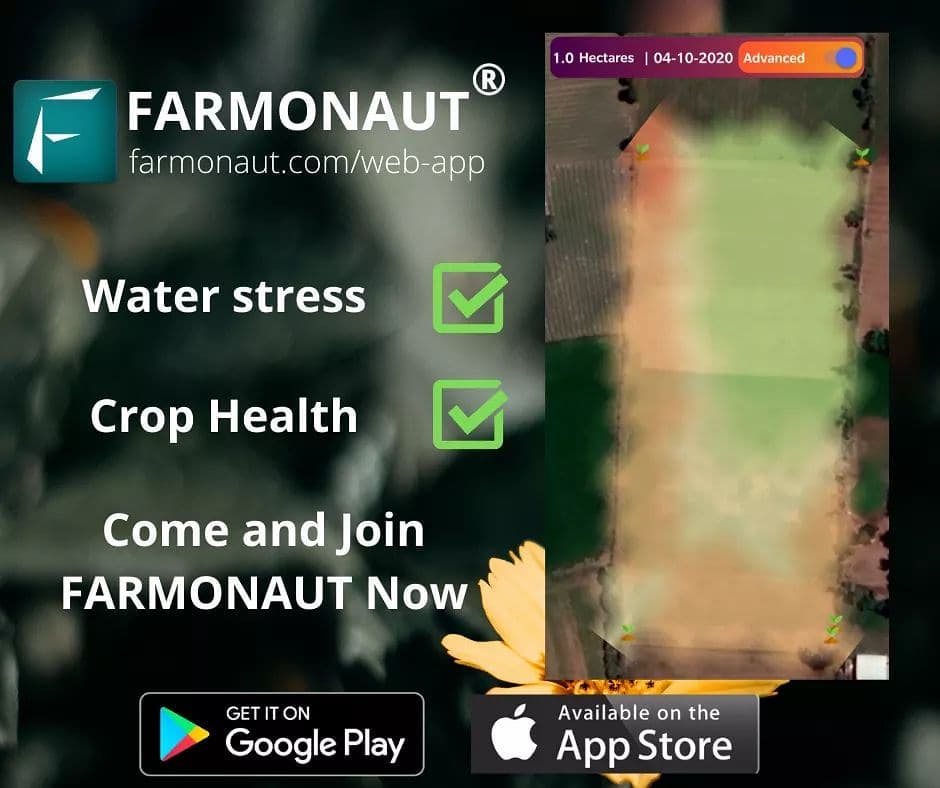
- Web Application: Access our full suite of tools through our web platform. Click here to visit our web app.
- Mobile Apps: Download our mobile apps for on-the-go access:
- API Access: For developers looking to integrate our data into their own systems, check out our API documentation.
- Weather API: Access our comprehensive weather data through our Satellite Weather API.
Subscribe to Farmonaut
Ready to take your farming to the next level? Subscribe to Farmonaut today and start harnessing the power of satellite-based crop monitoring!
Frequently Asked Questions (FAQ)
Q: What is the difference between NDVI, EVI, and NDRE?
A: NDVI (Normalized Difference Vegetation Index) is a general indicator of plant health and is useful throughout the growing season. EVI (Enhanced Vegetation Index) is more sensitive to changes in areas of high biomass and is particularly useful in early growth stages. NDRE (Normalized Difference Red Edge) is especially effective in later growth stages and for detecting variations in chlorophyll content.
Q: How often are satellite images updated on Farmonaut?
A: Our satellite images are typically updated every 3-5 days, providing regular insights into crop health and development.
Q: Can Farmonaut be used for all types of crops?
A: Yes, Farmonaut’s technology is applicable to a wide range of crops, including grains, fruits, vegetables, and cash crops. The platform can be customized to suit the specific needs of different crop types.
Q: How accurate are the crop health assessments provided by Farmonaut?
A: Our crop health assessments are highly accurate, thanks to our use of multiple vegetation indices and advanced AI algorithms. However, we always recommend combining our insights with on-the-ground observations for the best results.
Q: Is technical expertise required to use Farmonaut?
A: No, Farmonaut is designed to be user-friendly and accessible to farmers with varying levels of technical expertise. Our platform provides easy-to-understand visualizations and actionable insights without requiring advanced technical knowledge.
Q: Can Farmonaut integrate with other farm management software?
A: Yes, Farmonaut offers API access, allowing for integration with other farm management tools and software. This enables a more comprehensive approach to farm management.
Q: How does Farmonaut help in reducing environmental impact?
A: By providing precise information about crop health and resource needs, Farmonaut helps farmers optimize their use of inputs like water, fertilizers, and pesticides. This leads to more sustainable farming practices and reduced environmental impact.
Conclusion: Embracing the Future of Agriculture with Farmonaut
As we’ve explored throughout this article, the integration of NDVI, EVI, and NDRE satellite imagery in Farmonaut’s platform represents a significant leap forward in agricultural technology. By providing comprehensive crop monitoring solutions throughout the entire growth cycle, we’re empowering farmers, agribusinesses, and researchers to make more informed decisions, optimize resource use, and ultimately, improve yields and sustainability.
The future of agriculture is data-driven, and at Farmonaut, we’re proud to be at the forefront of this revolution. By making advanced satellite technology accessible and affordable, we’re democratizing precision agriculture and paving the way for a more efficient, productive, and sustainable farming industry.
Whether you’re a small-scale farmer looking to optimize your operations, a large agribusiness seeking to manage vast tracts of land more effectively, or a researcher exploring new frontiers in agricultural science, Farmonaut has the tools and insights you need to succeed in modern agriculture.
Join us in shaping the future of farming. Embrace the power of satellite-based crop monitoring with Farmonaut today, and take the first step towards a more productive, sustainable, and profitable agricultural future.
Ready to get started? Sign up for Farmonaut now and experience the difference that cutting-edge agricultural technology can make for your farm or business.


