Mastering NDWI: Essential Formulas for Landsat 8 and Sentinel-2 Satellite Imagery Analysis
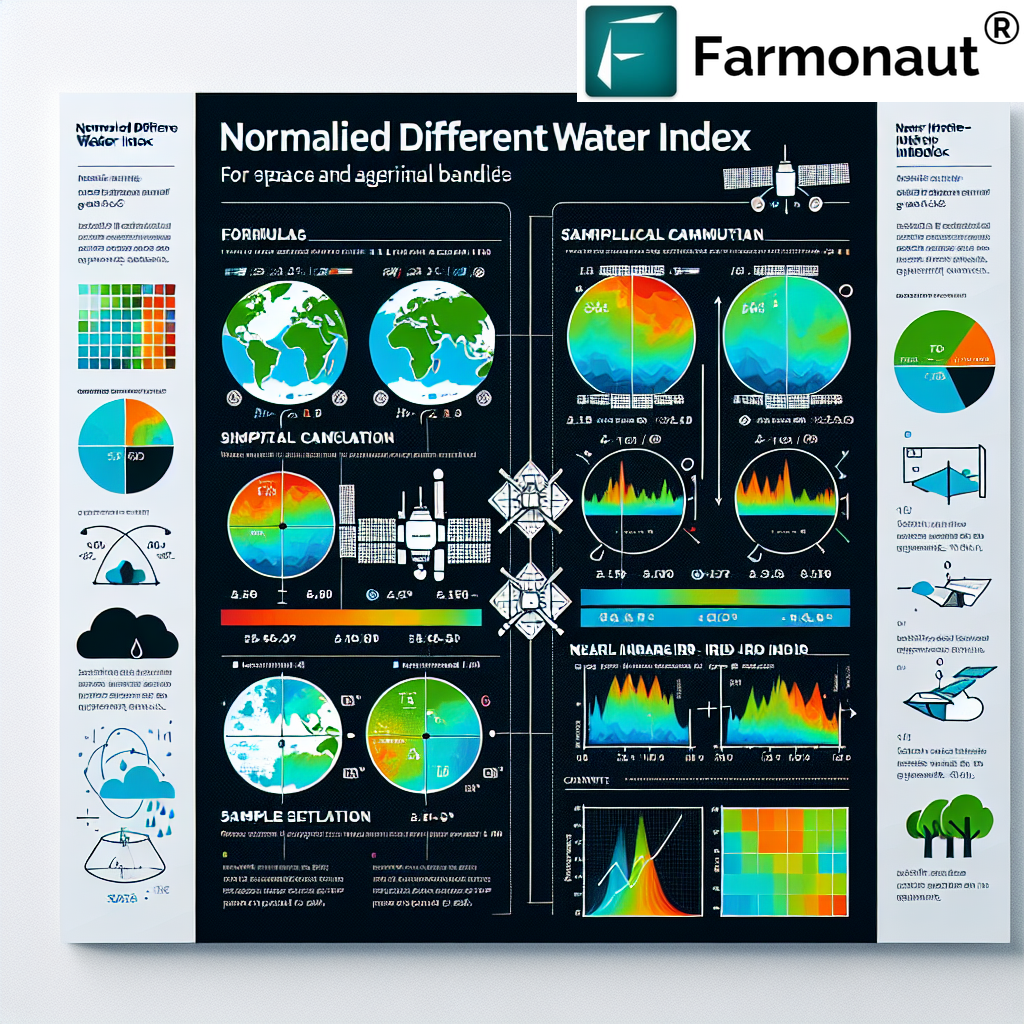
In the ever-evolving field of remote sensing and geospatial analysis, understanding water bodies and their dynamics is crucial for various applications, from environmental monitoring to agricultural management. At Farmonaut, we recognize the importance of accurate water detection and analysis in precision agriculture. One of the most powerful tools in this domain is the Normalized Difference Water Index (NDWI), a remote sensing-derived index that helps identify and monitor water bodies using satellite imagery. In this comprehensive guide, we’ll delve deep into the world of NDWI, focusing on its applications, formulas, and implementation using two of the most widely used satellite systems: Landsat 8 and Sentinel-2.
Table of Contents
- Introduction to NDWI
- The Importance of NDWI in Remote Sensing
- Understanding the Formula for NDWI
- Landsat 8 and NDWI
- NDWI Formula for Landsat 8
- Implementing the NDWI Formula Landsat 8
- Sentinel-2 and NDWI
- NDWI Sentinel 2 Formula
- Applying NDWI to Sentinel-2 Imagery
- Comparing NDWI Implementations: Landsat 8 vs. Sentinel-2
- Applications of NDWI in Agriculture and Environmental Monitoring
- Farmonaut’s Approach to NDWI and Water Management
- Future Trends in Water Index Analysis
- Conclusion
- FAQs
1. Introduction to NDWI
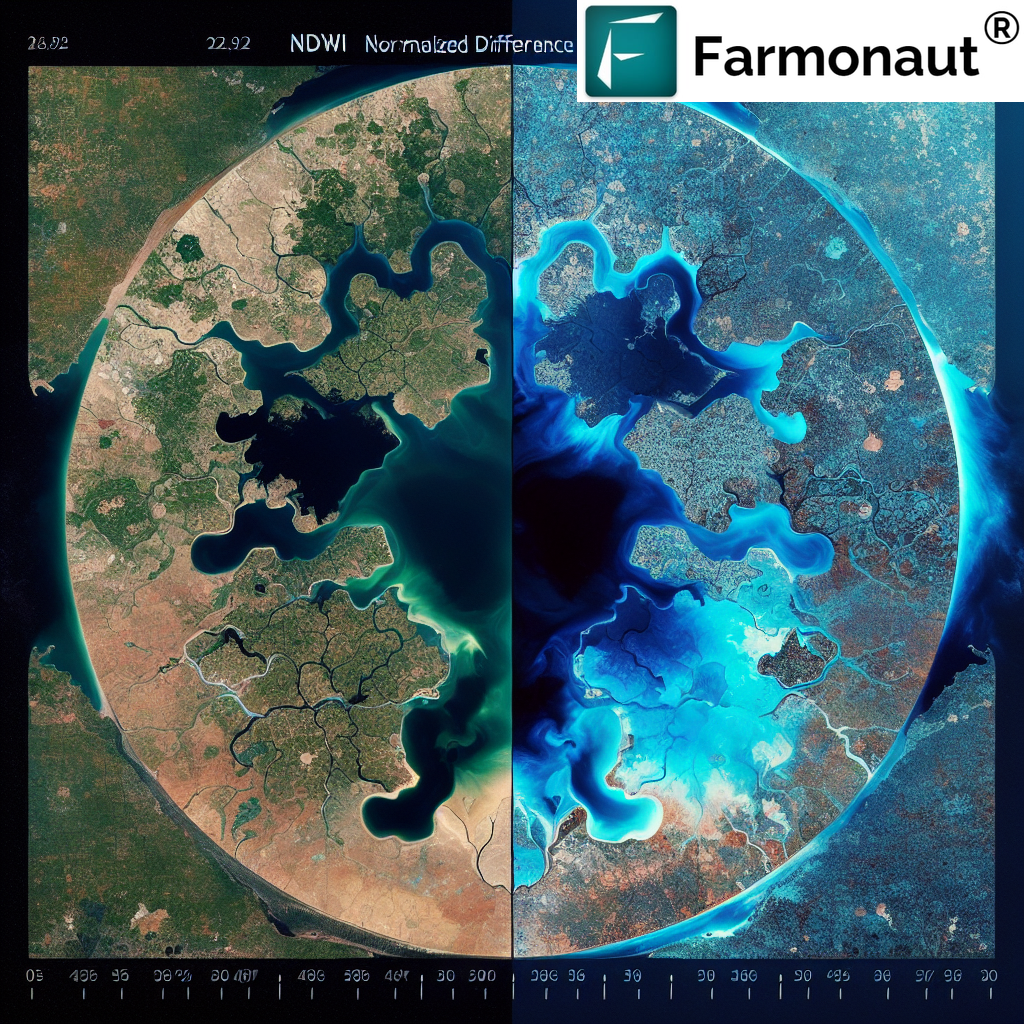
The Normalized Difference Water Index (NDWI) is a satellite-derived index used to delineate open water features and enhance their presence in remotely-sensed digital imagery. Developed by McFeeters in 1996, NDWI has become an essential tool in the realm of water resource management, flood monitoring, and agricultural water stress assessment.
At its core, NDWI leverages the reflectance characteristics of water in different parts of the electromagnetic spectrum. Water absorbs light strongly in the near-infrared (NIR) wavelengths while reflecting more in the green wavelengths. This difference forms the basis of the NDWI calculation.
2. The Importance of NDWI in Remote Sensing
NDWI plays a crucial role in various remote sensing applications:
- Water Body Mapping: NDWI helps in accurately delineating water bodies from surrounding land areas.
- Flood Monitoring: By comparing NDWI values over time, we can detect and monitor flood events.
- Wetland Dynamics: NDWI aids in understanding the seasonal changes in wetland areas.
- Agricultural Water Stress: In precision agriculture, NDWI can indicate crop water stress, helping farmers optimize irrigation.
- Urban Planning: NDWI assists in identifying water features in urban areas for planning and development purposes.
3. Understanding the Formula for NDWI
The general formula for NDWI is:
NDWI = (Green – NIR) / (Green + NIR)
Where:
- Green: Reflectance in the green band
- NIR: Reflectance in the near-infrared band
This formula yields values between -1 and 1, where positive values generally indicate water bodies, and negative values represent non-water features like vegetation or soil.
4. Landsat 8 and NDWI
Landsat 8, launched in 2013, is part of the long-running Landsat program and provides valuable multispectral imagery for Earth observation. Its Operational Land Imager (OLI) sensor offers enhanced spectral and radiometric resolution, making it an excellent tool for NDWI calculation.
NDWI Formula for Landsat 8
The NDWI formula for Landsat 8 is slightly modified to account for its specific band designations:
NDWI = (Band 3 – Band 5) / (Band 3 + Band 5)
Where:
- Band 3: Green band (0.53 – 0.59 μm)
- Band 5: Near-Infrared band (0.85 – 0.88 μm)
Implementing the NDWI Formula Landsat 8
To implement the NDWI formula Landsat 8 in practice, follow these steps:
- Acquire Landsat 8 imagery for your area of interest.
- Ensure proper atmospheric correction and radiometric calibration of the imagery.
- Extract Band 3 (Green) and Band 5 (NIR) from the image.
- Apply the NDWI formula using a GIS or remote sensing software.
- Visualize the results, typically using a color ramp where blue indicates water bodies.
Here’s a simple Python code snippet to calculate NDWI using NumPy:
import numpy as np

def calculate_ndwi_landsat8(green_band, nir_band):
    ndwi = (green_band - nir_band) / (green_band + nir_band)
    return ndwi

# Assuming green_band and nir_band are NumPy arrays
ndwi_result = calculate_ndwi_landsat8(green_band, nir_band)
5. Sentinel-2 and NDWI
Sentinel-2, part of the European Space Agency’s Copernicus program, offers high-resolution multispectral imagery with a more frequent revisit time compared to Landsat 8. Its Multi-Spectral Instrument (MSI) provides 13 spectral bands, making it a powerful tool for various remote sensing applications, including NDWI calculation.
NDWI Sentinel 2 Formula
The NDWI Sentinel 2 formula is similar to Landsat 8 but uses different band designations:
NDWI = (Band 3 – Band 8) / (Band 3 + Band 8)
Where:
- Band 3: Green band (0.560 μm)
- Band 8: Near-Infrared band (0.842 μm)
Applying NDWI to Sentinel-2 Imagery
To apply NDWI to Sentinel-2 imagery:
- Obtain Sentinel-2 Level-2A (atmospherically corrected) imagery.
- Extract Band 3 (Green) and Band 8 (NIR) from the image.
- Apply the NDWI formula using GIS or remote sensing software.
- Visualize and interpret the results.
Here’s a Python code snippet for Sentinel-2 NDWI calculation:
import numpy as np

def calculate_ndwi_sentinel2(green_band, nir_band):
    ndwi = (green_band - nir_band) / (green_band + nir_band)
    return ndwi

# Assuming green_band and nir_band are NumPy arrays
ndwi_result = calculate_ndwi_sentinel2(green_band, nir_band)
6. Comparing NDWI Implementations: Landsat 8 vs. Sentinel-2
While both Landsat 8 and Sentinel-2 provide valuable data for NDWI calculation, there are some key differences to consider:
- Spatial Resolution: Sentinel-2 offers higher spatial resolution (10m for visible and NIR bands) compared to Landsat 8 (30m), allowing for more detailed water body mapping.
- Temporal Resolution: Sentinel-2’s constellation of two satellites provides a revisit time of 5 days at the equator, while Landsat 8 has a 16-day revisit cycle.
- Spectral Resolution: Sentinel-2 has more spectral bands, which can be useful for additional analyses beyond NDWI.
- Data Availability: Both missions offer free and open data access, but Sentinel-2 data is generally more readily available due to its higher temporal resolution.
At Farmonaut, we utilize both Landsat 8 and Sentinel-2 data in our satellite-based crop monitoring system, leveraging the strengths of each platform to provide comprehensive insights to farmers and agricultural stakeholders.
7. Applications of NDWI in Agriculture and Environmental Monitoring
NDWI has numerous applications in agriculture and environmental monitoring:
- Crop Water Stress Detection: By monitoring NDWI values over agricultural areas, we can detect early signs of crop water stress, enabling timely irrigation interventions.
- Drought Monitoring: Changes in NDWI over time can indicate the onset and severity of drought conditions.
- Wetland Mapping: NDWI is effective in delineating wetland boundaries and monitoring their seasonal changes.
- Flood Risk Assessment: By analyzing historical NDWI data, we can identify areas prone to flooding and assess potential risks.
- Water Resource Management: NDWI helps in monitoring water resources, including reservoirs and lakes, aiding in water resource planning and management.
8. Farmonaut’s Approach to NDWI and Water Management
At Farmonaut, we integrate NDWI analysis into our comprehensive satellite-based farm management solutions. Our approach includes:
- Multi-Sensor Integration: We utilize data from both Landsat 8 and Sentinel-2, as well as other satellite sensors, to provide a robust and frequent NDWI analysis.
- AI-Driven Interpretation: Our Jeevn AI advisory system incorporates NDWI data to provide personalized irrigation recommendations and water stress alerts to farmers.
- Historical Analysis: We analyze historical NDWI trends to help farmers understand long-term water patterns in their fields.
- Integration with Other Indices: We combine NDWI with other vegetation indices like NDVI to provide a comprehensive view of crop health and water status.
- User-Friendly Visualization: Our platform presents NDWI data in easy-to-understand maps and charts, accessible through our web and mobile applications.
To experience how Farmonaut leverages NDWI and other advanced satellite-based technologies for precision agriculture, visit our application page or explore our API services for developers.
9. Future Trends in Water Index Analysis
As technology continues to advance, we anticipate several exciting developments in water index analysis:
- Integration of SAR Data: Synthetic Aperture Radar (SAR) data, which can penetrate clouds, will complement optical satellite data for more robust water detection.
- Machine Learning Enhancements: Advanced machine learning algorithms will improve the accuracy of water body detection and classification.
- Hyperspectral Imagery: Future satellite missions with hyperspectral capabilities will allow for more nuanced water quality assessments.
- Near Real-Time Monitoring: Improvements in data processing and transmission will enable near real-time NDWI monitoring for rapid response to water-related events.
- Integration with IoT: Combining satellite-derived NDWI with ground-based IoT sensors will provide a more comprehensive view of water resources.
10. Conclusion
The Normalized Difference Water Index (NDWI) is a powerful tool in the arsenal of remote sensing techniques, particularly valuable for water resource management and agricultural applications. By understanding and implementing the formula for NDWI, specifically the NDWI formula for Landsat 8 and the NDWI Sentinel 2 formula, researchers, environmentalists, and agricultural professionals can gain valuable insights into water dynamics at various scales.
At Farmonaut, we’re committed to harnessing the power of satellite technology, including NDWI analysis, to provide cutting-edge solutions for precision agriculture. Our platform combines advanced satellite imagery analysis with AI-driven insights to help farmers optimize their water usage, improve crop yields, and practice sustainable agriculture.
As we look to the future, the integration of NDWI with other advanced technologies promises even more precise and actionable insights for water management and agricultural decision-making. By staying at the forefront of these developments, we aim to continue providing innovative solutions that empower farmers and contribute to sustainable agricultural practices worldwide.
To learn more about how Farmonaut can help you leverage NDWI and other satellite-based technologies for your agricultural needs, visit our website or download our mobile app:
For developers interested in integrating our satellite and weather API into their applications, check out our API documentation.
FAQs
- What is the main difference between NDWI and NDVI?
NDWI focuses on water content and is used primarily for water body detection, while NDVI (Normalized Difference Vegetation Index) is used to assess vegetation health and density. - Can NDWI be used to assess water quality?
While NDWI primarily detects water presence, it can provide some indications of water quality. However, for detailed water quality assessment, additional spectral indices and in-situ measurements are typically required. - How often should NDWI analysis be performed for agricultural purposes?
For agricultural applications, weekly or bi-weekly NDWI analysis is often sufficient, depending on the crop type and local climate conditions. At Farmonaut, we provide regular updates based on the latest available satellite imagery. - Is cloud cover a problem for NDWI calculation?
Yes, cloud cover can interfere with NDWI calculation as it obstructs the satellite’s view of the Earth’s surface. This is why we use multiple satellite sources and advanced cloud masking techniques to ensure consistent data availability. - How accurate is NDWI in detecting small water bodies?
The accuracy of NDWI in detecting small water bodies depends on the spatial resolution of the satellite imagery. Sentinel-2’s 10m resolution allows for detection of relatively small water bodies, but very small features may still be missed.
How Farmonaut Satellite System Compares to Drone and IoT-based Farm Monitoring
| Feature | Farmonaut Satellite System | Drone-based Monitoring | IoT-based Monitoring |
|---|---|---|---|
| Coverage Area | Large scale (Global) | Limited (Local) | Limited (Point-based) |
| Frequency of Data Collection | Regular (3-5 days) | On-demand | Continuous |
| Initial Setup Cost | Low | High | Medium to High |
| Operational Complexity | Low | High | Medium |
| Data Processing | Automated | Semi-automated | Automated |
| Scalability | Highly Scalable | Limited Scalability | Moderately Scalable |
| Weather Independence | Moderate (Cloud cover can affect) | Low (Weather dependent) | High |
| Data Variety | High (Multispectral) | High (Multispectral, Thermal) | Limited (Specific sensors) |
Experience the power of satellite-based farm monitoring with Farmonaut. Subscribe to our services and transform your agricultural practices:

