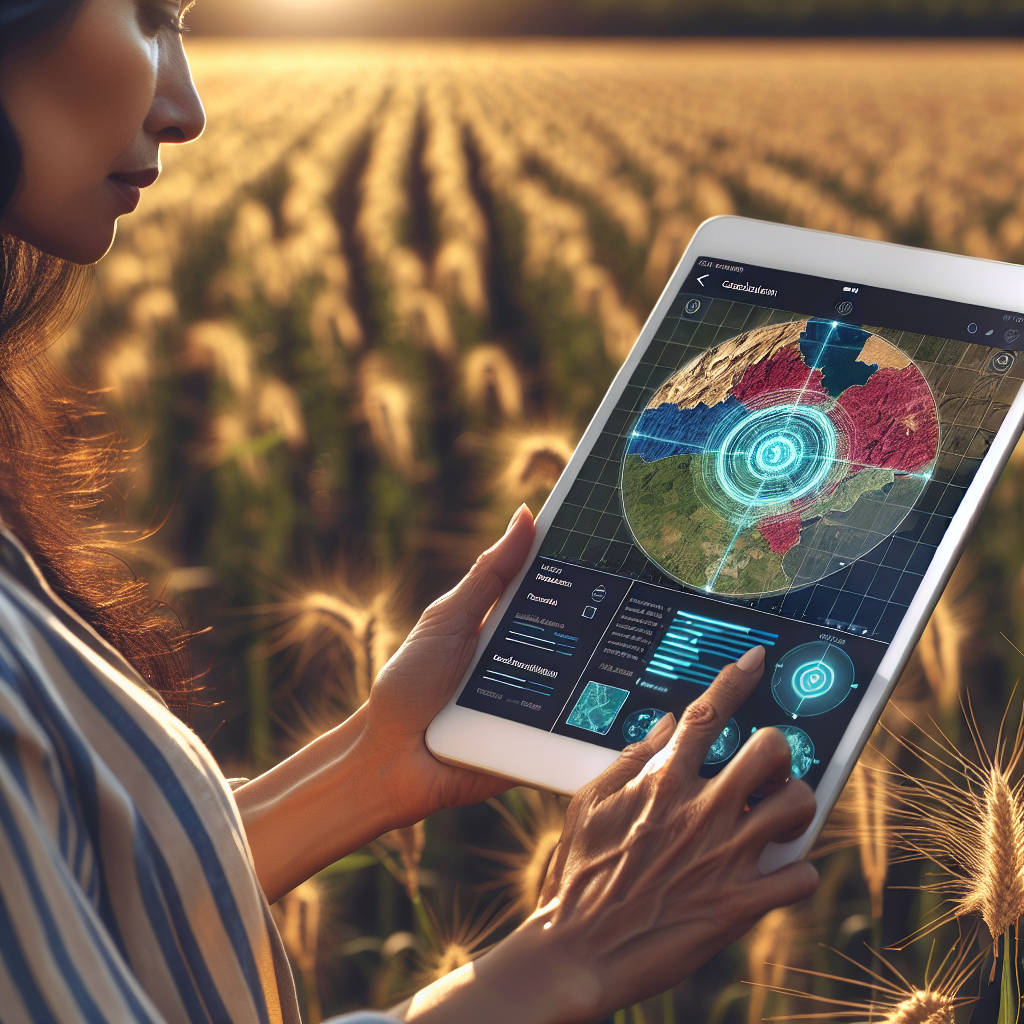
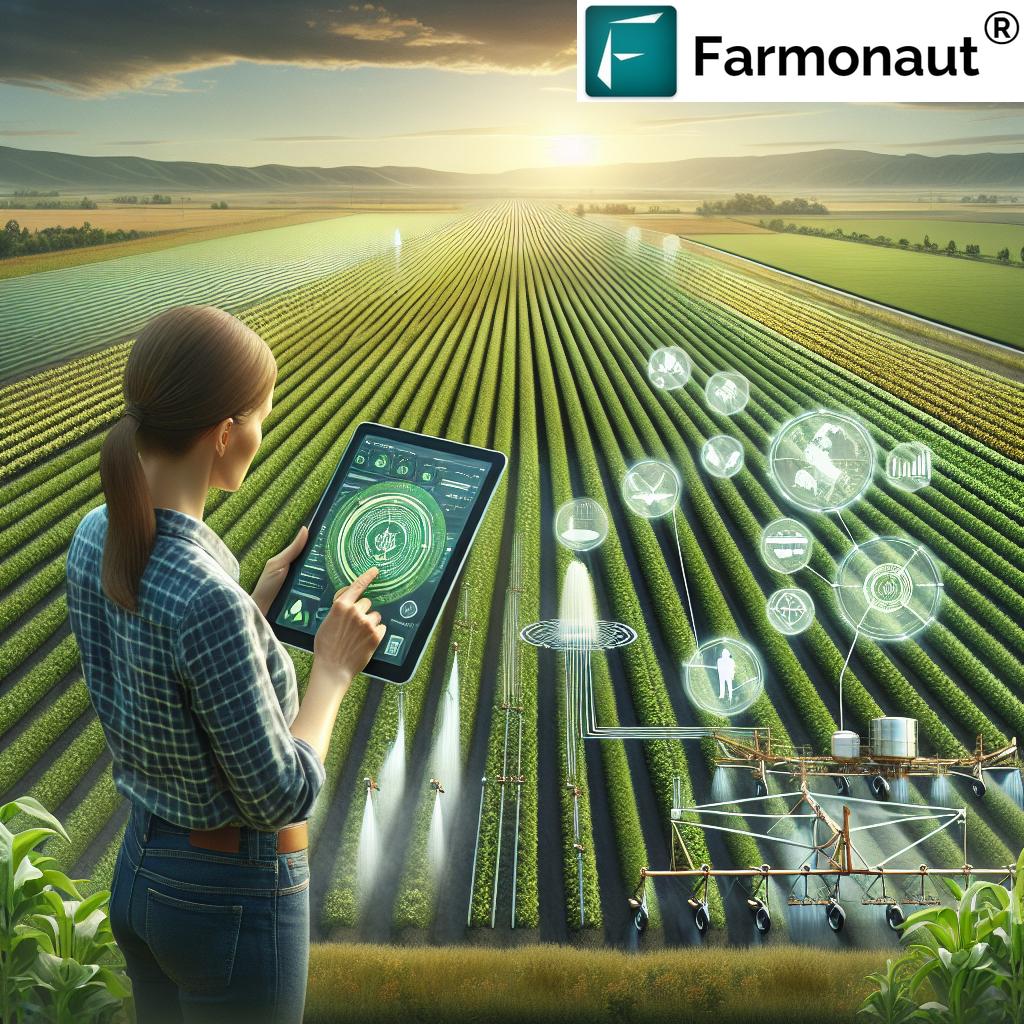
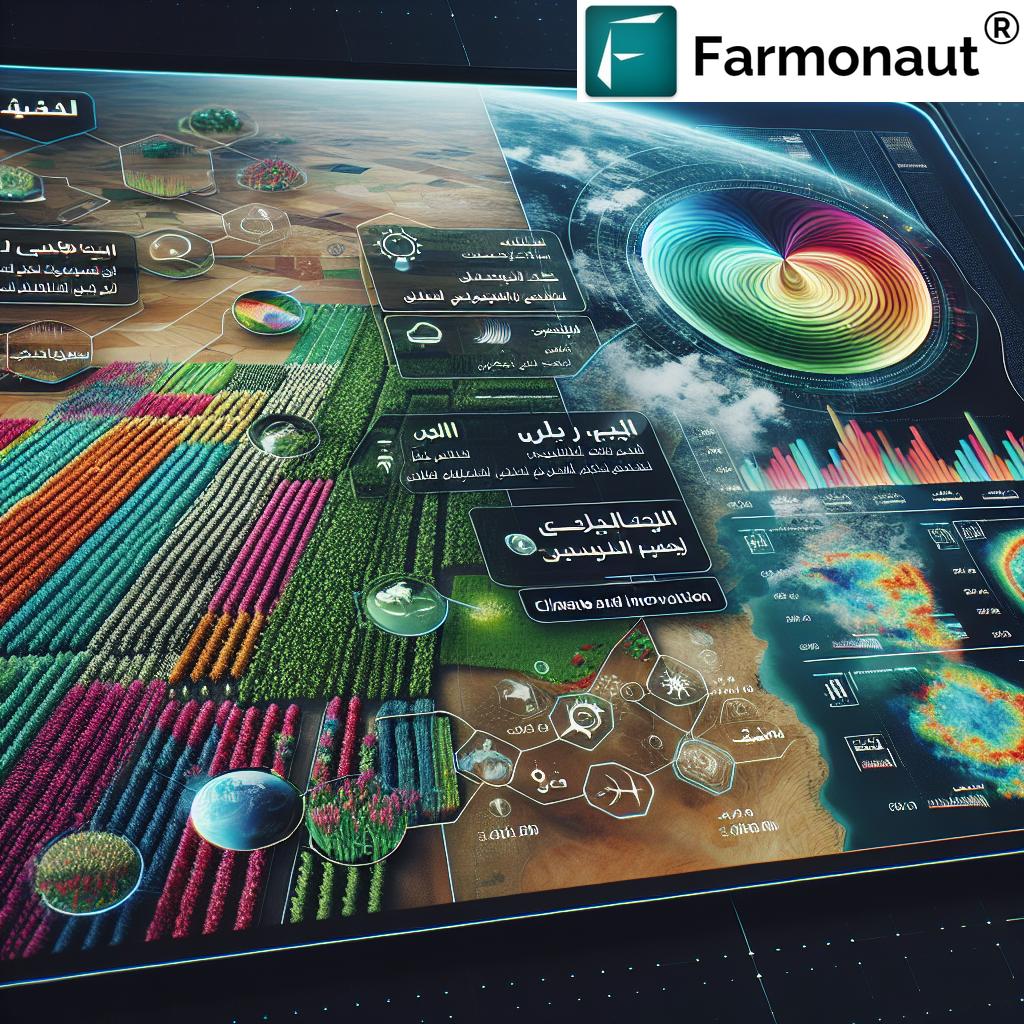
Revolutionizing Agriculture: How Vegetation Indices and AI Enhance Crop Management and Sustainability
“Vegetation indices like NDVI and EVI can assess up to 90% of crop health factors using spectral data from satellite imaging.”
In the ever-evolving landscape of modern agriculture, we find ourselves at the forefront of a technological revolution that promises to transform the way we grow, manage, and sustain our crops. At the heart of this revolution lies the powerful combination of vegetation indices and artificial intelligence (AI), tools that are reshaping precision agriculture and paving the way for a more sustainable future.
As we delve into this fascinating world, we’ll explore how these advanced technologies are not just buzzwords but practical solutions that are already making a significant impact on farms across the globe. From the vast plains of industrial agriculture to the small holdings of family farms, these innovations are leveling the playing field and empowering farmers with data-driven insights previously unimaginable.
Understanding Vegetation Indices: The Foundation of Precision Agriculture
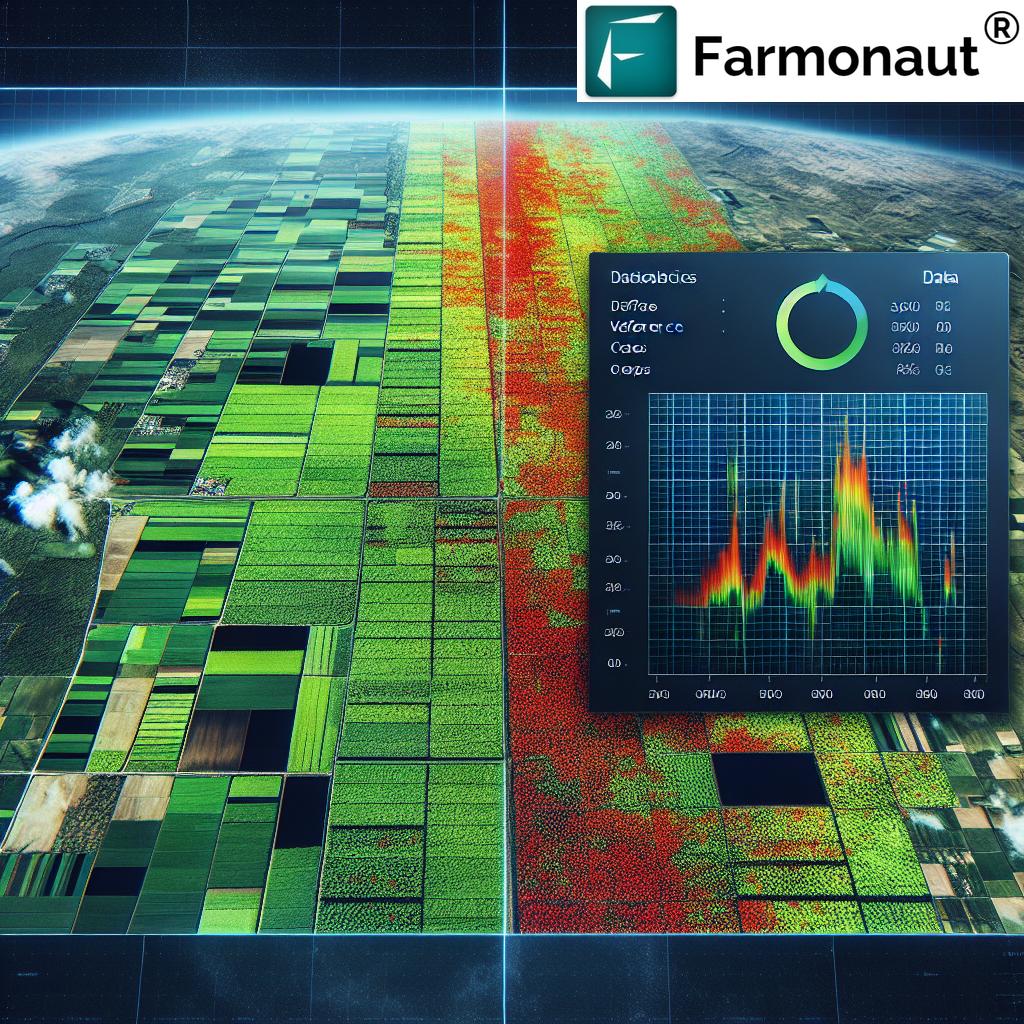
Vegetation indices are mathematical formulations that leverage the unique spectral signatures of plants to provide valuable insights into crop health, biomass, and overall vigor. These indices are not new inventions; they have been around for decades. However, their application in precision agriculture has been revolutionized by advancements in satellite technology, remote sensing, and data analytics.
At their core, vegetation indices exploit the fact that healthy plants reflect and absorb light differently than unhealthy ones or bare soil. By measuring and analyzing these differences across various spectral bands, we can gain a wealth of information about crop conditions without ever setting foot in the field.
The Power of NDVI in Crop Health Monitoring
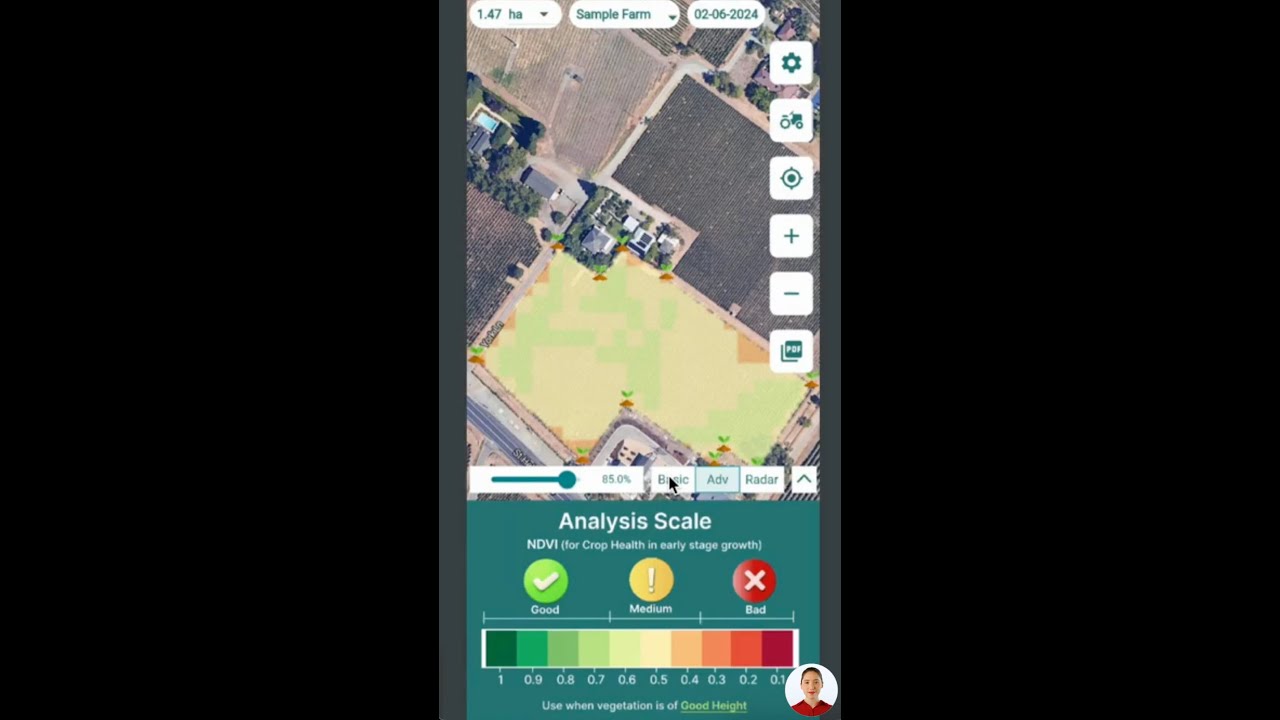
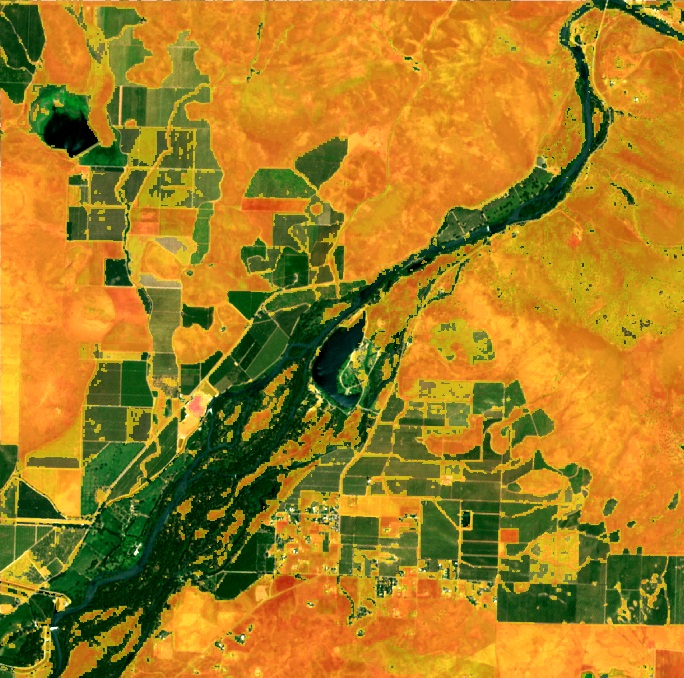
Among the myriad of vegetation indices available, the Normalized Difference Vegetation Index (NDVI) stands out as one of the most widely used and versatile tools in precision agriculture. NDVI capitalizes on the stark contrast between a plant’s reflection of red and near-infrared (NIR) light to provide a quantitative measure of vegetation health and density.
The formula for NDVI is elegantly simple:
NDVI = (NIR – Red) / (NIR + Red)
This calculation yields values ranging from -1 to 1, where higher positive values indicate healthier, denser vegetation, while values close to zero or negative suggest bare soil or water.
The applications of NDVI in agriculture are vast and varied:
- Crop Health Assessment: NDVI provides a quick and accurate snapshot of overall plant health across large areas.
- Yield Prediction: By tracking NDVI values over time, farmers can make more accurate yield forecasts.
- Stress Detection: Early signs of water stress, nutrient deficiencies, or pest infestations can be spotted through changes in NDVI values.
- Irrigation Management: NDVI maps can help optimize irrigation schedules by identifying areas of water stress.
While NDVI is powerful, it’s just one tool in the vegetation index toolkit. Let’s explore some other indices that complement and enhance our understanding of crop conditions.
Beyond NDVI: Exploring EVI, SAVI, and More
As our understanding of plant physiology and remote sensing has grown, so too has our arsenal of vegetation indices. Each index is designed to address specific aspects of vegetation monitoring or to overcome limitations of other indices.
- Enhanced Vegetation Index (EVI): This index improves upon NDVI by incorporating a blue light band to correct for atmospheric interference and soil background noise. EVI is particularly useful in areas with dense canopy cover where NDVI might saturate.
- Soil-Adjusted Vegetation Index (SAVI): SAVI introduces a soil brightness correction factor, making it more accurate in areas with sparse vegetation where soil reflectance can significantly impact measurements.
- Normalized Difference Red Edge (NDRE): By focusing on the red edge portion of the spectrum, NDRE is highly sensitive to chlorophyll content and can detect subtle changes in plant health that NDVI might miss.
- Leaf Area Index (LAI): While not a direct vegetation index, LAI is derived from other indices and provides crucial information about canopy structure and biomass.
Each of these indices brings unique insights to the table, allowing for a more comprehensive understanding of crop conditions when used in combination.
The Role of AI in Enhancing Vegetation Index Analysis
While vegetation indices provide invaluable data, the true revolution in precision agriculture comes from combining this data with artificial intelligence and machine learning algorithms. AI takes the vast amounts of spectral data collected by satellites and transforms it into actionable insights for farmers and agronomists.
“AI-powered vegetation index analysis can improve agricultural productivity by up to 25% through optimized resource allocation and early disease detection.”
Here’s how AI is enhancing the use of vegetation indices in agriculture:
- Pattern Recognition: AI algorithms can identify subtle patterns in vegetation index data that might be imperceptible to the human eye, allowing for early detection of crop stress or disease outbreaks.
- Predictive Analytics: By analyzing historical vegetation index data alongside weather patterns and other variables, AI can make accurate predictions about crop yields, optimal planting times, and potential risks.
- Automated Decision Support: AI-powered systems can provide real-time recommendations for irrigation, fertilization, and pest management based on vegetation index analysis.
- Image Processing: Advanced AI techniques can enhance the resolution and clarity of satellite imagery, allowing for more detailed vegetation index calculations.
Practical Applications of Vegetation Indices in Modern Farming
The integration of vegetation indices and AI into farming practices is not just theoretical; it’s happening right now on farms around the world. Let’s explore some of the practical applications that are making a real difference in crop management and sustainability.
Precision Irrigation
Water is one of the most precious resources in agriculture, and its efficient use is crucial for both sustainability and profitability. Vegetation indices, particularly those sensitive to water stress like the Normalized Difference Water Index (NDWI), are revolutionizing irrigation practices.
By analyzing these indices, farmers can:
- Identify areas of water stress before visible signs appear
- Create variable-rate irrigation plans that apply water only where and when it’s needed
- Monitor the effectiveness of irrigation systems and detect leaks or blockages
- Optimize irrigation schedules based on real-time crop water requirements
This precision approach to irrigation not only conserves water but also improves crop quality and yield by ensuring plants receive optimal moisture levels throughout their growth cycle.
Fertilizer Management
Efficient fertilizer use is another area where vegetation indices are making a significant impact. By providing detailed information about crop nutrient status, these indices enable farmers to implement precision fertilization strategies.
Key benefits include:
- Creation of variable-rate fertilizer application maps based on NDVI or NDRE data
- Early detection of nutrient deficiencies through spectral analysis
- Monitoring of fertilizer effectiveness and adjustment of application rates in real-time
- Reduction of fertilizer runoff and associated environmental impacts
This targeted approach not only reduces costs for farmers but also minimizes the environmental impact of excess fertilizer use, contributing to more sustainable agricultural practices.
Explore our API for advanced agricultural data integration.
Crop Disease and Pest Management
Early detection of crop diseases and pest infestations is crucial for effective management and prevention of yield losses. Vegetation indices, particularly when analyzed using AI algorithms, can detect subtle changes in plant health that may indicate the onset of disease or pest problems.
Applications in this area include:
- Identification of disease hotspots for targeted treatment
- Monitoring the spread of infections or infestations over time
- Evaluation of treatment efficacy through pre- and post-treatment index comparisons
- Development of predictive models for pest and disease outbreaks based on historical data and current conditions
By enabling early and precise interventions, these technologies help reduce the use of pesticides and fungicides, supporting more environmentally friendly farming practices.
Yield Forecasting and Crop Insurance
Accurate yield forecasting is essential for farm planning, market predictions, and food security assessments. Vegetation indices, particularly when tracked over time, provide valuable data for yield estimation models.
Key applications include:
- Development of in-season yield forecasts based on NDVI time series data
- Risk assessment for crop insurance purposes
- Identification of underperforming areas within fields for targeted management
- Validation of crop loss claims using historical vegetation index data
These applications not only benefit individual farmers but also contribute to broader agricultural policy and food security planning.
The Role of Remote Sensing and GIS in Vegetation Index Analysis
The power of vegetation indices is greatly amplified by advances in remote sensing technology and Geographic Information Systems (GIS). These technologies work in synergy to provide unprecedented insights into agricultural landscapes.
Satellite Imaging: The Eyes in the Sky
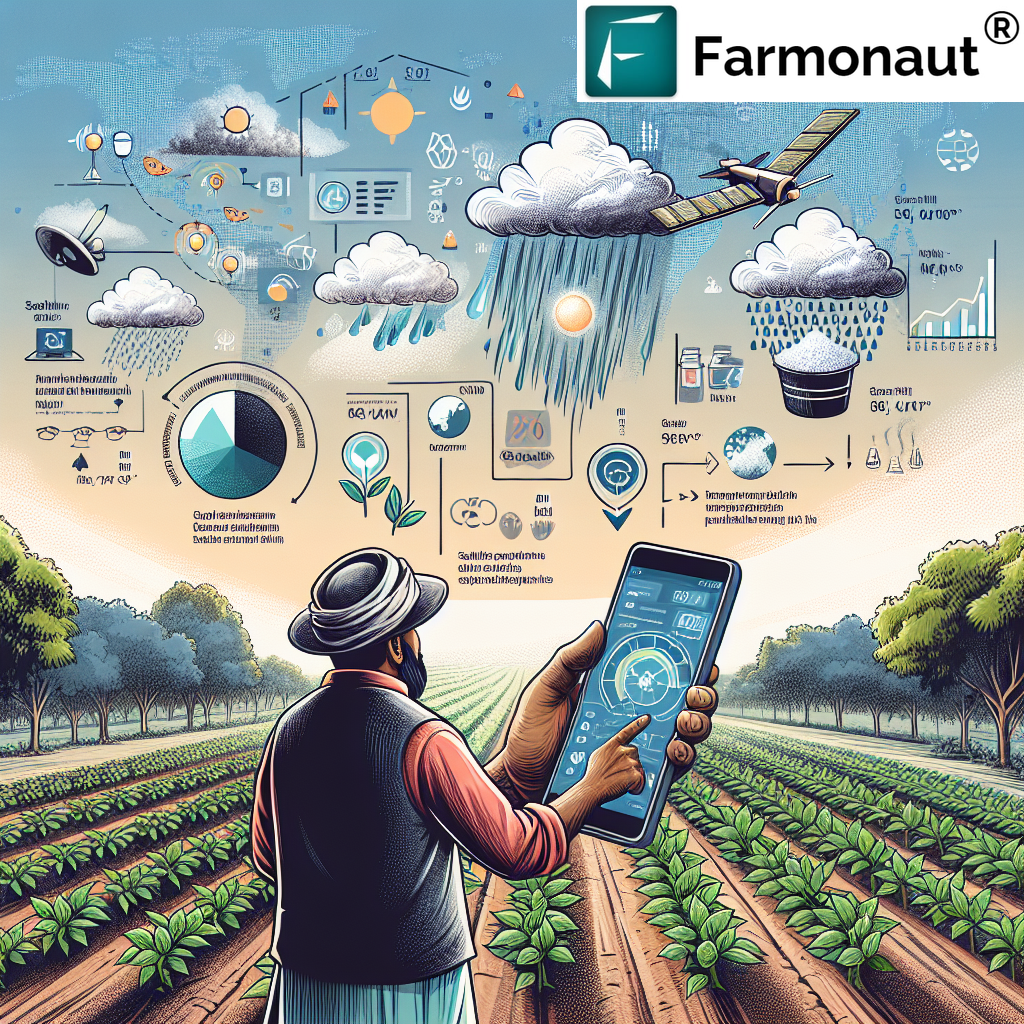
Satellite-based remote sensing has revolutionized the way we monitor crops on a large scale. Modern satellites equipped with multispectral sensors can capture detailed images of agricultural areas at regular intervals, providing a consistent stream of data for vegetation index calculations.
Key advantages of satellite-based monitoring include:
- Wide coverage area, allowing for monitoring of large agricultural regions
- Regular revisit times, enabling time-series analysis of crop development
- Consistent data collection, unaffected by on-ground obstacles or weather conditions (for radar satellites)
- Cost-effectiveness for large-scale monitoring compared to ground-based or aerial methods
Access our comprehensive API Developer Docs for integration guidance.
GIS: Turning Data into Actionable Intelligence
Geographic Information Systems (GIS) play a crucial role in processing, analyzing, and visualizing the vast amounts of data generated through remote sensing and vegetation index calculations. GIS platforms allow farmers and researchers to:
- Create detailed, layered maps combining vegetation index data with other spatial information
- Perform complex spatial analyses to identify patterns and trends
- Generate prescription maps for variable-rate applications of inputs
- Integrate vegetation index data with other farm management systems
The combination of remote sensing, vegetation indices, and GIS creates a powerful toolkit for precision agriculture, enabling data-driven decision-making at both the farm and regional levels.
Overcoming Challenges in Vegetation Index Applications
While vegetation indices offer tremendous potential, their application in agriculture is not without challenges. Understanding these limitations is crucial for effective implementation of these technologies.
Data Interpretation and Expertise
One of the primary challenges in using vegetation indices is the need for expertise in data interpretation. Raw index values alone don’t tell the whole story; they need to be interpreted in the context of crop type, growth stage, local conditions, and historical data.
Solutions to this challenge include:
- Development of user-friendly software interfaces that simplify data interpretation
- Integration of AI and machine learning to provide automated insights and recommendations
- Training programs for farmers and agronomists on the effective use of vegetation index data
- Collaboration with agricultural extension services to provide expert support
Temporal and Spatial Resolution
The usefulness of vegetation indices can be limited by the temporal and spatial resolution of the available data. While high-resolution satellite imagery is becoming more accessible, there’s often a trade-off between resolution and frequency of data collection.
Strategies to address this include:
- Combining data from multiple satellite sources to increase temporal resolution
- Use of drone-based imaging for high-resolution, on-demand data collection
- Development of data fusion techniques to enhance spatial resolution
- Implementation of edge computing solutions for real-time data processing and analysis
Environmental Factors and Data Quality
Vegetation index calculations can be affected by various environmental factors such as atmospheric conditions, soil background reflectance, and sensor calibration issues. These factors can introduce noise or errors into the data.
Approaches to mitigate these challenges include:
- Use of advanced atmospheric correction algorithms
- Development of soil-adjusted indices like SAVI
- Implementation of rigorous quality control and data validation processes
- Integration of ground-based sensor data for calibration and verification
The Future of Vegetation Indices in Sustainable Agriculture
As we look to the future, the role of vegetation indices in agriculture is set to expand even further. Emerging technologies and evolving agricultural practices are opening up new possibilities for these powerful tools.
Integration with IoT and Smart Farming
The Internet of Things (IoT) is increasingly becoming a part of modern agriculture. The integration of vegetation index data with IoT sensors and smart farming systems promises to create even more comprehensive and responsive agricultural management systems.
Potential applications include:
- Real-time adjustment of irrigation systems based on vegetation index data and soil moisture sensors
- Automated triggering of pest control measures when vegetation indices indicate potential infestations
- Integration with autonomous farm machinery for precision planting and harvesting
- Development of comprehensive farm management dashboards combining vegetation index data with other IoT-derived insights
Advanced AI and Machine Learning Applications
As AI and machine learning technologies continue to evolve, their application in analyzing vegetation index data will become even more sophisticated. We can expect to see:
- More accurate predictive models for crop yield and quality
- Enhanced ability to detect and diagnose plant stress and diseases
- Development of crop-specific AI models that account for unique growth patterns and spectral signatures
- Integration of vegetation index analysis with climate models for long-term agricultural planning
Contribution to Climate-Smart Agriculture
Vegetation indices will play a crucial role in the development and implementation of climate-smart agricultural practices. These indices can help in:
- Monitoring and verifying carbon sequestration in agricultural soils
- Assessing the impact of climate change on crop productivity and adaptation strategies
- Optimizing resource use to reduce the environmental footprint of agriculture
- Supporting the development of climate-resilient crop varieties through detailed phenotyping
Farmonaut: Pioneering Precision Agriculture with Advanced Vegetation Index Analysis
In the landscape of agricultural technology companies, Farmonaut stands out as a pioneer in leveraging vegetation indices and AI for precision agriculture. Through its innovative platform, Farmonaut is making advanced crop monitoring and management tools accessible to farmers worldwide.
Satellite-Based Crop Health Monitoring
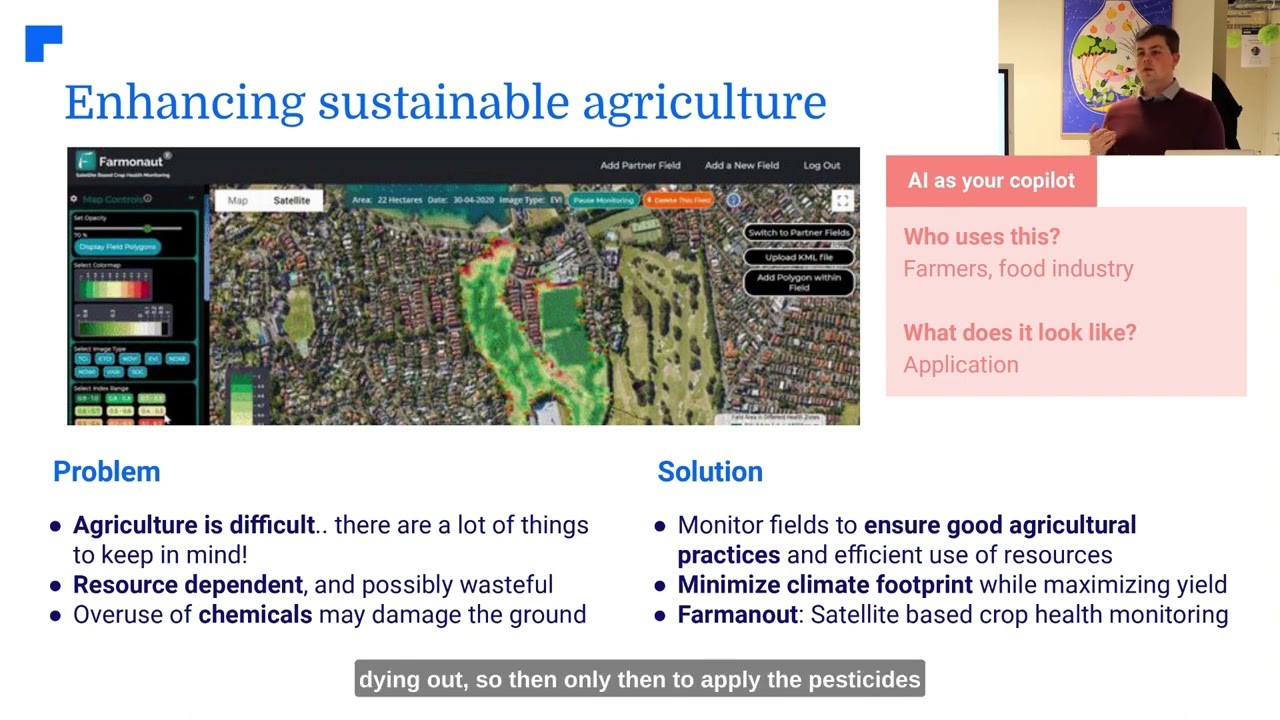
Farmonaut’s core offering revolves around its sophisticated satellite-based crop health monitoring system. This system utilizes a range of vegetation indices, including NDVI, to provide farmers with comprehensive insights into their crop’s health and development.
Key features include:
- Regular updates of vegetation index maps for subscribed fields
- Historical data analysis to track crop development over time
- Early detection of stress factors affecting crop health
- User-friendly interface for easy interpretation of complex data
AI-Powered Advisory System
Complementing its vegetation index analysis, Farmonaut’s Jeevn AI advisory system takes crop management to the next level. This system combines vegetation index data with other relevant information to provide personalized, actionable advice to farmers.
The AI system offers:
- Customized crop management strategies based on real-time data
- Predictive analytics for yield forecasting and risk assessment
- Automated alerts for potential issues like pest infestations or nutrient deficiencies
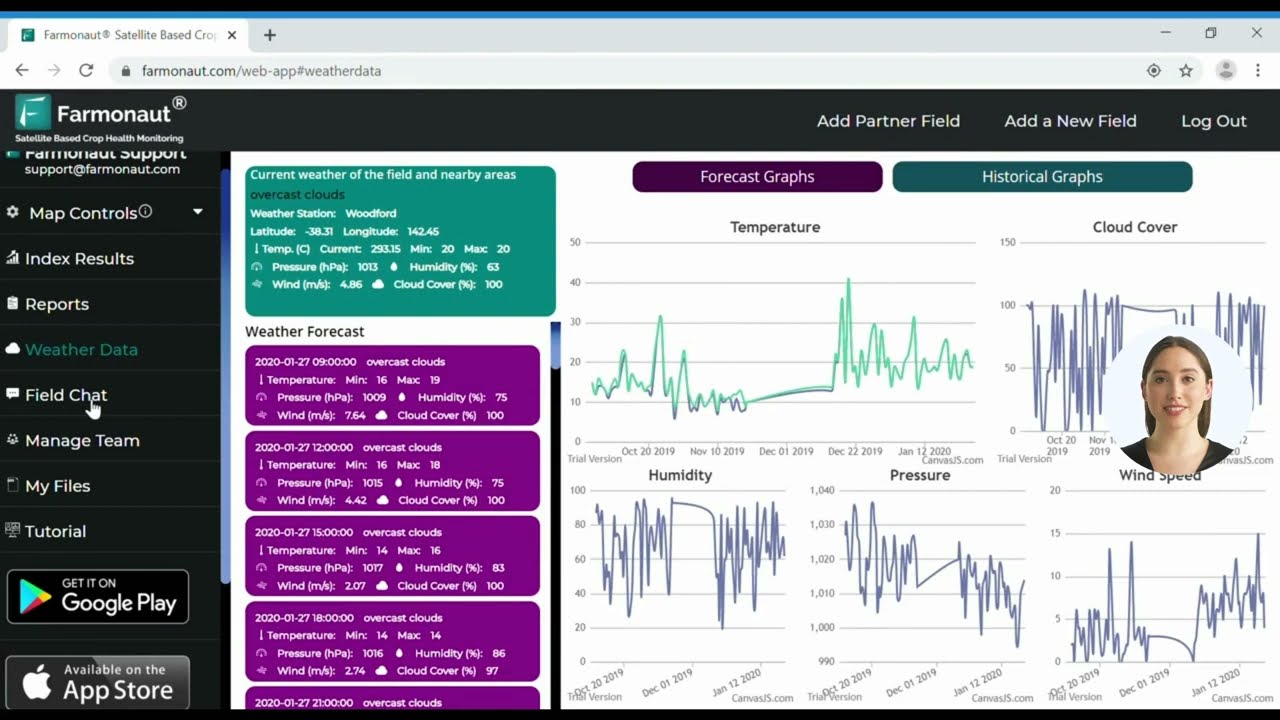
- Integration of weather forecasts for optimized decision-making
Accessibility and Scalability
One of Farmonaut’s key strengths is its commitment to making precision agriculture accessible to farmers of all scales. The company offers:
- A range of subscription options to suit different farm sizes and needs
- Mobile and web applications for easy access to data and insights
- API access for integration with other farm management systems
- Scalable solutions that can grow with the farmer’s needs
Promoting Sustainable Agriculture
Through its advanced vegetation index analysis and AI-powered insights, Farmonaut is actively contributing to more sustainable agricultural practices. The platform enables:
- Optimized resource use, reducing waste and environmental impact
- Improved crop yields without excessive input application
- Data-driven decision-making for long-term farm sustainability
- Carbon footprint tracking to support environmentally conscious farming
By providing farmers with powerful, yet accessible tools for precision agriculture, Farmonaut is playing a crucial role in revolutionizing crop management and promoting sustainable farming practices worldwide.
Conclusion: Embracing the Green Revolution 2.0
As we stand on the brink of what could be called the Green Revolution 2.0, the integration of vegetation indices and AI in agriculture represents a paradigm shift in how we approach crop management and sustainability. These technologies are not just incremental improvements; they are transformative tools that have the potential to address some of the most pressing challenges in global agriculture.
From optimizing resource use and increasing yields to adapting to climate change and reducing environmental impact, vegetation indices and AI are proving to be invaluable allies in the quest for sustainable food production. Companies like Farmonaut are at the forefront of this revolution, making these advanced technologies accessible to farmers around the world and empowering them with data-driven insights.
As we move forward, the continued development and adoption of these technologies will be crucial in meeting the growing global demand for food while preserving our planet’s resources. The future of agriculture is data-driven, precise, and sustainable – and it’s already taking root in fields around the world.
FAQ Section
Q: What are vegetation indices and how do they work?
A: Vegetation indices are mathematical formulas that use spectral data, typically from satellite or drone imagery, to assess various aspects of plant health and growth. They work by analyzing the differences in light reflection across different wavelengths, particularly in the red and near-infrared spectrum, which correlate with plant characteristics like chlorophyll content and leaf structure.
Q: How does AI enhance the use of vegetation indices in agriculture?
A: AI enhances vegetation index analysis by processing vast amounts of data quickly, identifying subtle patterns, and providing predictive insights. It can automate the interpretation of index values, generate recommendations for farm management, and integrate vegetation index data with other relevant information like weather forecasts and soil data for more comprehensive analysis.
Q: What are some practical applications of vegetation indices in farming?
A: Practical applications include precision irrigation management, targeted fertilizer application, early disease and pest detection, yield forecasting, and crop insurance assessment. These applications help farmers optimize resource use, reduce costs, and improve crop yields while minimizing environmental impact.
Q: How accessible is this technology for small-scale farmers?
A: Companies like Farmonaut are making vegetation index analysis and AI-powered insights increasingly accessible to small-scale farmers through user-friendly mobile apps and web platforms. While there may be a learning curve, many solutions are designed to be cost-effective and scalable to different farm sizes.
Q: What are the limitations or challenges of using vegetation indices?
A: Some challenges include the need for expertise in data interpretation, potential issues with data quality due to atmospheric conditions or sensor calibration, and limitations in temporal or spatial resolution of satellite imagery. However, ongoing technological advancements and the integration of AI are helping to address many of these challenges.
Q: How do vegetation indices contribute to sustainable agriculture?
A: Vegetation indices contribute to sustainability by enabling more efficient use of resources like water and fertilizers, reducing the need for pesticides through early detection of issues, and supporting practices that enhance soil health and carbon sequestration. They also play a role in monitoring and adapting to the impacts of climate change on agriculture.
| Index Name | Formula | Spectral Bands Used | Key Applications in Agriculture |
|---|---|---|---|
| NDVI (Normalized Difference Vegetation Index) | (NIR – Red) / (NIR + Red) | Near-Infrared, Red | General crop health, biomass estimation, yield prediction |
| EVI (Enhanced Vegetation Index) | 2.5 * ((NIR – Red) / (NIR + 6 * Red – 7.5 * Blue + 1)) | Near-Infrared, Red, Blue | Improved sensitivity in high biomass regions, canopy structure analysis |
| SAVI (Soil-Adjusted Vegetation Index) | ((NIR – Red) / (NIR + Red + L)) * (1 + L), where L is a soil brightness correction factor | Near-Infrared, Red | Vegetation monitoring in areas with exposed soil background |
| NDRE (Normalized Difference Red Edge) | (NIR – Red Edge) / (NIR + Red Edge) | Near-Infrared, Red Edge | Chlorophyll content assessment, nitrogen status monitoring |
| NDWI (Normalized Difference Water Index) | (Green – NIR) / (Green + NIR) | Green, Near-Infrared | Water stress detection, irrigation management |


