

Reviewed August 2026 against USDA NASS Land Values, USDA Economic Research Service, and Farm Credit System data.
Try it: Run your own numbers →


Farm Investment Opportunities: The Numbers First
US cropland averaged $6,020 per acre and overall farm real estate (land plus buildings) averaged $4,500 per acre in the USDA National Agricultural Statistics Service (NASS) Land Values Report published July 2026. Farmland investment opportunities in the US run from buying acreage outright, to leasing land for a rental yield, to buying into a farmland investment syndicate or agri-tech venture that never touches a deed. Each route uses the same underlying data — USDA NASS Land Values for prices, USDA Economic Research Service for rental rates and income, and Farm Credit System guidance for capitalization rates — so this article works through what each figure means and where to pull the current version of it.
US farmland value has risen 44% since 2020, per USDA NASS — an appreciation run investors compare against the 2%–6% cap-rate range farmland typically prices at.
Agricultural Investment Routes: Types & Trends
“Agricultural investment” and “invest in agriculture” cover several distinct structures, not one product. Here is how the routes break down, starting with the most direct:
- Farmland Acquisition: Buying acreage directly and either farming it or leasing it out. USDA NASS put the average US cropland value at $6,020 per acre in 2026, with wide regional spread (see the Corn Belt and Pacific figures below). This is the highest-control, highest-capital-requirement route.
- Farmland Investment Syndicates and Platforms: Pooled vehicles that buy farmland and sell fractional interests, so an investor gets exposure without buying a whole parcel or operating it. Covered in depth further down this page.
- Agri-Tech Ventures: Equity or venture positions in companies building precision-agriculture tools, automated irrigation, or farm-management software — a bet on productivity gains rather than land appreciation.
- Sustainable & Organic Farming Investment: Capital directed at farms transitioning to or already running organic/regenerative systems, priced on premium crop revenue rather than land value alone.
- Controlled-Environment Agriculture (CEA): Greenhouses and vertical-farm structures that decouple yield from open-field weather risk, usually at a higher capital cost per acre than row-crop land.
- Agroforestry: Land combining timber, tree crops, and row crops or pasture — a longer time horizon in exchange for diversified revenue streams and carbon-credit potential.
- Commodities and Input Ventures: Positions in the agricultural supply chain — inputs, equipment, or commodity contracts — that move with crop economics without owning land at all.

US Agriculture Investment: Why the Numbers Hold Up
US agriculture investment cases usually rest on four figures, all from USDA sources and all re-published on a fixed schedule so you can check whether they still hold:
- Appreciation: US farmland value is up 44% since 2020, according to the USDA NASS Land Values Report (July 2026 edition). NASS republishes this report every August, so the current multi-year appreciation figure is one download away.
- Income: USDA’s Economic Research Service forecast $153.4 billion in US net farm income for 2026, a figure that includes $44.3 billion in government direct farm payments — meaning roughly 29% of forecast net farm income traces to federal programs rather than market sales. Check the ERS farm income forecast for the current-year update; ERS revises this forecast three times a year (February, August, November).
- Rental yield: The inflation-adjusted average US cropland rental rate was $161 per acre for 2025–2026, against $15.50 per acre for pastureland, per USDA ERS farmland value data. On the $6,020 average cropland price, that $161 rental rate works out to roughly a 2.7% gross rental yield before taxes, insurance, or operating costs — landing inside the 2%–6% capitalization-rate range the Farm Credit System cites for farmland generally.
- Diversification: Farmland’s return pattern does not track equity or bond markets closely, which is the standard argument for holding it as a portfolio hedge rather than a growth engine.
None of this is a forecast of what farmland will do next; it is what the two agencies that track it reported for 2026. The method that survives past this year is checking those same three sources on their publication schedule, not remembering last year’s number.
Seven Farm Investment Opportunities Worth Evaluating
Best agriculture investments differ by how much capital, control, and operating expertise an investor brings. Here are seven routes ranked by how they trade those off:
1. Direct Farmland Acquisition, Regional Comparison
- Regional spread matters more than the national average when pricing a farm investment. USDA NASS put 2026 Corn Belt cropland (Illinois, Indiana, Iowa, Missouri, Ohio) at $8,590 per acre and Pacific region cropland (California, Oregon, Washington) at $8,440 per acre — both roughly 40% above the $6,020 national cropland average.
- Pastureland is a materially cheaper entry point at $2,000 per acre nationally, though it carries lower rental income ($15.50/acre versus $161/acre for cropland).
- USDA NASS does not publish every state’s figure in its headline summary tables; the full report linked above breaks out state-by-state data for readers who need a specific state rather than a regional average.
2. Agri-Tech and Farm Monitoring for Yield Protection
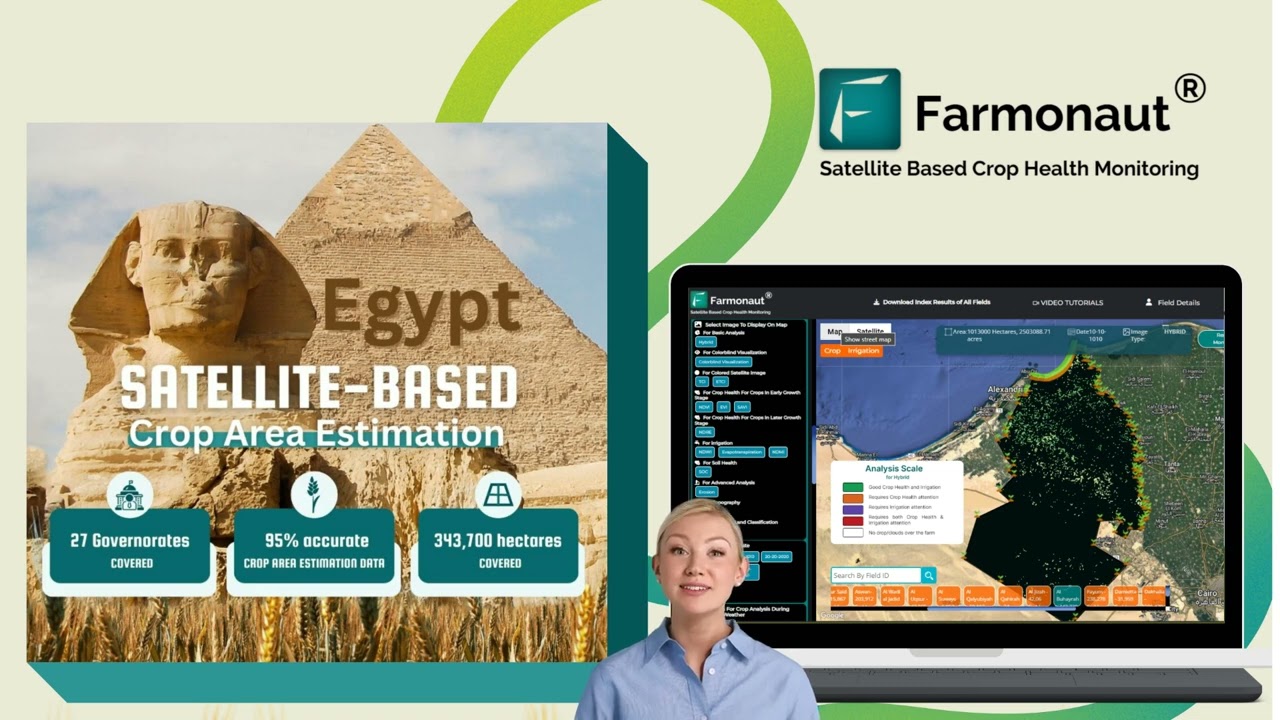
- Whichever route above you choose, yield volatility is what erodes the rental or income yield the numbers above assume. Satellite monitoring, AI crop-health diagnosis, and blockchain traceability are tools for protecting the income side of the equation rather than the land-value side.
- Farmonaut provides real-time satellite imagery, AI-powered crop health diagnosis, blockchain traceability, and fleet management for exactly this purpose.
- Read more about Farmonaut’s Fleet & Resource Management Systems: Efficient Agribusiness Operations
3. Diversifying a Portfolio with Agricultural Assets
- Balancing farmland or agricultural equity against traditional financial instruments is the standard argument for farmland as a portfolio hedge, given its historically low correlation to equities.
- This can mean direct acquisition, an agri-tech venture position, or exposure through a farmland investment syndicate — outlined in its own section below.
- Explore large-scale farm management solutions for consolidated operational oversight: Farmonaut Large Scale Farm Management.
4. Sustainable and Organic Farming Investment
- Organic and regenerative operations generally price on premium crop revenue rather than raw land value, since certified organic output commands higher per-unit prices in most US markets.
- Improved soil health under these systems is associated with more stable yields over time, which supports the income side of a farm investment even where land appreciation is flat.
- Farmonaut’s real-time crop health monitoring tools support the closer input tracking organic certification requires.

5. Controlled-Environment Agriculture (CEA)
- CEA systems — greenhouses and vertical farms — decouple yield from open-field weather risk, at a materially higher upfront capital cost per acre than row-crop land.
- This suits water-scarce regions or urban-adjacent sites where open-field cropland at $6,020–$8,590 per acre is not the comparison point; CEA is priced on infrastructure and throughput, not bare land value.
- Monitor and optimize performance with Farmonaut’s resource management APIs: Farmonaut Satellite-Weather API and Developer Docs.

6. Agroforestry for Multi-Stream Returns
- Agroforestry combines timber, tree crops, and row crops or pasture on the same acreage, spreading revenue across multiple harvest cycles and, increasingly, carbon-credit programs.
- The trade-off is time horizon: tree and timber components take years longer to mature than annual row crops, so the income profile looks different from a straight cropland lease from year one.
- Discover how Farmonaut’s Carbon Footprinting Solutions track and help offset agriculture-related emissions across these mixed systems.
7. Traceability and Financing as an Overlooked Lever
- Product integrity matters most in organic and specialty crops. Farmonaut’s Blockchain Traceability Solutions track produce from field to consumer.
- Financing access shapes an investment’s real return: precision monitoring supports more accurate crop loan approvals and insurance underwriting. See Farmonaut’s Crop Loan & Insurance Solutions.
Farmland Cap Rate Calculator
Enter a per-acre purchase price and expected annual rental income to see the implied capitalization rate, and how it compares to the Farm Credit System’s cited 2%–6% range for farmland.
Run your own numbers
Assumptions: uses gross rental income minus flat per-acre costs you enter; excludes financing terms, crop-share arrangements, property tax variation by county, and land-value appreciation. Cap-rate range of 2%-6% is sourced from the Farm Credit System’s farmland guidance, linked above.
Agricultural Asset Management: Tech & Monitoring
Agricultural asset management — tracking the operational and environmental performance of land already under investment — is the layer that sits underneath every route in this article. Farmonaut provides:
- Satellite-Based Crop Health Monitoring for timely responses to changes in vegetation, soil moisture, and plant health.
- AI-Powered Advisory for field-specific recommendations that support yield and resource use.
- Blockchain Traceability to support organic certification and consumer trust requirements.
- Fleet & Resource Management tools to reduce logistics costs and improve equipment utilization.
- Carbon Footprinting capabilities to measure and report the environmental footprint of land use and farming operations.
Farmonaut’s subscription-based access model is built to scale from a single leased parcel to an institutional-size land portfolio. Explore the Farmonaut Mobile & Web Apps for field-level data.



Comparison Table: Farmland Investment Strategies
| Investment Strategy | Typical Capital Entry Point | Income Source | Time Horizon | Primary Risk |
|---|---|---|---|---|
| Direct farmland acquisition | Full parcel price ($2,000-$8,590/acre by region and land type, USDA NASS 2026) | Crop sales or cash rent (~$161/acre cropland, $15.50/acre pasture, USDA ERS 2025-2026) | Long (5+ years) | Illiquidity, operating expertise required |
| Farmland investment syndicate/platform | Fractional share, set by platform | Pro-rata rent or crop-share distributions | Medium-long (platform-dependent lockups) | Platform track record, fee structure, exit liquidity |
| Agri-tech venture | Variable, typically higher risk equity | Company growth/exit, not land income | Medium (venture timelines) | Startup failure risk, no land collateral |
| Organic/sustainable farm investment | Comparable to conventional cropland plus transition costs | Premium crop pricing | Medium-long (certification transition period) | Certification cost and compliance |
| Controlled-Environment Agriculture (CEA) | High (infrastructure-heavy) | Premium, year-round crop sales | Medium (faster payback per cycle, high upfront cost) | Capital intensity, energy costs |
| Agroforestry | Comparable to cropland plus tree stock cost | Mixed: annual crops plus timber/carbon credits | Long (timber maturity years) | Multi-year revenue lag on tree component |
Note: capital entry points and income figures reflect USDA NASS and USDA ERS 2026 data cited throughout this article; syndicate, agri-tech, and CEA figures vary by specific platform or operator and should be confirmed against that operator’s current offering documents.
Benefits of Agricultural Investment
- Portfolio Diversification: Farmland’s historically low correlation with equity and bond markets is the standard case for holding it alongside traditional assets.
- Documented Income Streams: USDA ERS puts average US cropland rent at $161 per acre and pastureland at $15.50 per acre for 2025–2026 — a rental yield that can be checked against a specific property’s asking price using the calculator above.
- Appreciation Track Record: US farmland value is up 44% since 2020 per USDA NASS, though that is historical performance and not a guarantee for the years ahead.
- Environmental and Social Impact: Investment in sustainable practices supports rural development, biodiversity, and climate mitigation goals alongside financial return.
- Access to Financial Tools: Precision monitoring supports more accurate loan and insurance underwriting, improving access to financing at scale.
Risks in Farm Investments
- Market Volatility: Commodity prices and yields move with weather, global demand shifts, and trade policy — none of which the land-value or rental-rate figures above capture directly.
- Government Payment Dependence: $44.3 billion of the $153.4 billion 2026 US net farm income forecast comes from direct government payments (USDA ERS) — close to 29% of the total — meaning a policy change to farm program funding would move net farm income independent of crop prices or land values.
- Regulatory Risk: Land use rules, water rights, and trade policy shifts can affect profitability in specific regions.
- Operational Risk: Farmland investment without on-ground expertise or an operating partner tends to underperform the headline rental-yield figures.
- Environmental Risk: Soil degradation, water scarcity, or input mismanagement reduce productivity and, over time, the land’s resale value.
- Liquidity Risk: Direct farmland and most syndicate structures are far less liquid than public securities — exiting a position can take months.
Farmland Investment Syndicates & Platforms
A farmland investment syndicate pools capital from multiple investors to buy farmland as a group, then distributes rental or crop-share income pro-rata to each investor’s stake — the structure behind most “farmland investment platform” and “agricultural asset management” services aimed at investors who want exposure without operating a farm themselves. Before committing capital to any syndicate or platform, check:
- Fee structure: management fees, acquisition fees, and any performance/carry taken before distributions reach investors.
- Track record: how the platform’s historical rental yields and appreciation compare to the USDA NASS and ERS national and regional figures cited above — a platform reporting returns well outside the 2%–6% cap-rate range and the $161/acre cropland rent benchmark warrants closer scrutiny of its assumptions.
- Lockup and exit terms: how long capital is committed and what liquidity options exist before that term ends.
- Underlying asset detail: which specific parcels, regions, and crop types back the syndicate, so the USDA regional figures above (Corn Belt $8,590/acre, Pacific $8,440/acre, national average $6,020/acre) can be used as a sanity check on the valuation.
This structure is the practical answer to “farmland investment syndicates” as a search: it is not a single named product but a category of pooled-ownership vehicles, and the diligence checklist above applies regardless of which specific platform is under evaluation — a checklist that stays current even as individual platforms change their offerings.
Listed farmland REITs are the exchange-traded form of pooled ownership, and our page on farmland REITs and ETFs compares them, including their yields.
Agriculture Investment Beyond the US: Australia
For readers evaluating agriculture investment across both US and Australian markets, the comparable Australian data source is the Australian Bureau of Agricultural and Resource Economics and Sciences (ABARES), which releases its Farmland Price Indicator and Agricultural Commodities Reports quarterly — in March, June, September, and December. Specific AUD-per-hectare price levels for the current quarter were not available in the research used for this article; readers wanting an Australian equivalent to the USDA per-acre figures above should pull the latest ABARES release directly, since it refreshes four times a year on a fixed schedule.
Farmonaut covers Australian farmland investment opportunities and inflation-focused strategies in two dedicated pieces: Australian Agriculture Investment: Top 5 Opportunities and Smart Farmland Investment Strategies to Beat Inflation.
Farmonaut Subscription Plans
Farmonaut offers subscription options for farmers, agribusinesses, and land investors who want AI insights, satellite monitoring, and resource management built into their agricultural asset management workflow. Choose the plan that fits your scale and budget:
FAQ: Farm Investment & Agricultural Asset Management
What is the best way to start investing in farmland?
Compare your target parcel or platform against the USDA NASS national average ($6,020/acre cropland, 2026) and the regional figures for your area of interest, then check the implied rental yield against USDA ERS’s $161/acre average cropland rent using the calculator above. For pooled exposure, evaluate a farmland investment syndicate against the diligence checklist in this article before committing capital.
How much does US farmland cost per acre?
USDA NASS reported average US cropland at $6,020 per acre and average farm real estate (land and buildings) at $4,500 per acre in its July 2026 Land Values Report. Regional prices vary sharply: Corn Belt cropland averaged $8,590/acre and Pacific region cropland $8,440/acre, both well above the national figure. NASS republishes this report annually in August, so check the linked report directly for the current release.
What return can I expect from farmland rental income?
USDA ERS reported an inflation-adjusted average US cropland rental rate of $161 per acre and pastureland at $15.50 per acre for 2025-2026. Against the $6,020 national average cropland price, that implies a roughly 2.7% gross rental yield before costs — within the Farm Credit System’s cited 2%-6% farmland capitalization-rate range. Use the calculator on this page to run the math against a specific parcel’s price and rent.
How do agri-tech tools reduce farm investment risk?
Satellite monitoring and AI-driven advisory tools help detect crop stress, manage irrigation, and anticipate weather and nutrient variation earlier, which supports the income side of a farm investment (the rental or crop-sale return) rather than the land-value side. This does not change USDA’s published price or rent figures, but it can reduce the operational risk that causes actual returns to fall short of them.
Can I track a farm’s environmental and financial performance?
Yes. Platforms like Farmonaut provide real-time data on soil health, water use, crop condition, and carbon footprinting alongside the financial tracking needed for agricultural asset management, whether the land is directly owned or held through a syndicate.
How do I ensure traceability for agricultural products?
Blockchain-powered traceability systems, such as Farmonaut’s Blockchain Traceability Solution, track every stage of the farming and distribution process — useful both for consumer trust and for supporting the premium pricing organic and specialty investments rely on.
Are there Farmonaut solutions for plantation, forestry, and advisory?
Yes. Farmonaut’s Crop, Plantation & Forest Advisory services (try here) provide monitoring and management for forestry and plantation environments, relevant to agroforestry-style farm investments covered above.




Conclusion: Building an Agriculture Investment Position
The 2026 baseline is: US cropland at $6,020 per acre on average, farm real estate at $4,500 per acre, cropland rent at $161 per acre, and a 2%-6% cap-rate range that most farmland pricing falls within. Whether the route is direct acquisition, a farmland investment syndicate, an agri-tech venture, or agroforestry, the same three sources — USDA NASS, USDA ERS, and Farm Credit System guidance — are what to re-check before committing capital, on their published release schedules rather than from memory of last year’s figures.
Each route, including listed farmland funds, is weighed side by side in ways to invest in agriculture.
Explore how sustainable practices, monitoring initiatives, and water management strategies factor into that decision, and use the calculator above to test a specific parcel or offering against the current benchmarks.

 Fair Climate Fund
 TVS Electronics
 BW Pipelines
 WICO
WICO Gen Chayat
 Chimera Innovation
 SkyHarvest
 Polaris Digitech
 Teledarbas
 Wild Oak Farm
 SFX
SFX BACF Africa
 Doodlakine
 Exurbia Geospatial
 FieldZero
 Indico Company
