

Crop health · Detection guide
Crop Stress Detection: Early Signs, Tools and Fixes
Crop stress shows first as a falling vegetation index, a warmer canopy or soil short of water or high in salt. In 2024, drought, heat and wildfire caused more than US$11 billion of US crop losses (American Farm Bureau, from USDA RMA data). Here is how to find stress early and decide what to fix.
Key takeaways
- Drought, heat and wildfire caused more than US$11 billion of US crop losses in 2024; excess rain, flooding and hurricanes caused US$6.7 billion (American Farm Bureau analysis of USDA RMA data).
- Sentinel-2 gives 10 m pixels about every five days; Landsat 9 gives 30 m optical and 100 m thermal pixels every 16 days (Copernicus, NASA).
- FAO salt thresholds: common bean 1.0 dS/m, corn 1.7, soybean 5.0, wheat 6.0, cotton 7.7 and barley 8.0 dS/m (ECe).
- Maps show where stress is, not why. A field visit, soil test or plant sample confirms the cause.
- A stressed patch is worth fixing only when the yield saved is worth more than the fix; the calculator tests this with your numbers.
In this article
- What crop stress is and why it matters
- Early signs: what crop stress looks like in the field
- Which crop stresses cost farmers the most
- Crop stress detection tools compared
- How to read a satellite crop stress map
- Salinity stress: how much salt each crop tolerates
- Is fixing a stressed patch worth it?
- Seven ways to manage crop stress
- A weekly crop stress detection routine
- How we checked the numbers
- FAQ
Crop stress detection means finding plants that are short of water, nutrients or health before the damage shows up as lost yield. The fastest early clues are a falling vegetation index on satellite images, a warmer canopy on thermal readings, and soil tests that show too little water or too much salt. In 2024, drought, heat and wildfire caused more than US$11 billion of US crop losses, according to an American Farm Bureau analysis of USDA crop insurance data.
This guide explains the main types of crop stress, the signs to look for, and the tools that find stress early, from a walk in the field to satellites. It also gives salt limits for eight field crops from FAO data, a chart of what each satellite can see, and a calculator that tells you whether fixing a stressed patch of field is likely to pay.
What crop stress is and why it matters
Crop stress is any condition that stops a plant from growing at its full potential. Scientists split it into two groups. Abiotic stress comes from the physical world: water, heat, cold, salt, light and nutrients. Biotic stress comes from living things: insects, diseases and weeds. We cover the first group in more depth in our guide to abiotic stress.
Stress rarely comes alone. A dry spell weakens roots, and weak plants then suffer more from pests and disease. Salty soil makes drought worse, because salt makes it harder for roots to pull water out of the soil. That is why a good plan looks at the whole field, not just one symptom.
Abiotic stress in crops
- Drought stress: the soil cannot supply water as fast as the crop uses it. Leaves roll or wilt, pores in the leaf close, and photosynthesis slows. FAO’s crop water guide describes this point as the moment the soil water content falls below a threshold and the crop starts to feel stress (FAO Irrigation and Drainage Paper 56, chapter 8).
- Salinity stress: salt in the root zone makes water harder to take up. Plants look drought-stressed even in moist soil. Leaf edges may burn and growth slows.
- Heat stress: very high temperatures damage proteins and pollen. Heat during flowering hurts seed set in corn, wheat and many other crops.
- Cold and frost stress: low temperatures slow germination and can kill young tissue. A late frost can damage wheat heads or fruit blossoms in one night.
- Light stress: too little light slows growth under heavy cloud or shade; too much light on a stressed plant can damage the leaf’s light-catching system.
- Nutrient stress: shortage of nitrogen, potassium, sulfur or micronutrients shows as pale or striped leaves and weak growth.
Biotic stress in crops
- Pest stress: insects, mites and nematodes feed on leaves, stems, roots or sap. They cut leaf area and open wounds for disease. See our tips on pest infestation for some common examples.
- Disease stress: fungi, bacteria and viruses block water flow, kill leaf tissue or rot roots and grain.
- Weed stress: weeds compete for light, water and nutrients. Early competition costs the most yield.
Early signs: what crop stress looks like in the field
Most stress follows the same pattern. The plant changes inside first, then on the outside. By the time you see the change from the truck, some yield is often gone. The table lists the signs you can see and the ones you need a tool to find.
| Sign | What you see or measure | Common causes |
|---|---|---|
| Wilting, leaf roll | Leaves curl or droop in the afternoon | Drought, salt, root damage |
| Yellowing | Pale leaves, old or new growth first | Nitrogen or sulfur shortage, waterlogging |
| Leaf burn | Brown, dry edges or tips | Salt, heat, potassium shortage, chemical injury |
| Spots and lesions | Round or angular dead patches | Fungal or bacterial disease |
| Stunting | Shorter plants in patches | Compaction, nematodes, poor drainage |
| Warm canopy | Leaf temperature above air temperature | Water stress, closed leaf pores |
| Falling NDVI | Lower index value than the rest of the field | Any stress that cuts green leaf area |
The last two rows are the “hidden” signs. A thermal sensor or a satellite picks them up before the eye does. They tell you where to look, not what is wrong. A visit on foot, a soil test or a plant sample still has to confirm the cause.
Timing matters as much as the sign itself. A pale patch in early spring may only be cold, wet soil that slows root growth, and it often recovers once the soil warms. The same patch at flowering, when the crop sets its seed or fruit, deserves a visit within a day or two. Note the crop stage each time you record a sign, so you can tell a short setback from a problem that will cost yield. Photos taken from the same spot each week make the change easy to see.
▶ How NDVI maps from satellites show crop stress before you can see it, told through a cartoon story about a 400-acre corn farm. · 4:09
Which crop stresses cost farmers the most
Weather drives the biggest losses. The American Farm Bureau estimated US crop losses from weather in 2024 by cause, using USDA Risk Management Agency (RMA) insurance data scaled up as if every acre were fully insured. Drought, heat and wildfire made up the largest group, at more than US$11 billion. Excess rain, flooding and hurricanes came second at US$6.7 billion.
Chart
US weather-related crop losses by cause
US$ billion, 2024, crops and rangeland, estimated as if all acreage were fully insured
Texas had the largest losses for the third year in a row, at more than US$3.4 billion, and cotton took the biggest hit there, according to the same Farm Bureau analysis. More than 66% of the Texas losses came from drought, heat and hot wind. Crop insurance covered about 47% of the drought and heat losses; the other 53% fell outside coverage. These are estimates from insurance data, not a full count of every stressed field.
The chart shows that water and temperature, not pests, were the costliest stresses in that year. Pests and diseases still matter on every farm, but they are not counted in this weather analysis.
Crop stress detection tools compared
No single tool finds every kind of stress. Each one sees a different part of the problem, at a different scale and cost. The table compares the main options.
| Tool | What it detects | Scale | Main limit |
|---|---|---|---|
| Field scouting | Pests, disease, weeds, the cause of a symptom | One spot at a time | Slow on large farms; misses patches |
| Satellite images | Changes in green cover (NDVI and similar indices) | Whole farm, every few days | Clouds; shows where, not why |
| Drone cameras | Fine detail, plant counts, small patches | One field per flight | Pilot time and flight rules |
| Thermal sensors | Canopy temperature and water stress | Pivot, drone or satellite | Needs weather data to interpret |
| Soil moisture sensors | Water left in the root zone | One point per sensor | Placement and upkeep |
| Soil and plant tests | Salt, pH, nutrients | One sample per zone | Lab time; a single moment |
Satellite remote sensing
Healthy leaves reflect much near-infrared light and absorb red light. When plants suffer from drought or disease, that balance shifts. NDVI compares the two to rate plant vigor on a scale from -1 to 1, where lower values point to stressed plants or bare ground (NASA Earthdata NDVI overview). Our page on Remote Sensing in Agriculture explains the wider uses.
Pixel size decides how small a problem a satellite can show. The European Sentinel-2 satellites carry four bands at 10 m, six at 20 m and three at 60 m, and the pair revisits each place about every five days (Copernicus SentiWiki, Sentinel-2 mission). Landsat 9 gives 30 m optical pixels and 100 m thermal pixels on a 16-day cycle (NASA, Landsat 9 instruments). The MODIS vegetation index product uses 250 m pixels every 16 days (NASA LP DAAC, MOD13Q1), which suits regions more than single fields.
Thermal imaging and canopy temperature
A plant short of water closes its leaf pores, stops cooling itself and warms up. Thermal sensors read that warming. In Nebraska trials, researchers put infrared thermometers on center pivots and found that corn water stress was small just after rain or irrigation, then rose sharply three to four days later (University of Nebraska CropWatch, 2022). That timing is the window in which a stress map is most useful.
Soil moisture sensors
Sensors in the ground tell you how much water is left where roots feed. University of California advisers list four main types: neutron probes, TDR and FDR sensors that read the soil’s dielectric constant, tensiometers and gypsum blocks. They note that tensiometers suit crops sensitive to water stress, such as berries and vegetables (UC Agriculture and Natural Resources). Sensors work best paired with a field map, so you know which zone each one stands for.
Drones and spectral cameras
Drones carry multispectral or thermal cameras and give pixels of a few centimetres. They are good for checking a patch that the satellite flagged, counting plants, or mapping a small high-value crop. They take more time per acre than a satellite, so many growers fly them only where a problem is already suspected.
Chart
Smallest pixel size by satellite sensor
Metres per pixel (smaller shows more detail); selected sensors used for crop monitoring
How to read a satellite crop stress map
A stress map is a colour picture of a vegetation index across your field. Green areas have more active leaf cover, and yellow or red areas have less. The useful question is not “is this patch red?” but “is this patch getting worse compared with last week and with the rest of the field?”
- Compare with the same field. A sandy knoll is always lower than a deep, wet hollow. Look for change over time, not one low reading.
- Check the date and the clouds. Haze and cloud shadow lower the index. Skip images with cloud over your field.
- Match the crop stage. Index values rise through canopy closure and fall at ripening. A drop in late season can be normal.
- Look at the shape. Straight lines often point to equipment, such as a blocked nozzle or a missed pass. Circles and rings hint at irrigation. Low spots and field edges hint at drainage or salt.
- Go and look. Mark the patch on your phone, walk to it, and dig, sample or scout. The map shows where; the visit shows why.
The Farmonaut Satellite + AI Farm Monitoring System sends this kind of vegetation map for each field you draw, so you can see which part of the farm to visit first.
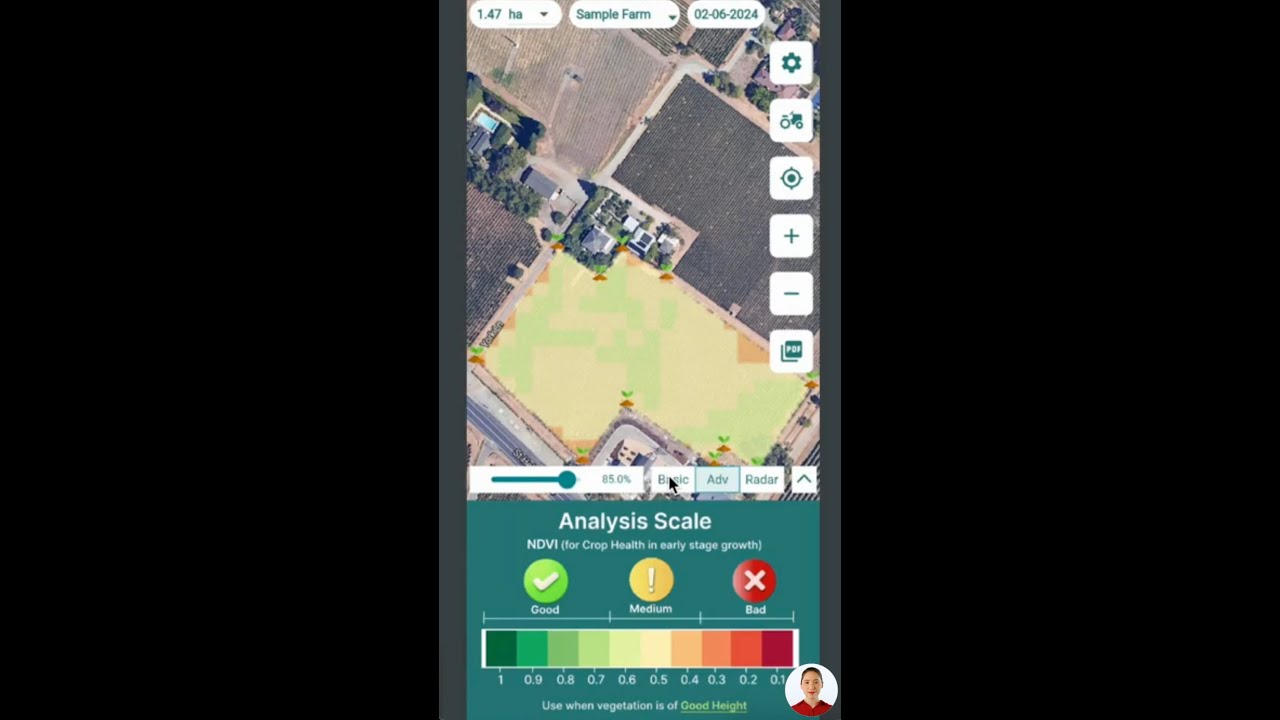
▶ A tutorial on reading satellite crop health data in the Farmonaut mobile apps. · 4:01
Salinity stress: how much salt each crop tolerates
Salt stress is easy to mistake for drought. FAO’s crop salt tolerance tables, based on work by Maas and Hoffman and updated by Maas and Grattan, give each crop a threshold: the highest soil salinity that does not cut yield. Above it, yield falls in a straight line for every extra unit of salt (FAO, crop salt tolerance data). Salinity is measured as the electrical conductivity of a saturated soil paste extract (ECe) in decisiemens per metre (dS/m).
The chart shows the threshold for eight common crops, and the salt level at which yield is cut in half, which we worked out from the FAO slope. Common bean starts losing yield at 1.0 dS/m and corn at 1.7 dS/m, while barley holds full yield up to 8.0 dS/m and cotton up to 7.7 dS/m. The values are for seed or grain yield, except corn (fresh ear weight) and cotton (seed cotton).
Lab methods differ. North Dakota State University notes that labs in that state read a 1:1 soil and water mix, not the saturated paste, so the numbers are not the same scale (NDSU, Managing Saline Soils in North Dakota). Ask your lab which method it used before you compare a result with the FAO table.
Chart
Soil salt levels that cut crop yield
ECe in dS/m: FAO threshold, and the 50% yield point worked out from the FAO slope
Is fixing a stressed patch worth it?
A stressed zone costs money only when the fix costs less than the yield it saves. The calculator uses the FAO salt response to estimate the yield you lose in a salty patch, then compares it with what a fix would cost per acre, such as drainage, gypsum, extra leaching water or a switch to a more tolerant crop. Enter your own numbers; the defaults are examples for corn and sit near break-even.
You can use the same logic for other stresses. Replace the salt loss with your own estimate of loss from drought, compaction or a pest patch, and keep the area, yield, price and cost inputs.
Try the numbers for your own farm below.
Calculator
Is fixing a salty patch worth the cost?
Enter your own zone size, yield, price, soil test and fix cost.
- Estimated yield loss: 15.6 %
- Lost value per acre (US$): $126
- Total cost of the fix (US$): $2,800
- Net per acre if the fix removes the loss (US$): -$14
Example values only, set near break-even for corn; not a benchmark or forecast. Yield loss % = slope x (measured ECe – threshold), kept between 0 and 100 (Maas-Hoffman method in FAO’s crop salt tolerance data). FAO lists corn at a 1.7 dS/m threshold and 12% loss per dS/m (measured on fresh ear weight, so treat a grain result as a rough guide); enter your crop’s values. ECe must come from a saturated paste extract. The net line assumes the fix removes the whole loss in one season; many fixes take several seasons. Check local rules and get professional advice before drainage or soil amendments.
Seven ways to manage crop stress
Detection is only useful if it leads to action. These seven methods match the main causes above. Each one says what it is best for. They are not ranked, because the right choice depends on what your stress map and field checks show.
1. Schedule irrigation with soil and crop data
Water when the soil reaches a set depletion level, not by the calendar. Soil sensors, canopy temperature and weather-based water use all help. FAO Paper 56 calls the water a crop can use before it feels stress the “readily available water”, a share of the total water the root zone holds.
Best for: irrigated farms with drought or heat stress patches.
2. Use satellite and drone monitoring to guide scouting
Review a vegetation map once or twice a week in the growing season. Send the scout to the low patches first. This cuts walking time on large farms and catches problems that sit away from field roads. It also helps when choosing precision agriculture software for the farm.
Best for: large or spread-out farms and absentee owners.
3. Choose stress-tolerant varieties
Seed companies and public breeders release hybrids and varieties with better drought, heat, salt or disease tolerance. Use local variety trial results from your state university or provincial extension service, not a single plot. A variety that does well under stress may give up some yield in a good year, so match it to the field’s history.
Best for: fields with the same stress year after year, such as sandy or salty ground.
4. Practise integrated pest management
The US Environmental Protection Agency describes four steps in integrated pest management: set action thresholds, monitor and identify pests, prevent them, and control them, starting with less risky methods (EPA, IPM principles). Targeted spraying comes in only when monitoring shows the lower-risk methods are not working. When you do spray, follow the product label and local rules, and get advice from a licensed adviser where the law requires it.
Best for: insect, disease and weed stress.
5. Build soil health
Better soil structure holds more water and lets roots go deeper, which buffers short dry spells. Cover crops, reduced tillage, organic matter and good drainage all help. Our guide to soil resilience covers the practices in detail.
Best for: compaction, poor water holding and long-term drought risk.
6. Manage salt and drainage
On salty ground, test the soil, improve drainage, and leach salt below the root zone where water quality allows. Gypsum helps where sodium is the problem. Pick crops whose threshold is above your soil’s salt level. Get a soil scientist or extension agent to check the plan, because the right fix depends on the salt type and the water table.
Best for: irrigated land in dry areas and fields with a high water table.
7. Feed and protect the crop at the right time
Split nitrogen, correct micronutrients and time sprays to crop stage so the plant has what it needs when demand peaks. Physical protection, such as row covers, shade cloth or automated field protection tarps, can shield high-value crops from frost, hail or heat. Follow fertilizer and product labels, and local nutrient rules.
Best for: nutrient stress, frost and heat in high-value crops.
Together these steps are some of the more practical ways to increase crop yield without adding land. They also support profit when you grow high-yield crops that are sensitive to stress.
A weekly crop stress detection routine
A simple routine turns maps and sensors into decisions. Here is one that works for most field crops in the growing season.
- Monday: check the map. Open the latest cloud-clear satellite image. Note any patch that dropped since last week.
- Check the weather. Look at rain, heat and wind for the past seven days and the coming five. Dry, hot and windy weeks raise water demand.
- Check the soil. Read soil moisture sensors or probe by hand in the flagged zones and in a healthy zone for comparison.
- Scout the flagged patches. Look at leaves, stems and roots. Count pests against your action threshold. Take photos and pin them to the map.
- Decide and record. Irrigate, spray, sample or wait. Write down what you did and where, so next week’s map shows whether it worked.
Keep the records season to season. Patches that come back every year usually have a soil cause, such as salt, compaction or poor drainage, that is worth a permanent fix.

▶ Step-by-step tutorial: monitoring fields with satellite crop health indices in the Farmonaut web app. · 8:43
How we checked the numbers
We took salt thresholds and slopes from FAO’s crop salt tolerance annex and worked out the 50% yield point as threshold plus 50 divided by slope. Satellite pixel sizes come from the mission pages of ESA’s Copernicus programme, NASA and the NASA LP DAAC data archive. US loss figures come from the American Farm Bureau’s analysis of USDA RMA data for 2024. The earlier version of this page gave percentage yield gains for each method without a source; we removed them, because the gain depends on the field, the crop and the stress.
FAQ
What is crop stress detection?
It is the process of finding plants that are under stress from water, heat, salt, nutrients, pests or disease, ideally before the damage is visible. It combines field scouting with tools such as satellite vegetation maps, thermal sensors, soil moisture sensors and soil tests.
Can satellites tell what is causing the stress?
No. A satellite shows where green leaf cover is lower or falling. Drought, disease, pests, nutrient shortage and salt can all look similar. You still need a field visit or a test to find the cause.
How often should I check my fields for stress?
Once or twice a week in the main growing season is a sensible rhythm for most field crops, and more often during flowering or a heat wave. Sentinel-2 revisits each place about every five days, so a weekly map check fits its schedule.
What NDVI value means a crop is stressed?
There is no single cut-off. NDVI depends on the crop, its stage and the soil. Compare a patch with the rest of the same field on the same date, and watch how it changes over time.
How do I know if my soil is too salty for a crop?
Send a soil sample to a lab and ask for ECe from a saturated paste, then compare the result with the crop’s threshold in the FAO table. Corn starts losing yield above 1.7 dS/m; barley holds full yield up to 8.0 dS/m.
Related pages on our site: tools for large and multi-field operations, carbon footprint tracking, supply chain traceability, satellite and weather API documentation, crop loans and insurance and mobile and web apps.
Farmonaut crop monitoring
See stress patches in your own fields
Draw your fields once and get satellite vegetation maps that show which patches to scout first.




Keep reading

Sources
- American Farm Bureau Federation, Hurricanes, Heat and Hardship: Counting 2024’s Crop Losses (2025): fb.org
- FAO, Crop salt tolerance data, annex to Irrigation and Drainage Paper 61 (2002): fao.org
- FAO, Irrigation and Drainage Paper 56, chapter 8: ETc under soil water stress (1998): fao.org
- NASA Earthdata, Normalized Difference Vegetation Index (NDVI): earthdata.nasa.gov
- Copernicus SentiWiki, S2 Mission: sentiwiki.copernicus.eu
- NASA, Landsat 9 instruments: landsat.gsfc.nasa.gov
- NASA LP DAAC, MOD13Q1 v6.1 MODIS/Terra Vegetation Indices 16-Day 250 m: lpdaac.usgs.gov
- University of Nebraska-Lincoln CropWatch, Sensors on the Pivot for Automated Irrigation Scheduling (2022): cropwatch.unl.edu
- UC Agriculture and Natural Resources, Soil moisture sensors: ucanr.edu
- NDSU Extension, Managing Saline Soils in North Dakota: ndsu.edu
- US EPA, Integrated Pest Management (IPM) Principles: epa.gov
Discussion
Questions, corrections or field experience? Share them below. First-time comments are reviewed before they appear, and your email is never published.
No comments yet. Be the first to add a question or your experience.

 Clubhouse OS
 Progenseed
 SkyHarvest
 Polaris Digitech
 Teledarbas
 Wild Oak Farm
 SFX
 BACF Africa
 Doodlakine
 Exurbia Geospatial
 FieldZero
 Indico Company
 Kubota
 FFBS
 Jontra
 Hayleys Agriculture
 Adinet
 Grandstream Algérie
 XOS Realty
 Geospatial Lab Africa
 Agro La Gándara
 HIPSAC
 ZOL Zimbabwe
 Juligerm
 MISE Maroc
 NWNS
 Farm Inc

 Licence holder · Niger · Gold
 Client · Somalia · Gold
 Client & affiliate partner · Ghana · Gold










