

Carbon markets · US farm guide
Carbon Credits for Farmers: How Programs Pay Per Acre
Carbon by Indigo paid farmers $30 per credit for its first two credit crops and returns 75% of the net sale price, minus up to a 20% buffer holdback. How programs work, what qualifies, and how carbon payments compare with USDA cost-share.
Key takeaways
- One credit = one metric ton of CO2e reduced or removed, verified under a protocol such as the Climate Action Reserve US Soil Enrichment Protocol.
- Carbon by Indigo paid farmers $30 per credit for its first two credit crops (CropLife, February 2023) and returns 75% of the weighted net price in its standard program.
- Up to 20% of credits can be held in a buffer pool, and farmers are not paid for that holdback (Ambrook program summary).
- NRCS Pennsylvania’s FY2026 list pays $76.94 per acre for a single-species cover crop and $26.53 for no-till, often more per acre than early carbon payments.
- Agriculture made up 9.4% of US greenhouse gas emissions in 2022 (EPA).
In this article
- Carbon credits for farmers: the short answer
- How a farm carbon program works, step by step
- What one carbon credit pays a farmer
- Calculator: your net carbon income per acre
- Carbon farming practices that earn credits
- Carbon payments vs USDA conservation payments
- Where US farm emissions come from
- Carbon farming programs and companies to compare
- How carbon farming works in Australia
- Verification: soil samples, models and satellites
- Is a carbon program worth it for your farm?
- FAQ
- Related pages on our site
Carbon credits for farmers pay for one metric ton of CO₂-equivalent stored in soil or kept out of the air, and the farmer gets a share of what a buyer pays. In one of the best documented US programs, Carbon by Indigo, farmers were paid $30 per credit for the first two credit crops and receive 75% of the weighted net price buyers pay, according to CropLife (February 2023) and Indigo’s program page. At an example rate of 0.3 credits per acre, that is a few dollars per acre per year, so the money works best as a bonus on practices that already pay.
This guide explains how a farm carbon program works, what one credit is worth to you after holdbacks and fees, which practices qualify, and how carbon payments compare with USDA cost-share. It includes a calculator you can fill in with your own acres and contract terms, plus charts of conservation payments, US farm emissions and a recent Australian compliance credit price.
Carbon credits for farmers: the short answer
One carbon credit equals one metric ton of CO₂e reduced or removed. A farm earns credits by changing a practice, such as adding cover crops or cutting tillage, and proving the change against a baseline. A registry then issues the credits, and a company buys them to meet a climate goal.
- What you sell: verified tons, not acres. Payment depends on how many credits your fields produce.
- What you get: a share of the sale price. Indigo’s standard program returns 75% of the weighted net price to the farmer.
- What is held back: up to 20% of credits can go into a buffer pool against reversals, and farmers are not paid for that holdback, per Ambrook’s program summary.
- What you commit to: keeping the practice and the carbon in place for years. Indigo’s payments vest on a five-year schedule, per Ambrook. Read the contract term before you sign.
Carbon contracts are legal and financial agreements. Get advice from a lawyer, tax adviser or farm business consultant before you enroll, and check your local rules.
How a farm carbon program works, step by step
Most voluntary soil carbon programs follow the same path. The names change from one company to the next, but the steps do not.
- Enroll fields. You list the fields and the practices you will change. Indigo, for example, asks for at least 150 acres of 18 eligible crops.
- Set a baseline. The program records past tillage, crops and fertilizer use. Credits only count for change beyond that baseline.
- Change the practice. Add cover crops, move to no-till or strip-till, or cut nitrogen rates.
- Measure and model. Soil samples, satellite images and models estimate how much carbon was stored and how much nitrous oxide was avoided.
- Verify. A third-party verifier checks the claim under a published protocol.
- Issue and sell. A registry issues the credits. The program sells them and pays you your share.
The protocol matters. The Climate Action Reserve US Soil Enrichment Protocol sets rules for quantifying, monitoring, reporting and verifying practices that add carbon to farm soils and cut CO₂, methane and nitrous oxide. Version 1.1 carries the ICVCM Core Carbon Principles label, and Version 2.0 is being written. The protocol asks for a detailed map of enrolled fields in a geospatial file at every verification.
Why buyers pay for farm credits
Food, drink and retail companies have large supply-chain emissions. They want credits or “insets” from the farms that grow their raw materials. That demand pays for most farm programs. It also means prices are set by private deals, not by a public exchange, so the price your program gets is often not published.
What one carbon credit pays a farmer
There is no single public price for US soil carbon credits. The best data points come from program announcements and contract terms, so always note the date and basis.
| Item | Figure | Basis and date |
|---|---|---|
| Indigo payout | $30 per credit | Paid to farmers for the first and second credit crops; CropLife, Feb 2023 |
| Farmer share | 75% of net price | Indigo standard program terms, read Oct 2026 |
| Buffer holdback | Up to 20% of credits | Not paid to the farmer; Ambrook summary, read Oct 2026 |
| Australian ACCU | A$39.03 per unit | Spot price, 14 Aug 2026; Clean Energy Regulator |
Indigo’s first credit crop, issued in June 2022, held more than 20,000 credits. The second held more than 110,000 credits from nearly 430 farmers in 22 states. Indigo now says more than 2 million credits have been issued to date across its program.
Your income per acre is the credits per acre, times the price, times your share, minus the holdback and your costs. If your fields store 0.3 tons of CO₂e per acre per year, a $30 credit and a 75% share gives about $6.75 per acre before the buffer, or $5.40 after a 20% holdback. Those are example numbers only; your soil, climate and baseline set the real rate.
Calculator: your net carbon income per acre
Enter your acres, the rate your program estimates for your fields, the credit price in your contract and your extra costs. The defaults are examples set near break-even, not a forecast.
Try the numbers for your own farm below.
Calculator
What would a carbon contract pay on your acres?
Enter your acres, estimated credits per acre, contract price and costs.
- Credits paid to you per year: 120 credits
- Carbon payment per acre: $5 $/acre
- Net per acre after your costs: $0 $/acre
Example values only, set near break-even; not a forecast or a quote. Credits per acre depend on your soil, climate and baseline, and your program sets the real rate, price, farmer share and buffer. This is not financial advice; check the contract with a professional.
Carbon farming practices that earn credits
Carbon farming means farming in a way that keeps more carbon in soil and plants and releases less greenhouse gas. These practices appear in most US programs.
- Cover crops. Living roots between cash crops add carbon and cut erosion and nitrate loss.
- No-till and strip-till. Less soil disturbance keeps carbon in place and saves fuel.
- Nitrogen management. Right rate, timing and placement cut nitrous oxide, a strong greenhouse gas.
- Diverse rotations. Adding small grains or forages builds soil organic matter.
- Grazing management. Rotational grazing on ranches can build soil carbon in grassland, which is why some programs enroll ranchers.
Programs differ on what they accept and how they stack with other payments. Indigo says fields in another carbon program and Conservation Reserve Program fields are not eligible, while EQIP and CSP fields are. For a deeper look at the soil side, see our guide to soil carbon sequestration on farms.
Why practice change does not always stick
Adoption is growing but uneven. A Choices magazine study (2024) reports that US cover crop and no-till area rose by 5.0 and 7.9 million acres between 2012 and 2017. Without disadoption in counties that lost area, totals could have been 5.9 and 13.1 million acres. Over 2012 to 2022, the Heartland region added 3.2 million acres of cover crops, 42% of the national net gain. Dropping a practice early can cancel carbon credits, so plan for the full contract term.

▶ A guide to carbon farming: the practices that store carbon in soil and how farmers are paid for them. · 5:30
Carbon payments vs USDA conservation payments
Many of the same practices are also paid by USDA’s Natural Resources Conservation Service through EQIP and CSP. Those are payments per acre for adopting a practice, not for proven tons. For a lot of farms, they pay more per acre than carbon credits in the first years.
In Pennsylvania’s published FY2026 cost list, NRCS pays $76.94 per acre for a single-species cover crop and $80.15 for a multi-species mix, $26.53 per acre for no-till and strip-till, and $87.10 for precision nutrient application, according to NRCS Pennsylvania Bulletin 440-26-06. Rates differ by state and year, so check your own state list.
Cost-share does not solve every problem. An Iowa State University study (2018) found return on investment may be the biggest hurdle to cover crops, and that fewer than half of Iowa’s 760,000 cover-cropped acres in 2017 got federal or state cost share. A carbon payment can help close that gap, as long as your program allows both.
Chart
NRCS payment rates for carbon-farming practices
US dollars per acre, Pennsylvania published FY2026 EQIP and CSP cost list
Where US farm emissions come from
Knowing where emissions come from shows where credits can be earned. In 2022, agriculture produced 9.4% of total US greenhouse gas emissions, according to the EPA. Soil management, mostly nitrous oxide from fertilizer and manure, made up just over half of the sector total. Methane from cattle digestion made up over a quarter, and manure management about 14%.
Chart
Where US agriculture’s emissions come from
Approximate share of agriculture-sector greenhouse gas emissions, percent (EPA wording: just over half, over a quarter, about 14%)
That split matters for farmers. Soil carbon and nitrogen programs suit row crops, while methane projects suit dairies and feedlots with manure systems. The EPA greenhouse gas inventory reports total US emissions of 6,343 million metric tons of CO₂e in 2022, and 5,489 million after counting land-sector sequestration. To see the footprint on your own farm, our carbon footprinting tool page explains how field data feeds an estimate.
Carbon farming programs and companies to compare
If you were looking for carbon farming companies or projects, this table lists program types with public rules. It is not a ranking or an endorsement; it shows how each one works so you can ask the right questions.
| Program | How it pays | Registry or rules | Where |
|---|---|---|---|
| Carbon by Indigo | 75% of net credit price | Climate Action Reserve | US, 150+ acres |
| ESMC EcoHarvest | Payments for carbon and water outcomes | ESMC protocol | US |
| NRCS EQIP and CSP | Fixed rate per acre | USDA practice standards | US |
| ACCU soil carbon | Units sold at market price | Clean Energy Regulator | Australia |
The Ecosystem Services Market Consortium runs EcoHarvest, which pays for carbon and water quality outcomes and brings together scientists, farmers and corporate buyers. In the UK, readers can compare options in our guide to carbon credit options for UK farmers.
Questions to ask any carbon farming program
- How long is the contract, and what happens if I sell the land or stop the practice?
- What share of the sale price do I get, and how much goes into the buffer?
- Is the price fixed, a floor, or whatever the buyer pays?
- Which registry issues the credits, and which protocol and version apply?
- Can I also take EQIP, CSP or state payments on the same field?
- Who owns the data from my fields, and who can see it?
How carbon farming works in Australia
Australia runs a government scheme. The Australian Carbon Credit Unit (ACCU) scheme issues one unit per ton and lets farmers sell to the government or to companies covered by the Safeguard Mechanism. The Clean Energy Regulator’s June quarter 2026 report says the generic ACCU spot price rose from A$36.28 at the end of Q1 2026 to A$37.95 at the end of Q2, and reached A$39.03 on 14 August 2026. These are compliance-market spot prices, not what a US voluntary program pays.
Chart
Australian carbon credit unit spot price
Generic ACCU volume-weighted spot price, Australian dollars per unit
The same report says soil carbon project registrations were the lowest since Q3 2023, as project owners waited for the result of a review of the 2021 soil carbon method. A proposed cap on credited soil carbon is expected to affect a small minority of projects. For Australian farmers, this is a reason to read the current method before you register.
Verification: soil samples, models and satellites
Credits are only as good as the measurement behind them. Programs combine three tools.
- Soil sampling at the start and at set intervals measures soil organic carbon directly, but it is costly and varies across a field.
- Process models estimate carbon change between samples from weather, soil type and management.
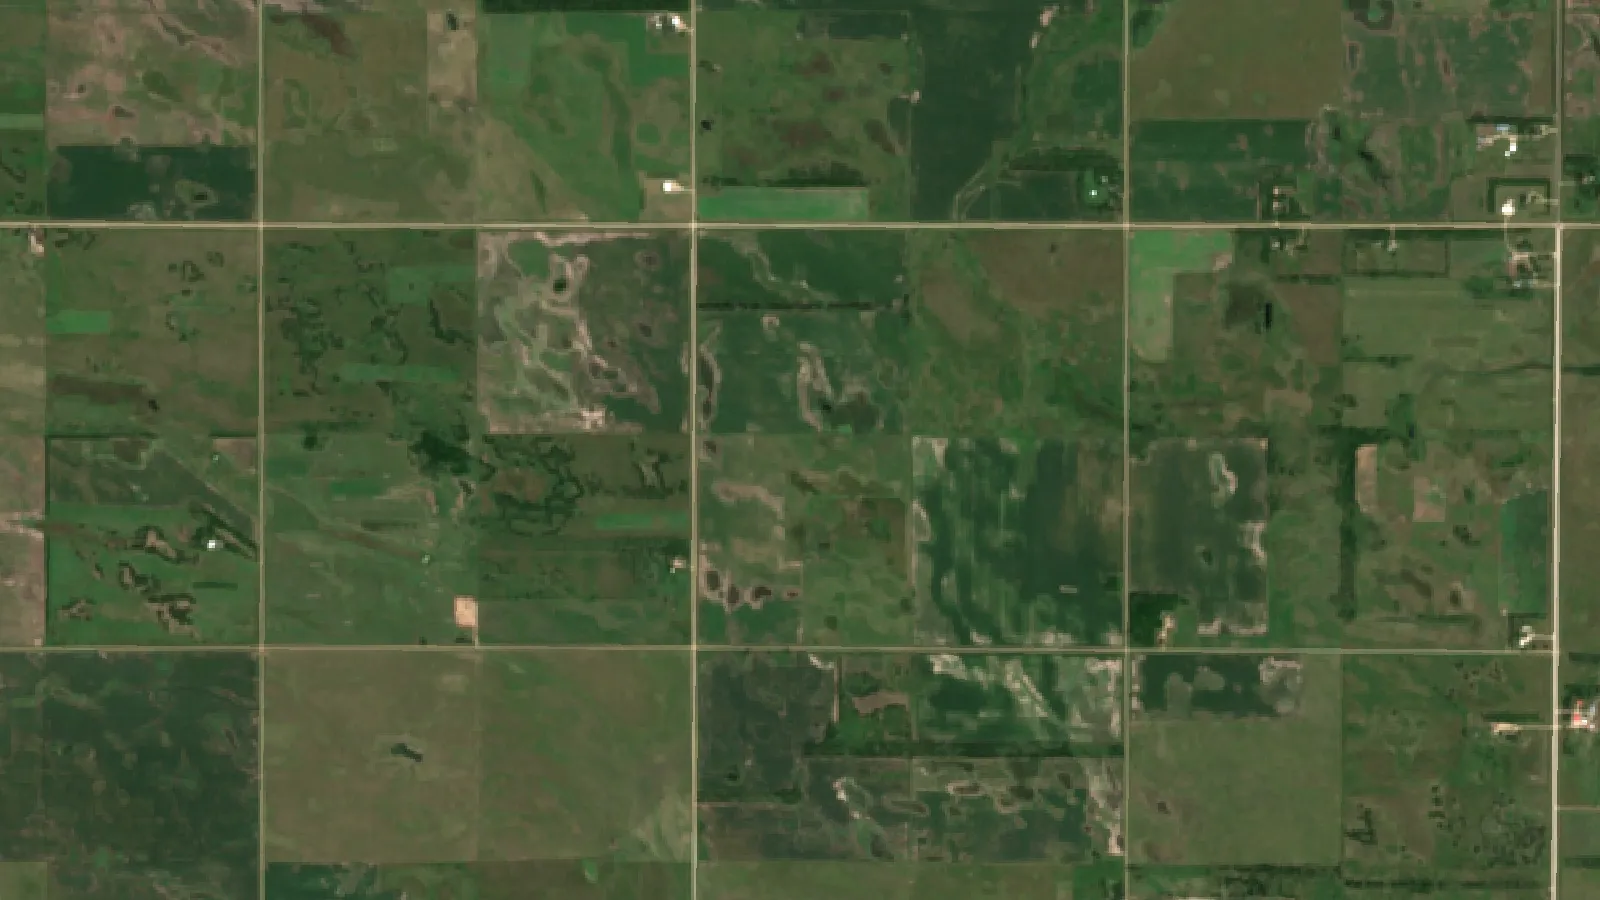
- Remote sensing checks the practice itself: whether a cover crop grew, when it was terminated, and whether a field was tilled.
Satellite records also help with field maps that protocols ask for. Farmonaut Satellite + AI Farm Monitoring System tracks vegetation on each field through the season, which gives growers and program staff a record of cover crop growth and crop timing. Developers building MRV or carbon platforms can pull the same data through the satellite and weather API or the API console.
Tax credits are a different thing
The federal 45Q tax credit pays for carbon captured at industrial sites and stored or used, not for carbon stored in farm soils. It does not create carbon credits you can sell. Carbon taxes are also separate; they are a cost, not an income, and we cover them on a separate page.

▶ Why soil organic carbon matters, and how it changes with farm management. · 12:28
Is a carbon program worth it for your farm?
A carbon contract fits best when the practice already makes sense for your farm. If cover crops or no-till cut your costs or protect yields, the credit is extra income on top. If the practice loses money, a few dollars per acre will rarely fix that.
- Good fit: you are about to start a practice, have records for your baseline, and can commit for the full term.
- Poor fit: you already use the practice (no additionality), rent land on short leases, or may sell soon.
- Check first: stacking rules with USDA programs, data ownership and penalties for leaving early.
Lenders and insurers are also starting to ask about practices and records. Our page on satellite data for crop loans and insurance explains how field records support those talks.

▶ Six plain steps to start precision farming, including satellite field maps, without buying a robot. · 4:18
FAQ
How much do carbon credits pay farmers per acre?
It depends on the credits your fields produce. At an example rate of 0.3 tons per acre, a $30 credit and a 75% share, the payment is about $5.40 per acre after a 20% buffer. Use the calculator with your own contract numbers.
What is a carbon farming initiative?
It is any program that pays farmers to store carbon or cut emissions. In the US these are mostly private programs, such as Carbon by Indigo or ESMC EcoHarvest. In Australia the government runs the ACCU scheme, which replaced the earlier Carbon Farming Initiative name.
Can ranchers earn carbon credits?
Yes, some programs enroll grazing land for rotational grazing and other grassland practices. Manure and herd management projects can earn credits too. Rules and rates differ by program, so ask about eligible practices first.
Can I get USDA payments and carbon credits on the same field?
Sometimes. Indigo accepts fields in EQIP and CSP but not in the Conservation Reserve Program or another carbon program. Each program sets its own stacking rule, so check before you sign.
How are farm carbon credits verified?
A program sets a baseline, measures change with soil samples, models and satellite records, and a third party checks it under a protocol such as the Climate Action Reserve Soil Enrichment Protocol. A registry then issues the credits.
Related pages on our site
Related pages on our site: product traceability, farm traceability, fleet management, agro admin app, Farmonaut apps, black sand mining facts.
Farmonaut agriculture API
Build carbon MRV on satellite field data
Pull field-level vegetation and weather data into your carbon or sustainability platform through the Farmonaut agriculture API.




Sources
- CropLife, Indigo Ag Issued Second Carbon Crop (February 2023): croplife.com
- Indigo Ag, Carbon by Indigo program page (read October 2026): indigoag.com
- Ambrook, Carbon by Indigo program summary (read October 2026): ambrook.com
- Climate Action Reserve, US Soil Enrichment Protocol: climateactionreserve.org
- Choices Magazine, Pervasive disadoption substantially offsets new adoption of cover crops and no-till (Q3 2024): choicesmagazine.org
- USDA NRCS Pennsylvania, Bulletin 440-26-06: FY2026 EQIP and CSP cost list (March 2026): nrcs-prod.azureedge.us
- Iowa State University CARD, Return on investment a stumbling block for cover crops (March 2018): card.iastate.edu
- US EPA, Agriculture Sector Emissions: epa.gov
- US EPA, Inventory of US Greenhouse Gas Emissions and Sinks: epa.gov
- Ecosystem Services Market Consortium (ESMC), EcoHarvest: ecosystemservicesmarket.org
- Clean Energy Regulator, Quarterly Carbon Market Report June Quarter 2026: Australian environmental markets: cer.gov.au
Discussion
Questions, corrections or field experience? Share them below. First-time comments are reviewed before they appear, and your email is never published.
No comments yet. Be the first to add a question or your experience.

 Mobitech Wireless
 FCF India
 Unifrutti Gulf
 Deluxe Conseil
 TVS Electronics
 BW Pipelines
 WICO
 Gen Chayat
 Chimera Innovation
 SkyHarvest
 Polaris Digitech
 Teledarbas
 Wild Oak Farm
 SFX
 Doodlakine
 Exurbia Geospatial

 Licence holder · Niger · Gold










