

Reviewed August 2026 against USDA Economic Research Service and USDA NASS data.
Try it: Enter your numbers above. →
Software development in agriculture now covers three distinct jobs: mapping yield across a field, guiding equipment by GPS, and managing farm records and compliance. USDA’s Economic Research Service has priced two of these directly on US corn farms — yield mapping saves an average $25 per acre and variable-rate fertilizer application with soil mapping saves $21 per acre, both measured against farms that don’t use the technology. That is the kind of specific, sourced answer this article gives throughout, using a real Minnesota floriculture case to show why software and farm classification decisions compound each other.
Table of Contents
- What Counts as “Software for Farmers”
- Per-Acre Savings: The USDA Numbers
- Software for Small Farms and Specialty Growers
- Case Study: Minnesota’s Flower Farms and the Classification Problem
- Choosing Software for a Farm: A Comparison
- Calculator: Estimate Your Per-Acre Software Payback
- Implementation: What It Actually Takes
- FAQ
- Try it: Enter your numbers above.
What Counts as “Software for Farmers”
“Computer software for farmers” spans four categories that get bundled together in marketing but behave very differently in a budget: precision agriculture (yield mapping, variable-rate application, GPS auto-guidance), farm management information systems (record-keeping, labor, input tracking), satellite crop monitoring (vegetation health, irrigation and pest alerts), and financial/compliance tools (crop insurance paperwork, loan applications, carbon reporting). A market analysis of the US precision farming software segment put crop management software at 38% of that market as of 2025, ahead of farm resource and irrigation management categories — evidence that record-keeping and decision-support tools, not just equipment-linked precision ag, dominate what US farms are actually buying software for.
This matters for anyone searching “software for farms” expecting one product to do everything. It doesn’t. A 5-acre flower farm and a 5,000-acre corn-soybean operation are shopping in different categories even though both searches land on similar-sounding vendor pages.
Per-Acre Savings: The USDA Numbers
The most concrete public data on what farm software actually saves comes from USDA’s Economic Research Service, published in its May 2016 Amber Waves analysis of precision agriculture technologies on US corn farms. Three technologies were measured against non-adopting farms:
- Yield mapping: $25 per acre in cost savings
- Variable-rate fertilizer application with soil mapping: $21 per acre in cost savings
- GPS auto-guidance systems: $15 per acre in cost savings
Read the source directly at the USDA Economic Research Service. These figures are dated 2016 and specific to corn — ERS has not re-published an equivalent per-acre breakdown for other row crops in this series, so treat them as a directional benchmark rather than a universal number for every crop. For a current adoption-rate check, USDA NASS runs a biennial Technology Use Survey through its Quick Stats database; the most recent cycle was fielded in August 2025, with the next one due August 2027. Query NASS Quick Stats directly for whatever adoption or broadband-access figure you need updated.
None of these three numbers requires owning a combine with a yield monitor built in from the factory — yield mapping and variable-rate application increasingly run through software layers (including satellite-based options) added on top of existing equipment, which is why the “software” framing matters distinctly from “precision ag hardware.”
Software for Small Farms and Specialty Growers
“Best software for small farms” is a different question from “software for farmers” generally, because the ERS savings figures above were measured on corn operations large enough to run variable-rate equipment across hundreds of acres. A small or specialty farm — flowers, vegetables, orchard fruit — needs software priced and scaled for its size, and the honest answer is that USDA has not published a cost-benefit breakdown specific to farms under 500 acres. That is a real gap in the public data, not something this article will paper over with an invented number.
What a small or specialty farm can use instead:
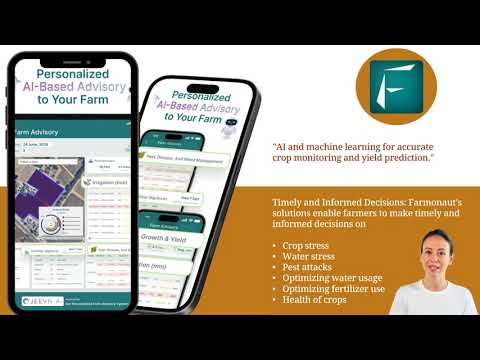
- Satellite crop monitoring without hardware purchase: Platforms like Farmonaut’s crop plantation and advisory services deliver vegetation health, soil moisture and weather data through a subscription rather than an equipment investment, which changes the economics for an operation measured in acres rather than sections.
- Large-scale farm management tools scaled down: Farmonaut’s large-scale farm management tools were built for bigger operations but the underlying field-mapping and monitoring functions apply at small-farm scale too.
- Carbon and sustainability documentation: Specialty growers marketing directly to consumers increasingly need to document practices. Farmonaut’s carbon footprinting tools turn that into a data export rather than a manual log.
The durable test for any small-farm software purchase, regardless of what’s being marketed this quarter: does it replace a specific manual task you can already price (hours spent scouting, hours spent on paper records, an insurance claim you couldn’t document), and is the subscription cost below what that task costs you in labor or lost claims over a season? If a vendor can’t help you answer that arithmetic before you sign up, that’s the software failing its own sales pitch.
Case Study: Minnesota’s Flower Farms and the Classification Problem
Software adoption doesn’t happen in a vacuum — it depends on whether a farm is classified, taxed, and regulated as agriculture in the first place. Minnesota’s cut-flower sector is a live example of why that classification question matters as much as the technology choice.

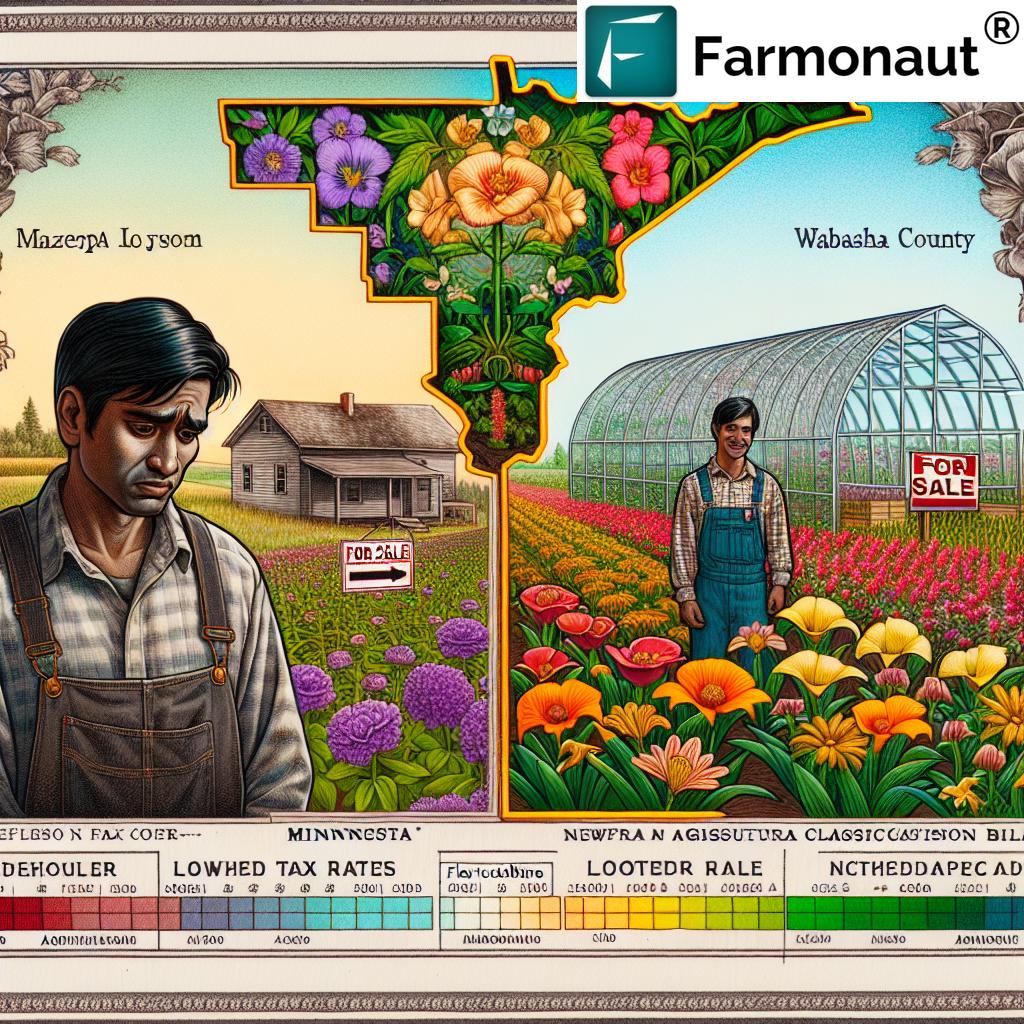
Minnesota Senate File 2626, introduced by Senator Steve Drazkowski (R-Mazeppa) and co-authored by Senator Aric Putnam (D-St. Cloud), proposes officially recognizing floriculture as an agricultural product under state law. The bill was inspired by Bleed Heart Floral Farm and Design in Mazeppa, whose owner Allie Kuppenbender testified at an April 3 tax committee hearing that her farm — a family’s primary income source, not a hobby — was taxed at residential rather than agricultural rates because current statute didn’t classify cut flowers as an agricultural product. If passed, the reclassification would take effect for taxes payable in 2027; as of this review the bill had been laid over for possible inclusion in a larger tax bill, meaning its status can change with each legislative session — check the Minnesota Legislature’s bill-tracking page for SF2626 for the current status rather than relying on a snapshot here.
The scale of who this affects nationally, per the 2022 USDA NASS Census of Agriculture: US commercial flower farms numbered 10,800, and wholesale value of US cut flowers and florist greens reached $763 million. Minnesota-specific acreage and revenue for floriculture are not broken out separately in the 2022 Census; a grower wanting state-level detail should contact the Minnesota Department of Agriculture directly, since USDA’s national census does not disaggregate to that resolution for this crop category. The next full Census of Agriculture is due in 2027, and USDA NASS also publishes annual interim floriculture updates — check the USDA NASS Floriculture Survey & Charts page for the current cut-flower production values between census years.
The bill matters to software adoption for a concrete reason: agricultural classification often determines eligibility for USDA programs, agricultural-use zoning for farm structures, and in some cases crop insurance products — all of which shape whether a small specialty farm can justify a software subscription at all. A farm taxed as residential and denied simplified agricultural permitting for a hoophouse is also a farm unlikely to see itself as a candidate for satellite monitoring or precision-ag software, even though nothing about growing flowers makes those tools less useful than they are for growing corn.
Kuppenbender’s testimony that demand for local flowers “often outpaces supply” points to the operational question that software actually solves regardless of tax classification: matching production timing to demand, tracking which beds are underperforming, and documenting sustainable practices for buyers who ask. Tools like Farmonaut’s fleet management solutions apply once a flower farm scales delivery routes to florists and farmers’ markets, and Farmonaut’s crop loan and insurance solutions address the financing gap that a residential tax classification makes worse.

Choosing Software for a Farm: A Comparison
The four categories from the first section map to different farm sizes, budgets and problems. Use this table to place your own operation before comparing specific vendors:
| Category | Best fit | Typical basis for cost | What it replaces |
|---|---|---|---|
| Precision ag (yield/variable-rate/GPS) | Row-crop farms, 200+ acres, equipment already GPS-capable | Per-acre or per-equipment license | Uniform-rate input application; manual guidance |
| Satellite crop monitoring | Any size, no new hardware required | Subscription tier by acreage or field count | Manual field scouting trips |
| Farm management / record-keeping | All farm sizes; 38% of US precision farming software market by category (2025) | Subscription, often per-user or per-farm | Paper logs, spreadsheets |
| Financial / compliance (loans, insurance, carbon) | Farms needing lender or buyer documentation | Subscription or per-report fee | Manual paperwork; third-party consultants |
A specialty grower like a Minnesota flower farm sits in the second and third rows: satellite monitoring for crop health without new equipment, and record-keeping to document yield and demand patterns for a tax hearing or a lender, exactly the kind of documentation Kuppenbender’s testimony suggests flower farmers currently assemble by hand.
Calculator: Estimate Your Per-Acre Software Payback
Enter your own acreage, subscription cost and which USDA-measured savings apply to your operation to see whether the numbers from the section above pencil out for your farm.
Enter your numbers above.
Assumptions: uses the flat USDA ERS 2016 per-acre savings figures for corn farms as a benchmark, applied uniformly across your entered acreage. It does not account for crop type differences, regional cost variation, equipment already owned, or the labor cost of implementation covered in the next section. Treat the output as a starting estimate to compare against a vendor’s actual quote, not a guarantee.
Implementation: What It Actually Takes
The gap between a software demo and a working system on a farm is where most of the real cost hides, and it’s a cost USDA’s per-acre figures don’t include. Before subscribing to anything, a farm should have concrete answers to:
- Data plan and connectivity: Satellite and cloud-based tools need a reliable way to sync field data — checked via cellular, wifi, or periodic upload, not assumed to work by default in every rural location.
- Who enters the data: Record-keeping software only saves the labor described in ERS’s figures if someone on the farm actually uses it consistently rather than reverting to paper mid-season.
- Integration with existing equipment: GPS auto-guidance savings of $15/acre depend on hardware compatibility — a software layer bolted onto incompatible equipment won’t produce that number.
- What the software doesn’t do: None of satellite monitoring, record-keeping or precision ag software fixes a classification or zoning problem like the one Minnesota’s flower farmers are lobbying to change — that requires a policy or legal path, not a technology one.
Farmonaut’s mobile apps put field monitoring in a farmer’s pocket rather than requiring a desktop login after a field visit: the Android app and iOS app both connect to the same satellite data referenced throughout this article, and the  gives a browser-based option for farm office use.


For a farm operation building its own internal tools rather than buying a finished product, Farmonaut’s API and API Developer Docs expose the same satellite and weather data programmatically — the option a larger operation or an agtech developer would use instead of a consumer app.
One category this article’s research base cannot fill honestly: peer-reviewed field studies quantifying yield improvement (in percentage terms) from general farm management software adoption, separate from the cost-savings figures above. Market research describes input reductions of up to 30% from precision ag broadly, but without a peer-reviewed source tying that figure to a specific yield percentage gain, it isn’t included here as a hard number — a reader who needs that specific evidence should look for university extension trial data for their state and crop, which is where controlled yield comparisons are typically run and published.
What Would Change This Picture
Three things would meaningfully update the numbers in this article, and each has a known place to check rather than a guess:
- Minnesota SF2626’s outcome — if enacted, the effective date for taxes payable in 2027 gives a hard checkpoint; track it through the Minnesota Legislature’s bill status page.
- USDA’s next Technology Use Survey — fielded biennially through NASS Quick Stats, next due August 2027, will refresh technology adoption rates beyond the August 2025 cycle referenced here.
- The 2027 Census of Agriculture — will update the $763 million cut-flower wholesale value and 10,800 farm count figures drawn from the 2022 Census, and may finally allow state-level floriculture detail to be checked against Minnesota specifically.
This is the durable test to apply to any “software for farmers” article, including this one: does it name where its numbers came from and when they expire, or does it present a snapshot as if it were permanent? A number without a refresh path is a number you can’t trust twelve months from now.

Earn With Farmonaut: Affiliate Program
Earn 20% recurring commission with Farmonaut’s affiliate program by sharing your promo code and helping farmers save 10%. Onboard 10 Elite farmers monthly to earn a minimum of $148,000 annually—start now and grow your income!
Farmonaut Subscriptions
Further reading:
FAQ
- Q: What does farm management software actually save, in dollars?
A: USDA’s Economic Research Service measured $25 per acre from yield mapping, $21 per acre from variable-rate fertilizer with soil mapping, and $15 per acre from GPS auto-guidance, all on US corn farms, published in its May 2016 Amber Waves report. These are the only USDA-sourced per-acre figures available; other crops don’t have an equivalent published breakdown. - Q: Is there software for farmers that doesn’t require buying new equipment?
A: Yes — satellite-based crop monitoring subscriptions, such as Farmonaut’s crop plantation and advisory services, deliver vegetation health and weather data without requiring GPS-equipped machinery, unlike variable-rate application or auto-guidance systems. - Q: What’s the best software for small farms specifically?
A: There’s no USDA cost-benefit study specific to farms under 500 acres, so “best” depends on which task costs you the most in labor today — field scouting, record-keeping, or loan/insurance paperwork — and matching a subscription-based tool to that task rather than buying precision-ag hardware sized for a row-crop operation. - Q: How many commercial flower farms are there in the US?
A: 10,800 as of the 2022 USDA NASS Census of Agriculture, generating $763 million in wholesale value for cut flowers and florist greens. The next full Census is due in 2027. - Q: Why does Minnesota’s SF2626 bill matter to software adoption?
A: Agricultural classification often determines eligibility for USDA programs, zoning for farm structures, and insurance products. A flower farm taxed as residential, as Bleed Heart Floral Farm was before this bill, faces a higher bar for justifying any software investment than a farm already classified as agricultural. - Q: How is “software for farmers” different from “precision agriculture software”?
A: Precision agriculture is one category within farm software — it covers GPS, variable-rate application and yield mapping. Crop management and record-keeping software made up 38% of the US precision farming software market by category as of 2025, per IMARC Group’s market analysis, meaning most farm software spending isn’t on precision-ag hardware integration at all.
For developers interested in integrating Farmonaut’s technology into their own applications, check out our API and API Developer Docs.

 Farmo
Farmo Kubota
 FFBS
FFBS Jontra
 Kalustyan
 Tucor
Tucor Geno
Geno Hayleys Agriculture
 Linx Agritech
 Adinet
 Save Your Soils
 Grandstream Algérie
 XOS Realty
 Geospatial Lab Africa
 Agro La Gándara
 HIPSAC
