

Reviewed September 2026 against USDA NASS Grain Stocks data and USDA ERS precision agriculture research.
Try it: Run your own numbers →
US on-farm grain storage capacity stood at 13.6 billion bushels as of December 1, 2024, with total US capacity (on-farm plus off-farm) at 25.5 billion bushels, according to USDA’s National Agricultural Statistics Service. Storage technology — the sensors, dryers, loadout systems, and software layered onto that capacity — is what determines whether a bin protects grain value or quietly leaks it through spoilage, slow turns, and missed pricing windows. This article covers what grain storage technology actually is, how integration solutions connect physical infrastructure to farm software, and how to evaluate a provider against your own bushel count and market access.
NASS reports peak on-farm storage utilization reaching 80% during December 2025, against a 70% average utilization rate across the 2020–2025 period. That gap between “average” and “peak” is the whole storage problem in one number: capacity sits idle for months, then gets slammed at harvest, which is exactly when moisture control, throughput speed, and market timing matter most and when farmers have the least slack to fix a bad system.
Table of Contents
- What Grain Storage Technology Actually Covers
- Capacity vs. What Your Operation Actually Needs
- Grain Storage Technology Integration Solutions
- Grain Market Access: Storage as a Pricing Tool
- Case Study: A Shuttle Loader Facility in Wisconsin
- Choosing a Grain Storage Technology Provider
- The Software Layer: Where Farm Management Meets Storage
- Storage Throughput & Turnaround Calculator
- FAQs
- Try it: Run your own numbers
What Grain Storage Technology Actually Covers
“Grain storage technology” is a broad label, and providers use it loosely. In practice it breaks into four layers, each solving a different problem:
- Storage structures: steel bins, flat storage, and bunkers sized in bushels, ranging from farm bins under 50,000 bushels to commercial shuttle facilities in the millions.
- Drying and conditioning: continuous-flow or batch dryers rated in bushels-per-hour (bph), plus aeration fans that hold moisture and temperature within safe storage ranges.
- Handling and loadout: dump pits, legs, conveyors, and bulk weighers that determine how fast grain moves in and out — a direct driver of harvest-season bottlenecks.
- Monitoring and software: temperature cables, moisture sensors, and the dashboards or apps that turn bin-level readings into an action (run the fan, call the buyer, schedule a truck).
A gap the research for this article surfaced directly: there is no published, quantified adoption rate for on-farm automated grain storage monitoring — wireless sensor networks, IoT bin monitoring, real-time moisture/temperature tracking — across the US farm population. Trade press describes these systems as reshaping storage management, but no NASS, ERS, or industry survey breaks out what share of bins carry them. If you need that figure for a specific state or crop, the closest proxy is your local co-op’s or elevator’s own equipment vendor, who can tell you what fraction of their client base has ordered sensor retrofits in a given year — ask for a number, not an impression.
Capacity vs. What Your Operation Actually Needs
Before evaluating any technology or provider, size the problem in bushels. USDA NASS put final 2024 US corn yield at 183.8 bushels per acre and final 2024 US soybean production at 4.37 billion bushels. Multiply your own planted acres by your county’s typical yield (available from the same NASS Crop Production release, updated annually) to get a rough harvest volume, then compare that to your current on-farm storage. If your harvest volume regularly exceeds 70–80% of your bin capacity — the same range NASS reports for the national average-to-peak swing — you are in the zone where most farms start evaluating additional storage or faster drying/handling rather than just more bins.
This is also where “grain storage technology” and “grain storage solutions” as search terms diverge from what a provider actually sells. A solutions provider might sell you bins; a technology provider sells the sensors, drying automation, and software that make existing bins run closer to their rated capacity without new steel. Both are legitimate answers depending on whether your constraint is capacity or throughput.
US Storage Capacity at a Glance
| Metric | Figure | As of | Source |
|---|---|---|---|
| US on-farm storage capacity | 13.6 billion bushels | December 1, 2024 | USDA NASS Grain Stocks Survey |
| US total storage capacity (on-farm + off-farm) | 25.5 billion bushels | December 1, 2024 | USDA NASS Grain Stocks Survey |
| Average on-farm utilization | 70% | 2020–2025 period | USDA NASS Grain Stocks Survey |
| Peak on-farm utilization | 80% | December 2025 | USDA NASS Grain Stocks Survey |
| 2024 US corn yield (final) | 183.8 bushels/acre | 2024 crop year | USDA NASS Crop Production report |
| 2024 US soybean production (final) | 4.37 billion bushels | 2024 crop year | USDA NASS Crop Production report |
NASS reissues Grain Stocks data quarterly and Crop Production data annually each January, so pull current figures directly from NASS’s Grain Stocks survey page rather than treating the numbers above as fixed — they are the most recent published figures as of this review, not a permanent ceiling.
Grain Storage Technology Integration Solutions
“Integration” is the operative word people search for, and it means something specific: making bin sensors, dryers, scale tickets, and farm records talk to each other instead of living in separate systems. A farm running a standalone moisture cable readout, a paper scale ticket book, and a spreadsheet for grain contracts has three data silos. Integration solutions collapse those into one view — typically a dashboard that shows bin-by-bin temperature and moisture trends alongside contract and delivery status.
The broader precision agriculture software category this sits inside was sized at $470.31 million in the US for 2025, with IMARC Group projecting growth to $1,263.52 million by 2034 — an 11.61% compound annual growth rate over the 2026–2034 forecast period. Grain storage integration software is a subset of that market, not a separately tracked category, so no independent dollar figure exists for it alone; if you need one, ask a prospective vendor for their own installed-base count and year-over-year growth rather than accepting an industry-wide number as a stand-in.
On adoption of the underlying digital infrastructure this software depends on, USDA’s Economic Research Service found that automated guidance systems were used on 50% of combined US corn, soybean, cotton, rice, sorghum, and winter wheat acreage in 2024. That figure is for field equipment guidance, not storage monitoring specifically, but it establishes that half of major-crop acreage is already generating the kind of precision data (yield maps, harvest timing) that a storage integration system would ideally consume. The research gap noted above — no farm-size breakdown of storage technology ownership, and no verified ROI/payback studies for sensor or integration retrofits — means a vendor claiming a specific payback period for your farm should be asked to show their calculation, not just their conclusion. Full detail: USDA ERS precision agriculture adoption report.
What “Integration” Should Actually Deliver
- One dashboard, not three: bin sensor data, drying logs, and delivery records in a single view, not separate apps you reconcile manually.
- Automated alerts: a temperature or moisture threshold breach triggers a notification, not a scheduled manual check.
- Equipment compatibility: the system reads your existing bin cables and dryer controllers rather than requiring a full hardware swap — ask this question first, since retrofit cost is the gap most likely to sink a project’s economics.
- Field-to-bin continuity: harvest yield data feeding directly into a storage capacity plan, closing the loop between what’s coming and where it’s going.
Grain Market Access: Storage as a Pricing Tool
Storage capacity and market access are the same decision viewed from two angles. A farm that can hold grain past harvest — when local basis is typically at its worst because everyone is selling at once — has the option to wait for better pricing or better transport access. A farm without spare capacity sells at harvest regardless of price, because the grain has nowhere else to go. This is the mechanism behind “grain market access” as a search term: it is rarely about finding a buyer and almost always about having the storage and logistics to reach more than one buyer, on your own schedule.
Two logistics factors set that grain market reach independent of your bin count: proximity to river or rail loading points, and whether your local elevator or co-op runs unit-train loadout that qualifies for railroad shuttle rates (typically requiring 75–110 cars loaded within a set window, terms set by the individual railroad, not a fixed national figure). Ask your elevator directly what shuttle-rate threshold applies to their facility and how it compares to single-car rates for your specific commodity and destination — this varies by railroad contract and is not published as a general figure.
Case Study: A Shuttle Loader Facility in Wisconsin
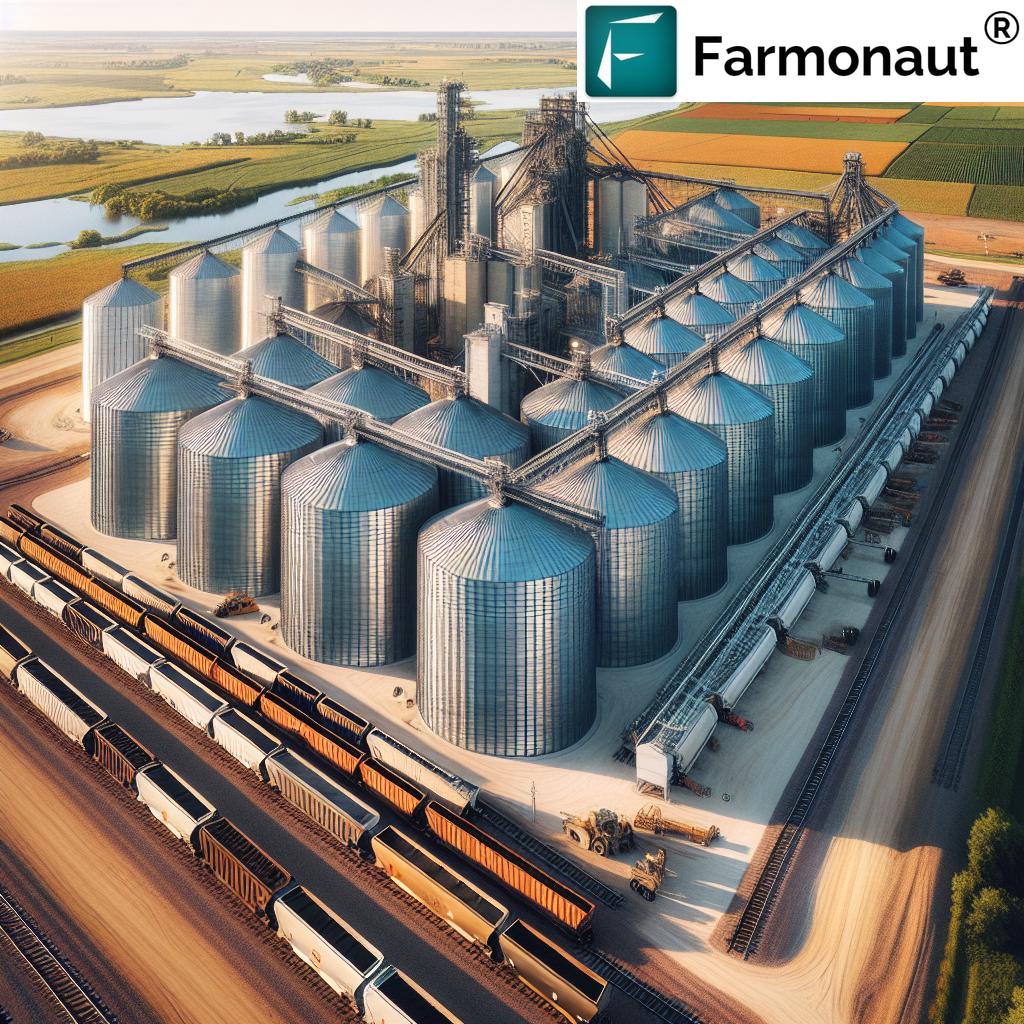
Alcivia, a member-owned agricultural and energy cooperative, opened a shuttle loader facility in Hager City, Wisconsin in partnership with Burlington Northern Santa Fe (BNSF) Railway, with a ribbon-cutting held in March 2025 following construction that began in April 2024. The facility illustrates what “integration solutions” look like at commercial scale, combining storage, drying, handling, and rail access on one 40-acre site:
| Feature | Hager City Facility | Typical Farm-Scale Storage |
|---|---|---|
| Storage capacity | 3.9 million bushels (eight steel bins) | Farm bins commonly range from a few thousand to 50,000+ bushels per bin |
| Drying capacity | Two 4,700 bph dryers | Single dryer, well under 1,000 bph on most farms |
| Handling speed | 60,000 bph combined, via three 1,500-bushel dump pits | A few thousand bph via a single leg |
| Rail infrastructure | 21,573 linear feet of Class I BNSF track | None; dependent on trucking to nearest elevator |
| Train loadout | 80,000-bushel bulk weigher, loads a unit train in under 10 hours | Not applicable |
The strategic value here isn’t the bushel count alone — it’s the combination of river access (to the Mississippi and Illinois rivers) with rail-loadout speed, which gives member farmers a choice of transport mode and destination market rather than a single fixed buyer. Alcivia has also outlined planned additions including a 24-hour unattended two-bay liquid fertilizer loading terminal and rail liquid propane unloading and storage, which would extend the site from a grain-only facility into a combined input-and-output hub.

Choosing a Grain Storage Technology Provider
Whether you’re evaluating a commercial-scale build or a monitoring retrofit on an existing bin, the same questions apply. Use this as a checklist when comparing providers — it stays useful regardless of which vendor’s numbers change next season:
- What’s the rated throughput, in bph, for drying and handling — and is that a manufacturer spec or a measured field number? A facility’s real bottleneck is usually the slowest single component, not the average.
- Does the monitoring system integrate with equipment you already own, or does the quote assume a full hardware replacement? Ask for the retrofit cost separately from the new-build cost.
- What’s the actual payback calculation, not just a claimed payback period? Since no independent, verified ROI study exists for sensor/integration retrofits (a gap confirmed in researching this article), ask the vendor to walk through their own assumptions on shrinkage or spoilage avoided, priced against your own bushel volume and local basis.
- What transport access does the location offer — river, Class I rail, or truck-only — and does that match where you actually intend to sell?
- Is pricing bundled or itemized across structure, drying, handling, and software/monitoring? Bundled quotes make it hard to compare a technology-only upgrade against a full-storage build.
The Software Layer: Where Farm Management Meets Storage
Physical storage infrastructure answers “where does the grain go.” The software layer answers “what do I do with the data.” This is where a satellite-based farm management platform like Farmonaut complements bin-level monitoring rather than competing with it: crop health and yield-outlook data from the field feeds the same planning process that determines how much storage and drying capacity you’ll need at harvest.
Farmonaut’s web app, Android app, and iOS app give farmers satellite crop monitoring, resource-use tracking, and yield-relevant data through interfaces designed to be usable without a lengthy onboarding process — directly relevant if your operation is weighing connected agriculture software that has to work for non-technical field staff on day one, not after weeks of training.

The connection to storage planning is direct: satellite crop monitoring that tracks crop health through the season gives an earlier read on expected harvest volume than waiting for the combine yield monitor, which means a storage or drying capacity shortfall can be identified — and a rental bin or forward contract arranged — weeks before harvest instead of during it.

This same principle extends to farms running both livestock and crops. Farm management software built to track both in one interface — rather than a crop-only or livestock-only tool — lets a single dashboard cover feed-grain storage needs alongside herd records, which matters directly to any operation searching for the best farm management software to track livestock and crops without running two disconnected systems.
Physical and Digital Infrastructure, Side by Side
| Layer | What It Solves | Example |
|---|---|---|
| Physical storage & handling | Where grain is held and how fast it moves | Bins, dryers, dump pits, rail loadout (e.g., Hager City, WI facility) |
| Bin-level monitoring | Whether stored grain stays within safe temperature/moisture range | Sensor cables, aeration control, alert thresholds |
| Field-level monitoring | What volume and quality is coming before harvest | Satellite crop health tracking (e.g., Farmonaut) |
| Market & logistics access | Where and when grain gets sold and shipped | River/rail proximity, shuttle-rate loadout, contract tracking |
Developers building on top of this data layer rather than just consuming an app can work directly with satellite and weather feeds through Farmonaut’s API, with implementation details in the API Developer Docs — relevant to any grain handler or co-op wanting to pull crop-outlook data into their own storage-planning system rather than working across separate platforms.

Storage Throughput & Turnaround Calculator
Use your own harvest volume and equipment ratings to estimate how many hours of handling time your operation needs at harvest, and how that compares to your available harvest-window days — the same throughput logic that separates a 60,000 bph commercial facility from a farm running a few thousand bph.
Run your own numbers
Assumes constant handling/drying rate with no downtime, weather delays, or truck-availability bottlenecks — real harvest throughput is normally lower than rated equipment speed. Excludes drying time for above-target moisture grain, which reduces effective throughput separately from handling speed.
FAQs
- Q: How much on-farm grain storage capacity exists in the US?
A: 13.6 billion bushels as of December 1, 2024, per USDA NASS; total US capacity including off-farm storage was 25.5 billion bushels the same date. NASS updates this figure quarterly — check the Grain Stocks survey page for the current release. - Q: What does "grain storage technology integration" mean in practice?
A: Connecting bin-level sensors (temperature, moisture), drying/aeration controls, and handling equipment to a single software dashboard, rather than operating each as a separate manual system. - Q: Is there a proven ROI for grain storage sensor systems?
A: No independent, verified payback-period study for on-farm sensor or integration retrofits was found in researching this article. Ask any vendor to show their own shrinkage/spoilage-avoided calculation against your bushel volume rather than accepting a stated payback figure at face value. - Q: How does grain storage improve market access?
A: Storage capacity lets a farm hold grain past harvest, when local basis is typically weakest, and reach buyers via multiple transport modes (river, rail, truck) instead of selling immediately to whichever buyer is nearest. - Q: How much can a commercial shuttle loader facility store, and how does that compare to farm-scale storage?
A: The Hager City, Wisconsin facility built by Alcivia and BNSF holds 3.9 million bushels across eight bins, versus farm bins typically in the low thousands to 50,000+ bushels each. - Q: What's the growth outlook for precision farming software in the US?
A: IMARC Group sized the US precision farming software market at $470.31 million for 2025, projecting $1,263.52 million by 2034 — an 11.61% CAGR over 2026–2034.
Earn With Farmonaut: Affiliate Program
Earn 20% recurring commission with Farmonaut's affiliate program by sharing your promo code and helping farmers save 10%. Onboard 10 Elite farmers monthly to earn a minimum of $148,000 annually—start now and grow your income!

For more on how satellite technology and storage infrastructure work together, visit Farmonaut's web app, download the Android app, or get the iOS app. Developers integrating satellite and weather data into a storage or grain-handling platform can explore the API and the API Developer Docs.

 Godrej Agrovet
 Hayleys Agriculture
 Linx Agritech
 Adinet
 Save Your Soils
 GalaxEye Space
 Grandstream Algérie
 XOS Realty
 Geospatial Lab Africa
 Agro La Gándara
 HIPSAC
 ZOL Zimbabwe
 Juligerm
 AdBio
AdBio MISE Maroc
 NWNS
NWNS Red August Group
 Farm Inc
 WeMe Global
