Land Use Map Colors: Enhance New Jersey Agriculture
Meta Description: Land use maps utilize color coding and GIS technology to optimize New Jersey agriculture, enabling efficient planning, analysis, and sustainable land management decisions.
In This Article:
- Introduction: The Power of Land Use Map Colors in New Jersey Agriculture
- Understanding Land Use Maps
- The Role of Color Coding in Land Use Maps
- Color Coding in Agricultural Land Use
- Color Coding in Forestry Land Use Mapping
- Standardization and Consistency in Land Use Data
- Land Use Map Color Legend and Agricultural Applications
- Applications in New Jersey Land Management and Zoning
- Farmonaut: Satellite-Based Solutions for Precision Agriculture
- Challenges in Color Coding and Land Use Mapping
- Advancements in GIS Technology for Land Use Monitoring
- FAQs about Land Use Map Colors & GIS in New Jersey Agriculture
- Conclusion: Mapping a Future for Sustainable Agriculture with GIS Tools
Introduction: The Power of Land Use Map Colors in New Jersey Agriculture
Land use maps are indispensable tools for modern agriculture, forestry, and conservation efforts across New Jersey. With the growing complexity of land utilization and environmental pressures, the combination of color coding on maps and advanced GIS technology provides us with unmatched clarity, efficiency, and actionable insights in land use planning and zoning.
Understanding how to interpret these color coded land use maps empowers us, as farmers, agribusinesses, policymakers, and environmental advocates, to make informed, sustainable decisions that shape the future of our land.
In this comprehensive guide, we explore the essential map colors that define New Jersey’s landscape, their implications for agricultural land management, and the sophisticated systems—like Farmonaut—transforming the way we monitor, analyze, and optimize our state’s richest natural resource: our land.
Understanding Land Use Maps
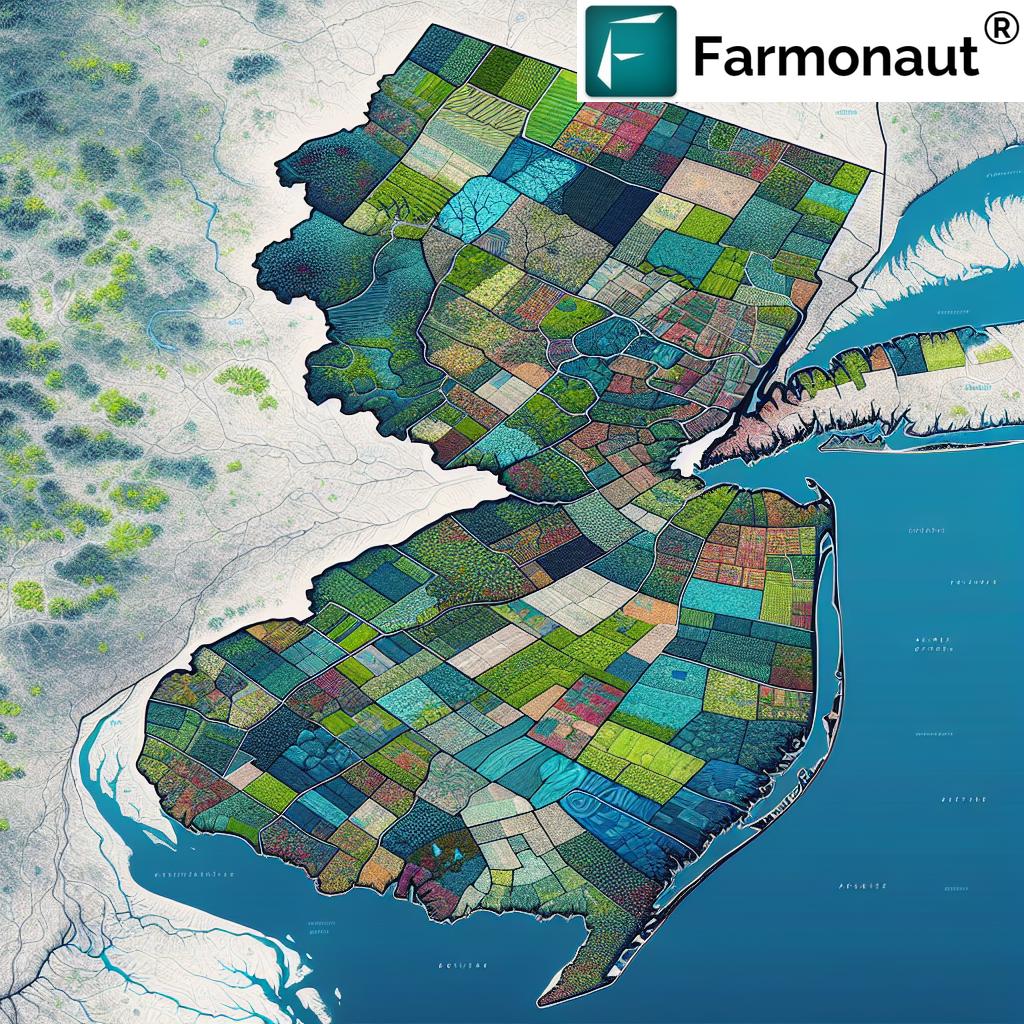
Land use maps visually depict how land is allocated for various purposes—from agriculture and forestry to urban development and conservation. These tools help us identify patterns, assess land suitability, and monitor changes over time, assisting stakeholders at every level.
- Depict the extent and distribution of land use categories.
- Illustrate urban, agricultural, forested, pasture, and water body areas.
- Aid in effective land management and resource allocation.
- Support policy development and conservation efforts.
In New Jersey, with its mix of densely populated cities and rich agricultural regions, land use maps serve as vital instruments for zoning, planning, and environmental monitoring. By harnessing GIS land use mapping and high-resolution satellite data, we get both macro and micro views of evolving landscapes, making it easier than ever to identify opportunities and respond to challenges.
The Role of Color Coding in Land Use Maps for Agriculture
Color coding is the cornerstone of intuitive, accessible land use representation. By assigning distinct colors to specific land use categories, maps become instantly readable, enabling every stakeholder—from farmers to policymakers—to quickly assess the landscape and make data-driven decisions.
- Green: Represents forest or tree cover—from dense woodlands to orchards.
- Yellow: Indicates cropland or agricultural fields where food, fiber, or biofuel crops are grown.
- Blue: Marks water bodies—rivers, lakes, reservoirs.
- Gray: Denotes urban or built-up areas such as towns and cities.
- Brown: Highlights pasture, grassland, or slowly regenerating land.
This visual differentiation simplifies the interpretation of complex spatial data. A quick glance at the map reveals the spatial distribution of New Jersey’s prime agricultural and forestry resources, allowing for efficient planning, resource allocation, and prompt response to environmental shifts.
Color Coding in Agricultural Land Use: Crops, Practices, and Resource Allocation
In agriculture, color coded land use maps allow us to easily delineate areas dedicated to specific crop types or farming systems. The USDA’s Cropland Data Layer (CDL) is a prime example, featuring a standardized color scheme for each distinct crop—corn, soybeans, wheat, fruits, and more.
This standardization strengthens our crop distribution analysis, identification of trends, and adaptive management:
- Efficiently analyze which areas grow what crops, year over year.
- Assess land suitability for introducing new crops or adjusting practices.
- Enhance resource allocation in agriculture—targeting irrigation, fertilizer, and pest control where needed.
- Support sustainable agricultural practices by visualizing land use changes.
Through GIS land use mapping and accessible mobile or web apps, such as those offered by Farmonaut, even smallholder farmers can leverage color coded land use maps for practical decisions in real time.
Manage plantation and field boundaries with Farmonaut’s large-scale farm management tools for precise land allocation and ongoing monitoring.
Color Coding in Forestry Land Use Mapping: Forests, Orchards, and Conservation
In forestry and conservation, color coded maps enable us to distinguish forest types, conservation areas, orchards, nurseries, and vineyards. For instance, the New Jersey Department of Environmental Protection (DEP) applies precise color schemes to represent forest stands, managed orchards, and nursery areas, promoting effective monitoring and management.
- Identify contiguous forest resources (green), orchard and vineyard (often different shades of green or orange), and silvicultural areas for specialized management.
- Pinpoint conservation land mapping priorities to preserve biodiversity corridors.
- Assess risks from urban encroachment or land use changes that threaten forest integrity.
Through GIS land use mapping and remote sensing data, we are better equipped than ever to trace the extent, health, and changes in our forests, which is crucial for long-term sustainability and carbon sequestration.
Standardization and Consistency in Land Use Data Across New Jersey
Consistency across land use maps is essential for accurate analysis and comparability. Standardization ensures that a “green” polygon on different map layers always means the same thing—whether you’re reviewing data from 2005 or 2024.
For example, the USDA’s CDL aligns 133 categories and over 60 colors into a fixed scheme for all years, making temporal comparisons straightforward. In New Jersey, DEP and state-level GIS authorities adopt similar standardized color schemes so users can reliably compare regions, track changes, and make long-term decisions.
- Ensures data reliability for crop distribution analysis and forecasting.
- Supports policy formulation by providing consistent evidence.
- Enables rapid interpretation even by lay stakeholders or new users.
Land Use Map Color Legend and Agricultural Applications
The following table helps us instantly connect map colors with their meanings, area significance, and practical implications for agriculture, forestry, and conservation in New Jersey.
| Map Color | Land Use Category | Estimated Land Coverage (%) in New Jersey |
Agricultural/Environmental Implications |
|---|---|---|---|
| Green | Forests, Orchards, Vineyards | 44% | Supports biodiversity, carbon sequestration, timber & specialty fruit production; critical for environmental conservation. |
| Yellow | Cropland/Agricultural Fields | 36% | Primary areas for crop production, food security, supports major farming operations; focus for resource allocation in agriculture. |
| Blue | Water Bodies (lakes, rivers, reservoirs) | 5% | Irrigation source, regulates microclimate, supports conservation and watershed management. |
| Gray | Urban/Built-up Areas | 10% | Represents non-agricultural land, influences zoning and urban encroachment, challenges to agricultural land management. |
| Brown | Pasture/Grassland/Fallow | 5% | Grazing, rotational crops, potential for reclamation or conservation land mapping. |
Innovative Technology in GIS Land Use Mapping and Monitoring
Explore these videos to understand how Farmonaut and remote sensing advancements are transforming agricultural and forestry land management in New Jersey and beyond:
Applications in New Jersey Land Management and Zoning
Color coded land use maps and satellite-aided GIS provide us with core benefits in the following ways:
- Land Use Planning and Zoning: Clear delineation of land dedicated to agricultural, forestry, conservation, or urban development, guiding sustainable policy decisions.
- Resource Allocation in Agriculture: Directs fertilizer, irrigation, crop protection, and technology investments where they make the biggest impact.
- Conservation Land Mapping: Pinpoints sensitive areas for biodiversity preservation—wetlands, riparian zones, and species corridors.
- Monitoring Land Use Changes: Tracks agricultural expansion or forest fragmentation, facilitating adaptive management and enforcement of environmental protection laws.
- Policy Formulation: Informs development of urban growth boundaries, agricultural preservation programs, and zoning ordinances.
For policymakers, agronomists, and local planners in New Jersey, these maps are instrumental for:
- Balancing urban growth with the preservation of prime farmland.
- Optimizing locations for state and county agricultural programs.
- Mitigating conflicts between different land use categories.
Explore how satellite-driven land monitoring and carbon tracking support sustainability at Farmonaut Carbon Footprinting Platform.
Farmonaut: Satellite-Based Solutions for Precision Agriculture and Land Management
At Farmonaut, we are redefining the accessibility and value of precision agriculture for New Jersey and beyond. By utilizing multispectral satellite imagery, AI-powered insights, and mobile accessibility, we empower all users to leverage:
- Real-Time Crop Health Monitoring: Stay updated on vegetation indices, soil moisture, and stress zones for smarter agricultural land management.
- AI-Based Advisory with Jeevn: Get automatic crop and weather advisories to improve yields, reduce risks, and minimize costs.
- Blockchain-Based Product Traceability: Bring transparency and trust to your supply chain. Learn more about Farmonaut Traceability.
- Fleet and Resource Management: Track and optimize your machinery and logistics. Discover Farmonaut Fleet Management benefits.
- Environmental Monitoring and Carbon Tracking: Quantify emissions, demonstrate sustainability, and adhere to regulatory standards.
- API Access for Integration: Seamlessly integrate land use data with your systems (API”), developer docs at Farmonaut Satellite API Docs.
Our solutions are available to individual farmers, agribusinesses, government agencies, and corporate supply chain leaders.
Try our web and app platform for unmatched land monitoring, field mapping, and data-driven decision support.
If you need advisory on crop suitability or plantation, check out our crop, plantation, and forest advisory solutions.
Challenges and Considerations in Color Coding and Land Use Mapping
As with any system, color coded land use maps come with important considerations we must address:
- Color Perception Variability: Color blind users may need alternative patterns or legends for full accessibility.
- Cultural Color Associations: While green represents forests in the US, other regions may use different schemes—global datasets must be mindful of this variation.
- Data Resolution: Coarse-resolution data can obscure fine land use differences—high-resolution, frequently updated imagery is essential.
- Temporal Comparability: Consistent mapping standards over years are necessary so that trends and changes are not masked by changes in color definitions.
We continue to improve accessibility and clarity through design enhancements, public training, and open data policies.
Advancements in GIS Technology for Land Use Monitoring and Analysis
Remote sensing and Geographic Information Systems (GIS) have given us a new toolkit in land management:
- Efficient processing of massive datasets for multi-seasonal and multispectral analysis.
- Frequent tracking of land use changes—down to the parcel level.
- Systematic assessment of land suitability for agriculture, forestry, and conservation.
- Automated alerts and advisories for changes or threats to critical land areas.
- Precision mapping to support crop loans and insurance verification; see Farmonaut’s Crop Loan & Insurance solution.
For instance, the Canada Land Inventory mapped and evaluated millions of acres for its capability for agriculture and forestry using GIS, a practice now routinely implemented across US states, including New Jersey.
This technological leap benefits individual farmers, agribusinesses, local governments, and conservation leaders by equipping them to adapt to challenges—such as climate change, urban expansion, and food security—faster and more effectively.
FAQ: Land Use Map Colors & GIS in New Jersey Agriculture
1. What are land use maps and why are they important for agriculture?
Land use maps visually represent the allocation and usage of land across different categories (such as cropland, forest, urban, water, pasture, etc.). In New Jersey, they allow us to plan, monitor, and manage agricultural and forestry lands efficiently—whether for zoning, conservation, or crop optimization.
2. How does color coding enhance land use mapping?
Color coding assigns intuitive map colors to specific land use categories, making even complex spatial data easy to interpret. This improves decision-making for resource allocation, sustainability planning, and rapid policy assessments.
3. What is the Cropland Data Layer (CDL) and how does it support crop distribution analysis?
The CDL is a standardized, color-coded GIS dataset from the USDA depicting annual crop types and distribution. It helps stakeholders analyze trends, track changes, and allocate resources more efficiently.
4. How can Farmonaut’s technology help me monitor or manage my land in New Jersey?
Farmonaut offers real-time, satellite-based crop and land monitoring (NDVI, soil moisture, field boundaries), AI-driven crop health advisories, blockchain-based traceability, and rich resource management tools—accessible via Android, iOS, web apps, and API.
Try Farmonaut for free
5. Can these map colors and systems help with conservation and environmental policy?
Yes. Conservation land mapping and zoning are greatly simplified through color-coded GIS maps. Planners can easily identify sensitive lands, monitor habitat changes, and prioritize environmental interventions.
6. Are these solutions mobile friendly?
Yes, Farmonaut’s apps and mapping tools are responsive and work seamlessly on desktop and mobile devices.
Conclusion: Mapping a Future for Sustainable Agriculture with GIS Tools
Land use maps that leverage color coding and GIS technology are crucial for the future of New Jersey agriculture, forestry, and conservation. These visual tools distill complex data into accessible, actionable information, empowering everyone from smallholder farmers to state policymakers.
As innovation continues, new solutions like those from Farmonaut put satellite-driven analytics and real-time advisory into your pocket—bridging the gap between big data and practical farming or conservation decisions.
By staying engaged with the latest advancements and standardized practices, we ensure our land is managed sustainably, profitably, and wisely for generations to come.
Land Use Map Colors: Enhance New Jersey Agriculture — Your guide to optimal land management, sustainability, and technology-driven farming success.


