Mastering Vegetation Indices: NDVI, NVI, and VARI – Essential Tools for Precision Agriculture and Remote Sensing
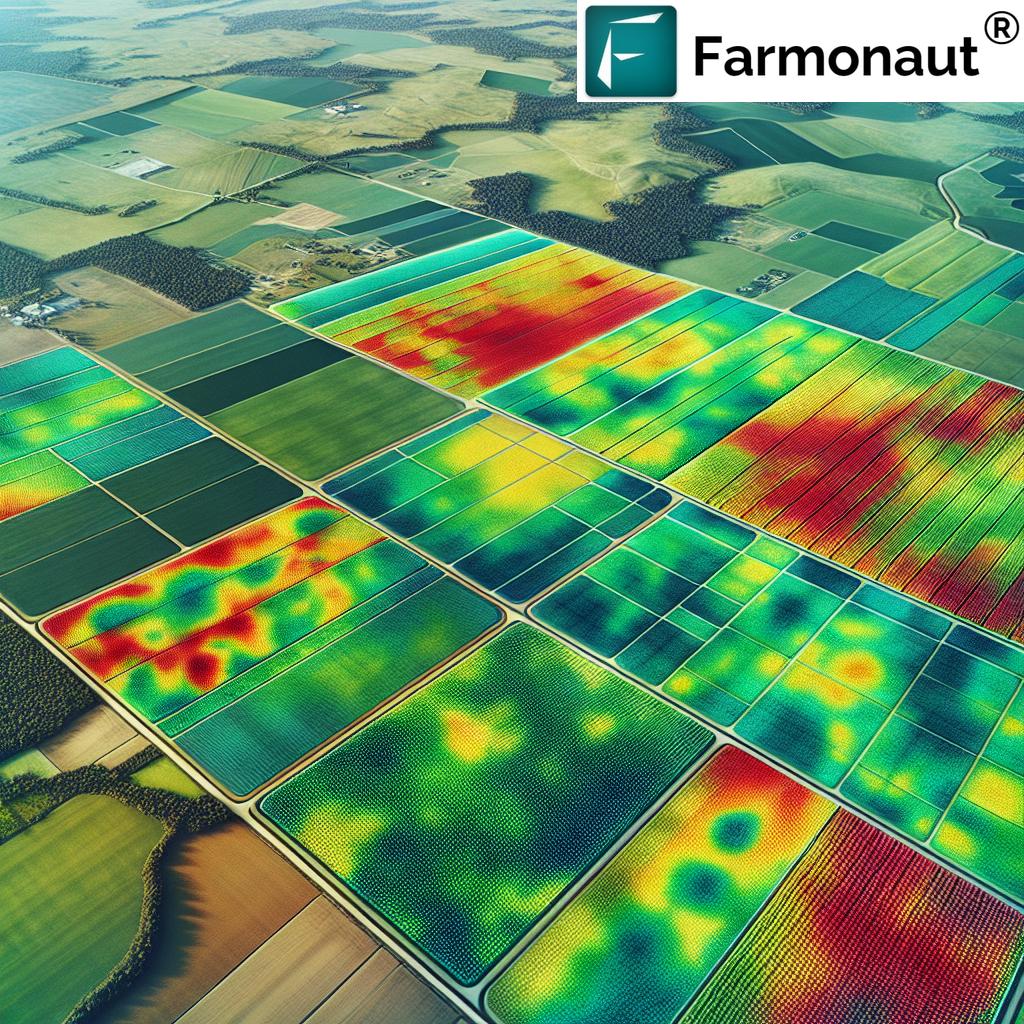
In the ever-evolving world of precision agriculture and remote sensing, understanding and utilizing vegetation indices has become crucial for farmers, agronomists, and researchers alike. At Farmonaut, we’re committed to harnessing the power of these indices to provide cutting-edge solutions for modern agriculture. In this comprehensive guide, we’ll delve deep into the world of vegetation indices, focusing on three key players: the Normalized Differential Vegetation Index (NDVI), the Normalized Vegetation Index (NVI), and the Visible Atmospherically Resistant Index (VARI).
Table of Contents
- Introduction to Vegetation Indices
- The Normalized Differential Vegetation Index (NDVI)
- The Normalized Vegetation Index (NVI)
- The Visible Atmospherically Resistant Index (VARI)
- Applications in Precision Agriculture
- Farmonaut’s Approach to Vegetation Indices
- Comparing Satellite, Drone, and IoT-based Monitoring
- Future Trends in Vegetation Indices
- FAQs
1. Introduction to Vegetation Indices
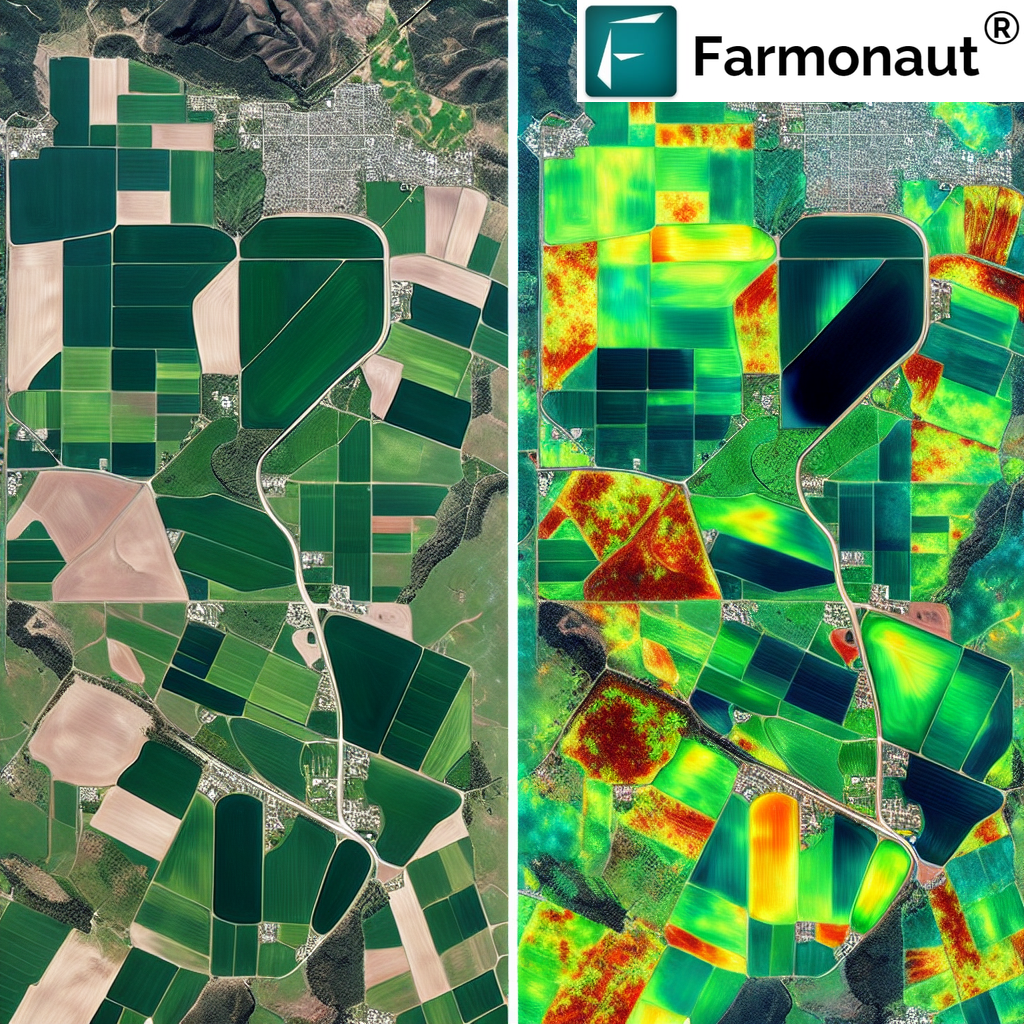
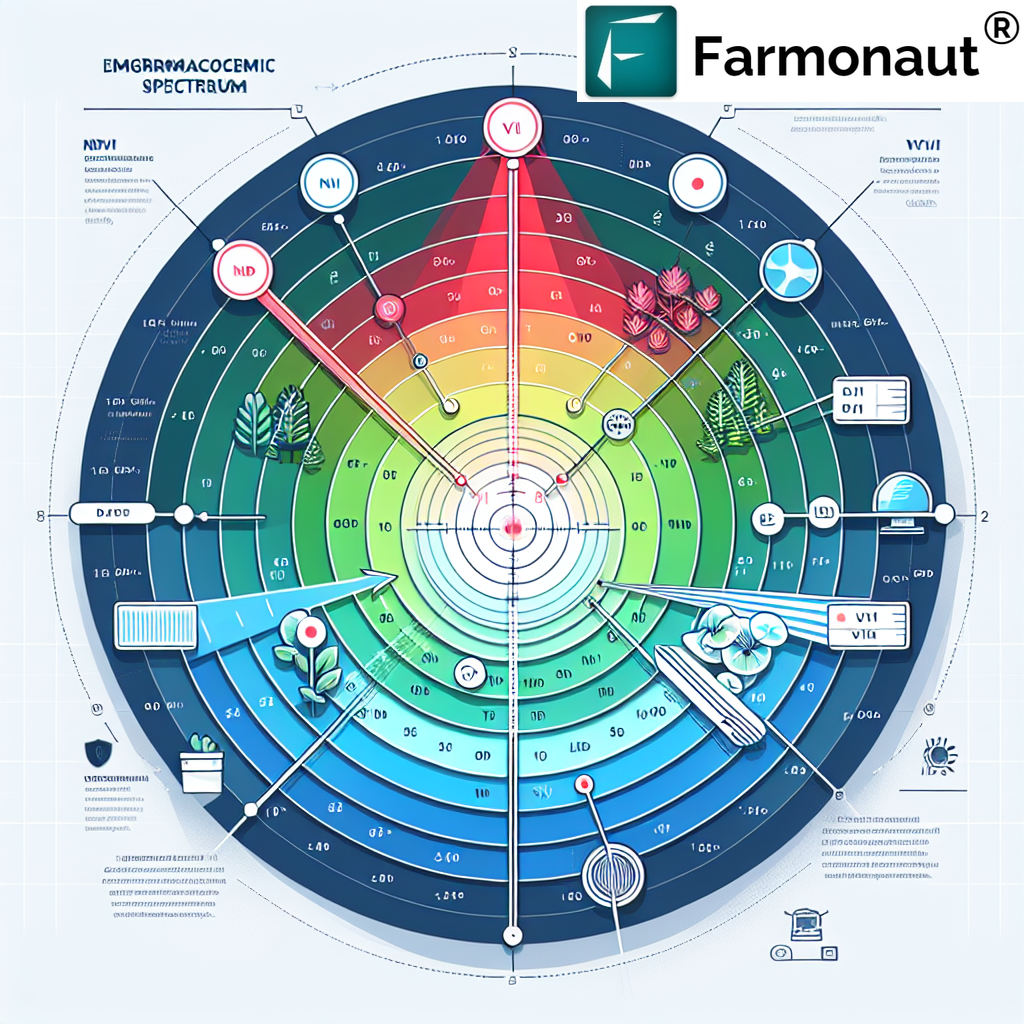
What is a vegetation index? At its core, a vegetation index is a mathematical combination of satellite multispectral data used to assess the vigor and health of vegetation. These indices exploit the unique ways in which plants reflect light in different parts of the electromagnetic spectrum.
Vegetation indices are powerful tools that allow us to:
- Quantify vegetation cover and biomass
- Assess plant health and stress levels
- Monitor crop growth and development
- Detect and analyze changes in land use and land cover
- Predict crop yields and productivity
By leveraging these indices, we at Farmonaut can provide farmers and agricultural professionals with valuable insights into their crops’ health and performance, enabling more informed decision-making and optimized resource management.
2. The Normalized Differential Vegetation Index (NDVI)
The Normalized Differential Vegetation Index (NDVI) is perhaps the most well-known and widely used vegetation index in remote sensing and precision agriculture. It’s a simple yet powerful tool that has revolutionized the way we monitor and analyze vegetation health from space.
Understanding NDVI
NDVI is based on the principle that healthy vegetation absorbs most of the visible light that hits it and reflects a large portion of near-infrared (NIR) light. In contrast, unhealthy or sparse vegetation reflects more visible light and less NIR light.
The NDVI formula is:
NDVI = (NIR – Red) / (NIR + Red)
Where:
- NIR = reflectance in the near-infrared band
- Red = reflectance in the red band
Which wavelengths are used to calculate the Normalized Differential Vegetation Index (NDVI)?
The specific wavelengths used to calculate NDVI can vary slightly depending on the satellite or sensor being used, but generally:
- Red band: typically around 620-670 nm
- Near-Infrared (NIR) band: typically around 841-876 nm
These wavelengths are chosen because they provide the most contrast between healthy vegetation and other land cover types.
Interpreting NDVI Values
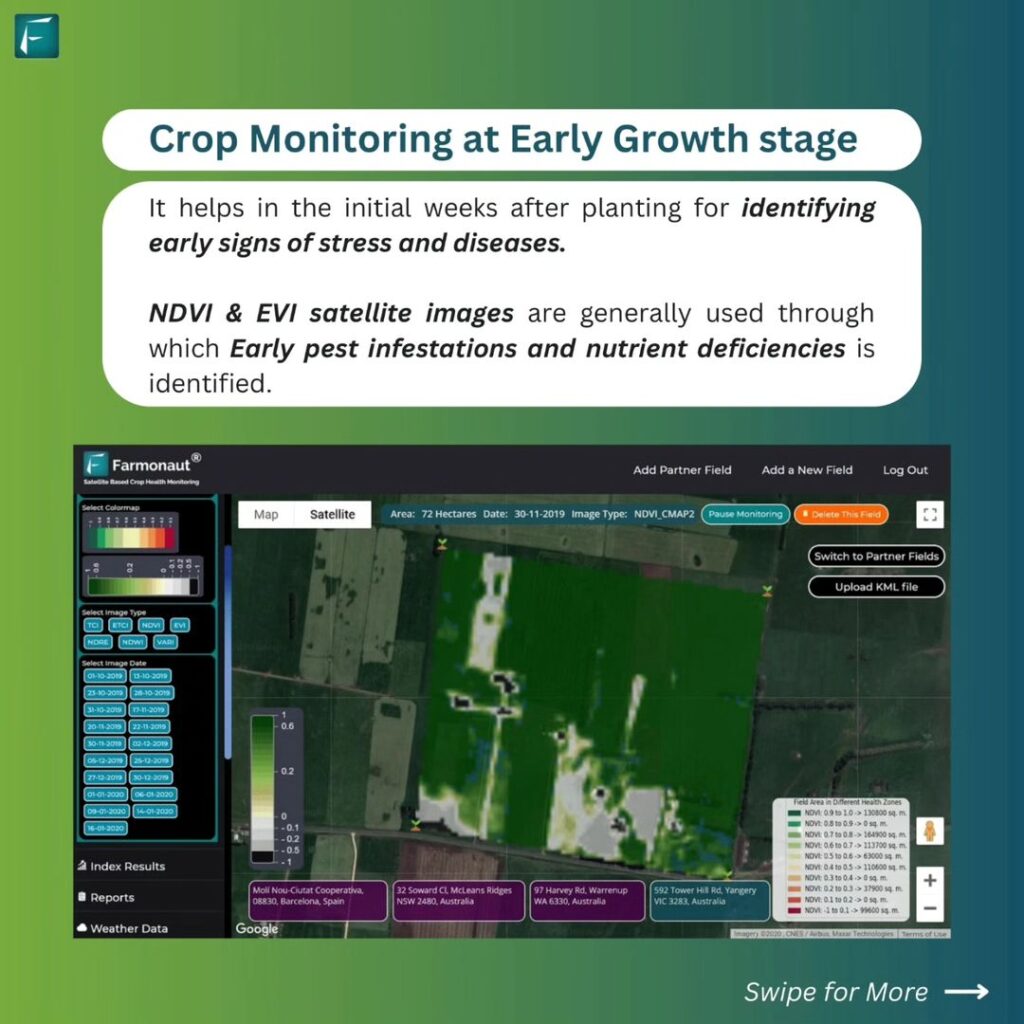
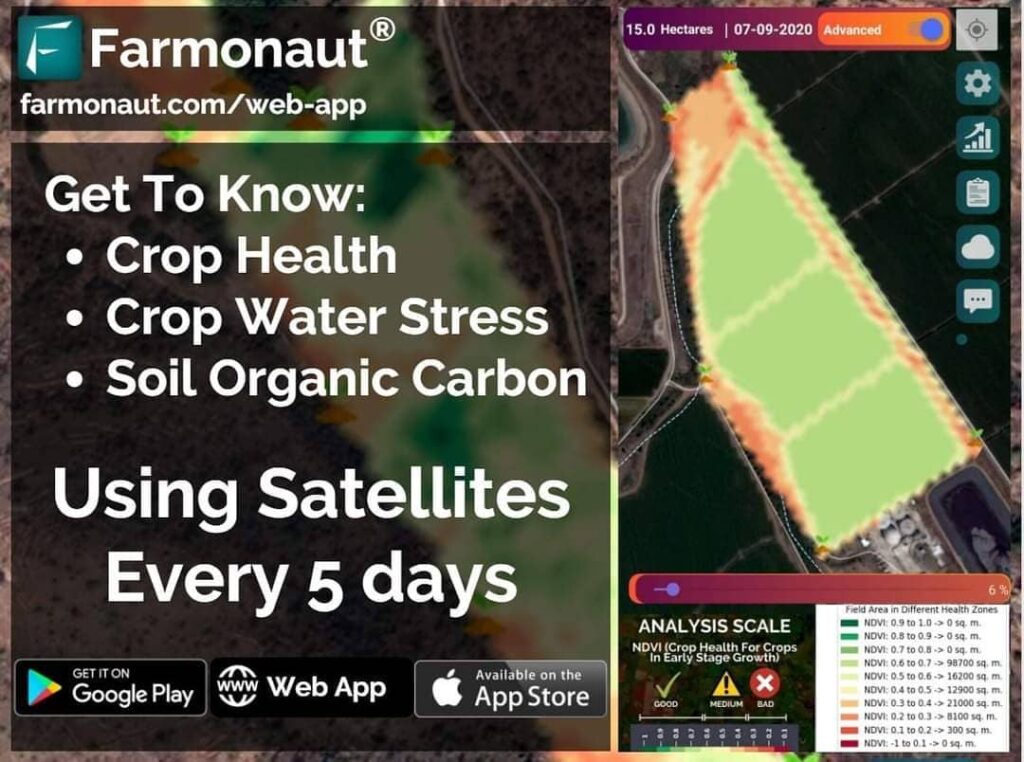
NDVI values range from -1 to +1:
- Values close to +1 (0.8 to 0.9) indicate dense, healthy vegetation
- Values around 0.2 to 0.5 suggest sparse vegetation
- Values close to 0 typically represent bare soil
- Negative values often indicate water, snow, or clouds
Applications of NDVI
At Farmonaut, we use NDVI for a variety of applications, including:
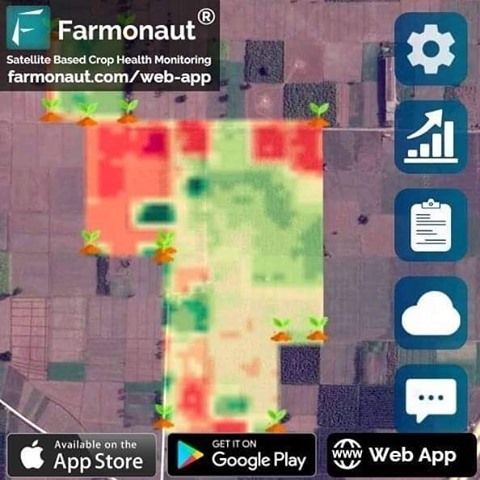
- Crop health monitoring: Detecting areas of stress or disease in crops
- Yield prediction: Estimating potential crop yields based on vegetation vigor
- Drought assessment: Identifying areas affected by water stress
- Land use change detection: Monitoring deforestation or urban expansion
- Precision agriculture: Guiding variable rate applications of fertilizers and pesticides
By integrating NDVI data into our satellite-based farm management platform, we provide farmers with actionable insights to optimize their agricultural practices.
3. The Normalized Vegetation Index (NVI)
While less commonly used than NDVI, the Normalized Vegetation Index (NVI) is another valuable tool in our remote sensing toolkit. NVI is particularly useful in certain scenarios where NDVI might face limitations.
Understanding NVI
The NVI is calculated using a slightly different formula than NDVI:
NVI = NIR / (NIR + Red)
This formula produces values ranging from 0 to 1, with higher values indicating healthier vegetation.
Advantages of NVI
NVI offers several advantages in specific situations:
- Less sensitive to atmospheric effects than NDVI
- More effective in areas with sparse vegetation
- Can be more sensitive to changes in canopy structure
Applications of NVI
At Farmonaut, we utilize NVI in conjunction with NDVI to provide a more comprehensive view of vegetation health. Some specific applications include:
- Monitoring vegetation in arid or semi-arid regions
- Assessing early-stage crop growth
- Detecting subtle changes in forest canopy structure
4. The Visible Atmospherically Resistant Index (VARI)
The Visible Atmospherically Resistant Index (VARI) is a newer addition to the family of vegetation indices. It’s designed to be less sensitive to atmospheric effects and works well with visible light bands only.
Understanding VARI
The VARI formula is:
VARI = (Green – Red) / (Green + Red – Blue)
Where:
- Green = reflectance in the green band
- Red = reflectance in the red band
- Blue = reflectance in the blue band
Advantages of VARI
VARI offers several unique benefits:
- Can be calculated using only visible light bands, making it suitable for use with a wider range of sensors
- Less affected by atmospheric conditions than NDVI
- Particularly effective for estimating vegetation fraction
Applications of VARI
At Farmonaut, we incorporate VARI into our suite of vegetation indices to provide a more robust analysis of crop health. Some key applications include:
- Estimating vegetation fraction in urban areas
- Monitoring crop senescence and maturity
- Assessing vegetation health in cloudy or hazy conditions
5. Applications in Precision Agriculture
The integration of vegetation indices into precision agriculture has revolutionized farming practices. At Farmonaut, we leverage these indices to provide a range of services that help farmers optimize their operations:
Crop Health Monitoring
By analyzing NDVI, NVI, and VARI data over time, we can detect early signs of crop stress, disease, or nutrient deficiencies. This allows farmers to take prompt action, potentially saving entire harvests.
Variable Rate Applications
Vegetation index maps guide the precise application of inputs like fertilizers and pesticides. This not only reduces costs but also minimizes environmental impact.
Irrigation Management
By correlating vegetation indices with soil moisture data, we help farmers optimize their irrigation schedules, conserving water while ensuring optimal crop growth.
Yield Prediction
Historical and current vegetation index data feed into our AI-powered yield prediction models, helping farmers and agribusinesses plan for harvest and market conditions.
Sustainability Tracking
Vegetation indices play a crucial role in our carbon footprinting feature, allowing agribusinesses to monitor and reduce their environmental impact.
6. Farmonaut’s Approach to Vegetation Indices
At Farmonaut, we don’t just use vegetation indices – we’ve built an entire ecosystem around them to provide comprehensive, actionable insights for our users.
Multi-Index Analysis
We utilize a combination of NDVI, NVI, and VARI, along with other proprietary indices, to provide a holistic view of crop health. This multi-index approach allows us to overcome the limitations of any single index and provide more accurate and reliable insights.
AI-Powered Interpretation
Our Jeevn AI advisory system doesn’t just deliver raw index values – it interprets them in the context of crop type, growth stage, local climate conditions, and historical data to provide personalized recommendations.
Time-Series Analysis
By analyzing vegetation index data over time, we can detect trends and anomalies that might not be apparent from a single snapshot. This temporal analysis is crucial for understanding crop development and predicting potential issues.
Integration with Other Data Sources
We combine vegetation index data with other sources such as weather forecasts, soil maps, and historical yield data to provide a comprehensive view of farm conditions and potential.
API Access
For developers and businesses looking to integrate our vegetation index data into their own systems, we offer API access. Check out our API documentation for more details.
7. Comparing Satellite, Drone, and IoT-based Monitoring
While drones and IoT sensors have their place in precision agriculture, satellite-based monitoring offers unique advantages, especially when it comes to vegetation indices. Here’s how Farmonaut’s satellite system compares:
| Feature | Farmonaut Satellite System | Drone-based Monitoring | IoT-based Monitoring |
|---|---|---|---|
| Coverage Area | Large (entire farms or regions) | Medium (limited by flight time and regulations) | Small (point-based measurements) |
| Frequency of Updates | Daily to weekly | On-demand, but labor-intensive | Continuous, but limited to sensor locations |
| Initial Setup Cost | Low (subscription-based) | High (equipment and training) | Medium to High (sensors and network) |
| Operational Complexity | Low (automated data acquisition and processing) | High (requires skilled operators and post-processing) | Medium (requires maintenance and data management) |
| Data Consistency | High (standardized acquisition and processing) | Medium (varies with flight conditions and equipment) | High for point data, but limited spatial coverage |
| Scalability | Highly scalable (from small farms to large regions) | Limited scalability (constrained by operational logistics) | Moderately scalable (requires additional hardware) |
While each method has its strengths, Farmonaut’s satellite-based system offers an unparalleled combination of coverage, consistency, and cost-effectiveness for vegetation index monitoring.
8. Future Trends in Vegetation Indices
As technology continues to advance, we at Farmonaut are always looking ahead to the future of vegetation indices and remote sensing. Here are some trends we’re excited about:
Hyperspectral Indices
With the advent of hyperspectral sensors, we’re exploring new indices that utilize hundreds of narrow spectral bands. These could provide even more detailed insights into plant physiology and stress responses.
Fusion with SAR Data
Combining optical vegetation indices with Synthetic Aperture Radar (SAR) data could allow for vegetation monitoring even in cloudy conditions, a significant limitation of current optical-only methods.
AI-Driven Index Development
Machine learning algorithms are being used to develop new, more sensitive vegetation indices tailored to specific crops or environmental conditions. We’re actively researching this area to enhance our offerings.
Integration with IoT and Ground Sensors
While our satellite-based system offers many advantages, we’re also exploring ways to integrate data from ground-based sensors and IoT devices to provide an even more comprehensive view of crop health.
3D Vegetation Indices
By incorporating LiDAR or stereo satellite imagery, we’re working on developing 3D vegetation indices that can provide insights into canopy structure and biomass distribution.
9. FAQs
Q: What is the difference between NDVI and NVI?
A: While both NDVI and NVI are vegetation indices, they use slightly different formulas. NDVI = (NIR – Red) / (NIR + Red), while NVI = NIR / (NIR + Red). NDVI values range from -1 to +1, while NVI values range from 0 to 1. NDVI is more commonly used and sensitive to a wider range of vegetation conditions, while NVI can be more effective in areas with sparse vegetation.
Q: How often should I monitor vegetation indices for my crops?
A: The optimal frequency depends on your crop type and growth stage. Generally, weekly or bi-weekly monitoring is sufficient for most crops. However, during critical growth stages or in response to extreme weather events, more frequent monitoring may be beneficial. Farmonaut’s platform provides regular updates based on satellite revisit times and cloud cover conditions.
Q: Can vegetation indices detect specific crop diseases?
A: While vegetation indices can detect general plant stress, they typically can’t identify specific diseases on their own. However, when combined with other data sources and analyzed by our AI systems, they can help narrow down potential issues. For definitive disease identification, ground-level inspection is usually necessary.
Q: How do atmospheric conditions affect vegetation index calculations?
A: Atmospheric conditions, particularly clouds and haze, can significantly affect vegetation index calculations. NDVI is relatively resistant to atmospheric effects, but can still be influenced. VARI was specifically designed to be more resistant to atmospheric effects. At Farmonaut, we use sophisticated atmospheric correction algorithms and multi-temporal analysis to minimize these impacts.
Q: Can I use vegetation indices for non-agricultural applications?
A: Absolutely! While agriculture is a primary use case, vegetation indices are also valuable for forestry, urban planning, ecological research, and disaster response. They can be used to monitor forest health, assess urban green spaces, track habitat changes, and evaluate vegetation recovery after wildfires or floods.
Conclusion
Vegetation indices like NDVI, NVI, and VARI have become indispensable tools in modern agriculture and environmental monitoring. At Farmonaut, we’re committed to harnessing the power of these indices to provide farmers, agronomists, and researchers with the insights they need to make informed decisions and optimize their operations.
By combining cutting-edge satellite technology, advanced AI algorithms, and a deep understanding of agricultural practices, we’re not just using vegetation indices – we’re pushing the boundaries of what’s possible with remote sensing in agriculture.
Ready to experience the power of vegetation indices for yourself? Try Farmonaut today:
- Download our mobile app: Android | iOS
- Explore our API offerings for developers
- Subscribe to our services:
Join us in revolutionizing agriculture through the power of vegetation indices and satellite technology. Together, we can build a more sustainable and productive future for farming worldwide.
