

Remote sensing · Explainer
Can Satellites See Through Clouds? Radar vs Optical
Radar satellites such as Sentinel-1 see through clouds, day and night; optical satellites such as Sentinel-2 and Landsat cannot. Clouds cut usable optical observations of land by about 42% (2018 study), so this guide shows what that means for your fields.
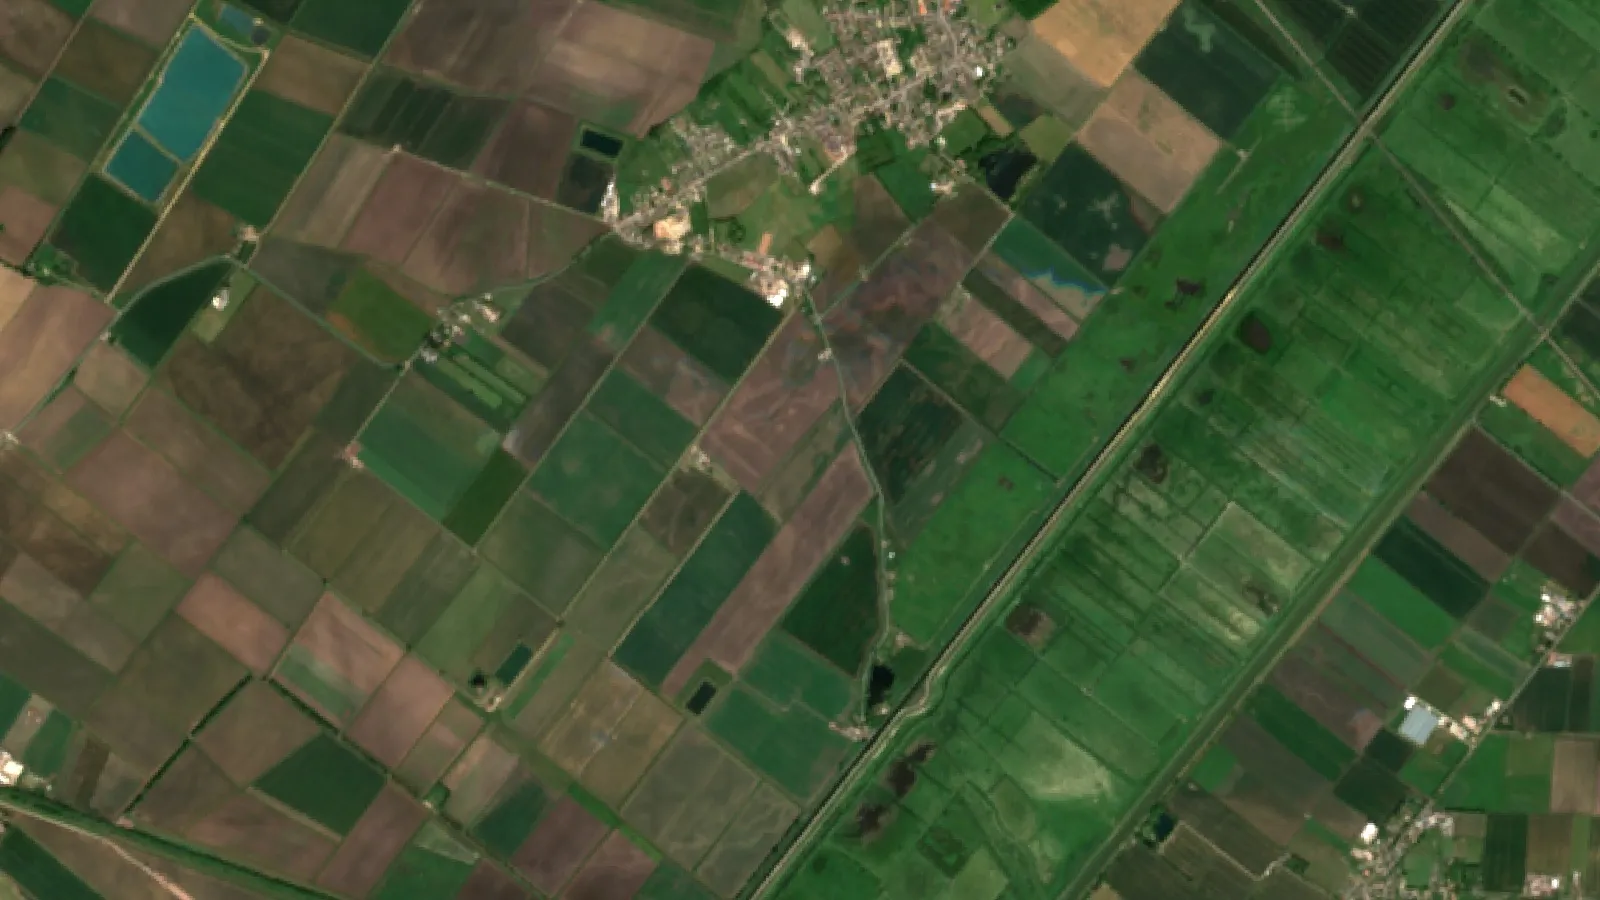
Key takeaways
- Optical satellites (Sentinel-2, Landsat) record sunlight and cannot see through clouds.
- Radar (SAR) satellites such as Sentinel-1 send their own microwave pulses and image through cloud, day and night (NASA Earthdata).
- About 67% of Earth’s surface is typically covered by cloud (NASA Earth Observatory).
- In 2018, cloud cut usable Landsat 8 and Sentinel-2 observations of land from 141.4 to 81.9 per point, a 42.1% drop (Sensors, 2020).
- Composites, extra satellites and radar fill the gaps; none makes a camera see through a cloud.
In this article
- The short answer: which satellites see through clouds
- Why clouds block optical satellites
- How radar satellites see through clouds
- Can spy satellites see through clouds?
- How often an optical satellite really sees your field
- Calculator: clear satellite views in your season
- Ways to get usable data on cloudy days
- What this means for farms and mine sites
- How to tell if a satellite image of your field is cloudy
- Satellites compared with drones and ground sensors
- What comes next for imaging through clouds
- FAQ
Can satellites see through clouds? Camera-type (optical) satellites cannot, but radar satellites can. Optical sensors such as Sentinel-2 and Landsat record sunlight bounced off the ground, and a cloud blocks that light. Radar satellites such as Sentinel-1 send out their own microwave pulses, which pass through cloud. NASA notes that radar creates imagery night or day, regardless of weather.
This matters because clouds are the normal state of the sky. NASA cites a study of nearly a decade of satellite data that estimated that about 67 percent of Earth’s surface is typically covered by clouds. Below you will find how each sensor type copes with cloud, how many clear optical views a year a field really gets, a calculator for your own season, and what farm and mining teams do when the sky stays grey.
The short answer: which satellites see through clouds
Whether a satellite can see through clouds depends on the wavelength it uses. Clouds are water droplets and ice crystals. They scatter and absorb short waves such as visible light and infrared, but they hardly affect longer microwaves.
| Sensor type | Sees through cloud? | Works at night? | Examples | Best for |
|---|---|---|---|---|
| Optical (visible, near-infrared) | No | No | Sentinel-2, Landsat 8 and 9 | Crop health maps such as NDVI, true-colour views |
| Shortwave infrared | No; copes better with haze | No | Bands on Sentinel-2 and Landsat | Moisture, minerals, burn scars |
| Thermal infrared | No | Yes | Landsat thermal bands | Surface temperature, water stress |
| Radar (SAR) | Yes | Yes | Sentinel-1, RADARSAT Constellation | Flooding, crop structure, soil moisture, ground movement |
So the honest reply to “can satellites see through clouds” is: radar ones can, camera ones cannot, and most monitoring services blend the two.
Chart
Revisit time by satellite or pair
Days between passes; optical median global revisit, radar repeat cycle
Why clouds block optical satellites
Optical satellites work like a very good digital camera. They are passive: they wait for sunlight to hit the ground and bounce back up. Sentinel-2’s Multi-Spectral Instrument, for example, records 13 spectral bands at 10 m, 20 m and 60 m resolution, and these bands are what crop health indexes such as NDVI are built from.
A cloud gets in the way in three ways:
- Blocking. A thick cloud reflects sunlight straight back to space, so the sensor records the top of the cloud, not your field.
- Haze and thin cloud. Thin cirrus or haze lets some light through but changes its colour and brightness. A crop index can then look lower or higher than the real crop.
- Shadow. A cloud next to a field casts a shadow on it. Shaded crops look darker and can be mistaken for stressed plants.
Data providers flag these pixels with cloud masks, and good software throws them out instead of mapping them. That is the right call, but it leaves gaps in the record.
How cloud cover affects satellite data quality and accuracy
Cloud cover affects satellite data quality in two ways. First, there are fewer usable images: a field may be imaged every few days but seen clearly only now and then. Second, missed clouds and shadows that slip past the mask can push numbers the wrong way. Most errors come from that second group, which is why many tools let you see the original image beside the index map.
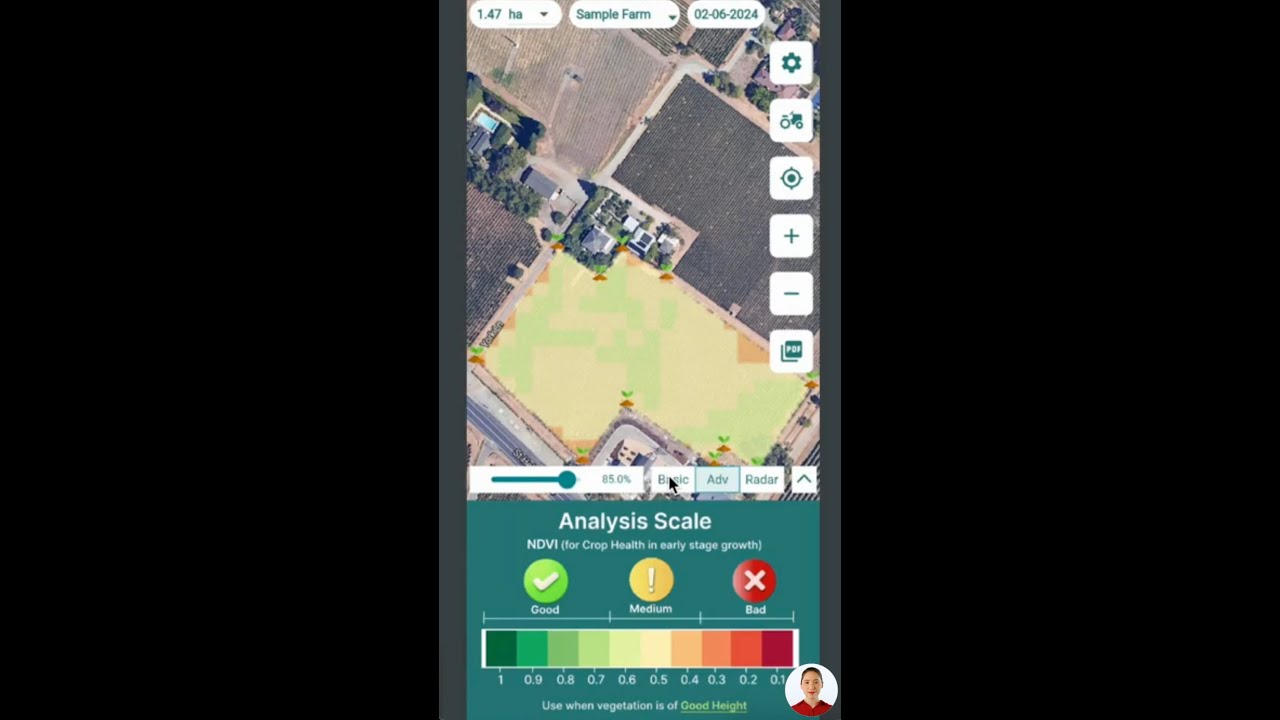
▶ How to read satellite data for agriculture in the Farmonaut mobile apps. · 4:01
How radar satellites see through clouds
Radar satellites carry Synthetic Aperture Radar, or SAR. They are active sensors: they send a microwave pulse to the ground and time the echo. Because they bring their own signal, they do not need daylight. NASA explains that SAR uses wavelengths at the centimetre to metre scale, which lets it image landforms covered with clouds or under a dense canopy of trees.
Sentinel-1 works in the C band. Its radar has a centre frequency of 5.405 GHz, a wavelength of about 5.55 cm, according to the Copernicus Sentinel-1 mission guide. That is roughly 100,000 times longer than the wavelength of visible light, so cloud droplets barely affect it.
Radar bands and what they are used for
Longer wavelengths go deeper into plants and soil. NASA’s guide notes that X band, at about 3 cm, mostly bounces off the top of a canopy, while L band, at about 23 cm, reaches large branches and trunks.
For farms, this has a practical meaning. C band responds to the leaves, stems and water in a crop, which is why it is used to track crop growth and flooding. L band reaches further into tall crops and forest, and is used for biomass and ground movement work.
What radar cannot do
- Radar does not measure plant colour, so it cannot produce a true NDVI. Its values describe structure and water, which take more skill to read.
- Radar images contain speckle, a grainy noise that needs filtering.
- Heavy rain can weaken short-wavelength radar such as X band. C band and longer bands are affected much less.
- Steep slopes cause layover and shadow, so hilly fields can look stretched.
Chart
Radar bands by maximum wavelength
Upper end of each band’s wavelength range, centimetres
Can spy satellites see through clouds?
The physics is the same for every owner. A military or commercial satellite with a camera cannot see through a cloud any better than Sentinel-2 can. A government or commercial radar satellite can image through cloud, day and night, but it still gives a radar picture, not a photograph. Higher resolution does not change this.
How often an optical satellite really sees your field
Revisit time sounds simple: Sentinel-2 is designed to pass every 5 days at the Equator, and Landsat 9 has a 16-day repeat cycle with an 8-day offset from Landsat 8. But a pass is not a clear view.
A 2020 study in the journal Sensors counted the daytime land observations of Landsat 8 and Sentinel-2A and 2B in 2018. Counting all passes, a land point was seen 141.4 times on average. Once clouds were taken into account, the number of observations fell from 141.4 to 81.9, a drop of 42.1%. The same study gave a global median revisit of 8.0 days for Landsat 8 and 9, 3.7 days for the two Sentinel-2 satellites, and 2.3 days with all four combined.
Clear views are not spread evenly either. Cloudy weeks often come together, and they often fall in the wettest part of the growing season, just when farmers want to check a crop.
What a cloudy season means for monitoring
If your area is cloudy half the time, a 5-day optical revisit gives you a clear look about every 10 days on average, and longer gaps when cloudy days come together. A 12-day radar revisit gives a reliable look on every pass. Use the calculator below to test your own numbers.
Chart
All passes vs clear passes per land point
Mean observations per land grid point, 2018
Calculator: clear satellite views in your season
Enter your season length, the satellite revisit and the share of passes you expect to be cloudy. The result shows how many usable optical images and radar images you can count on. Local cloud records from your weather service, or the cloud percentage shown on past images of your fields, give the best cloud figure.
Try the numbers for your own farm below.
Calculator
How many clear satellite views will your season get?
Enter your own season length, revisit times and cloud share.
- Optical passes in season: 24.0
- Average days between clear optical views: 8.3 days
- Radar passes (usable in any weather): 10.0
Example values only, not a forecast. Defaults: Sentinel-2 5-day design revisit and Sentinel-1 single-satellite 12-day repeat (Copernicus SentiWiki); 40% cloudy passes is an example close to the 0.41 global mean Landsat 8 cloud fraction over land in 2018 (Sensors, 2020). Assumes cloud is spread evenly across passes; real cloudy spells cluster.
Ways to get usable data on cloudy days
There is no single trick that makes clouds vanish. Teams use a mix of methods.
- Combine several optical satellites. Adding Landsat to Sentinel-2 adds passes, and each extra pass is another chance of a clear day. Best for: crop health maps in regions with broken cloud.
- Build cloud-free composites. Software takes the clearest pixel from several dates and stitches them into one image. Best for: season summaries and maps where a two- or three-week window is fine. The trade-off is that you lose the exact date.
- Add radar. Sentinel-1 or a commercial SAR source fills the gaps with all-weather data. Best for: flood checks, harvest and tillage tracking, and long cloudy spells.
- Use shortwave infrared for haze. Longer infrared bands are less affected by haze and smoke than visible bands. They do not see through real clouds.
- Gap-filling with machine learning. Models trained on past images and radar can estimate a crop index under cloud. Treat these as estimates and check them against the next clear image.
Real programmes that mix radar and optical
Canada is a good example. Since 2009, Agriculture and Agri-Food Canada has mapped crop types each year using optical images together with Radarsat-2 radar. Canada’s newer RADARSAT Constellation Mission uses three satellites to take daily scans of the country, and the Canadian Space Agency lists helping farmers among its uses.
What this means for farms and mine sites
For farms, optical images are still the main tool for crop health, because plant colour tells you most about stress. Plan for gaps: check fields after cloudy spells, look at the true-colour image before trusting a sudden drop in an index, and use radar or weather data to cover long grey periods. Our guide to crop management for sustainable agriculture covers how such checks fit into a season plan.
For mine sites, radar is often more useful than for farms. It tracks ground movement, tailings ponds and access roads in any weather, and optical images then add detail on vegetation and exposed rock when skies clear.
How Farmonaut handles cloud
The Farmonaut Satellite + AI Farm Monitoring System uses optical satellite data for crop health maps and flags cloudy images so they are not read as crop changes; radar and weather data add context between clear passes. You can try the Farmonaut app, see a sample farm advisory report, or connect your own software through the satellite and weather API documentation.
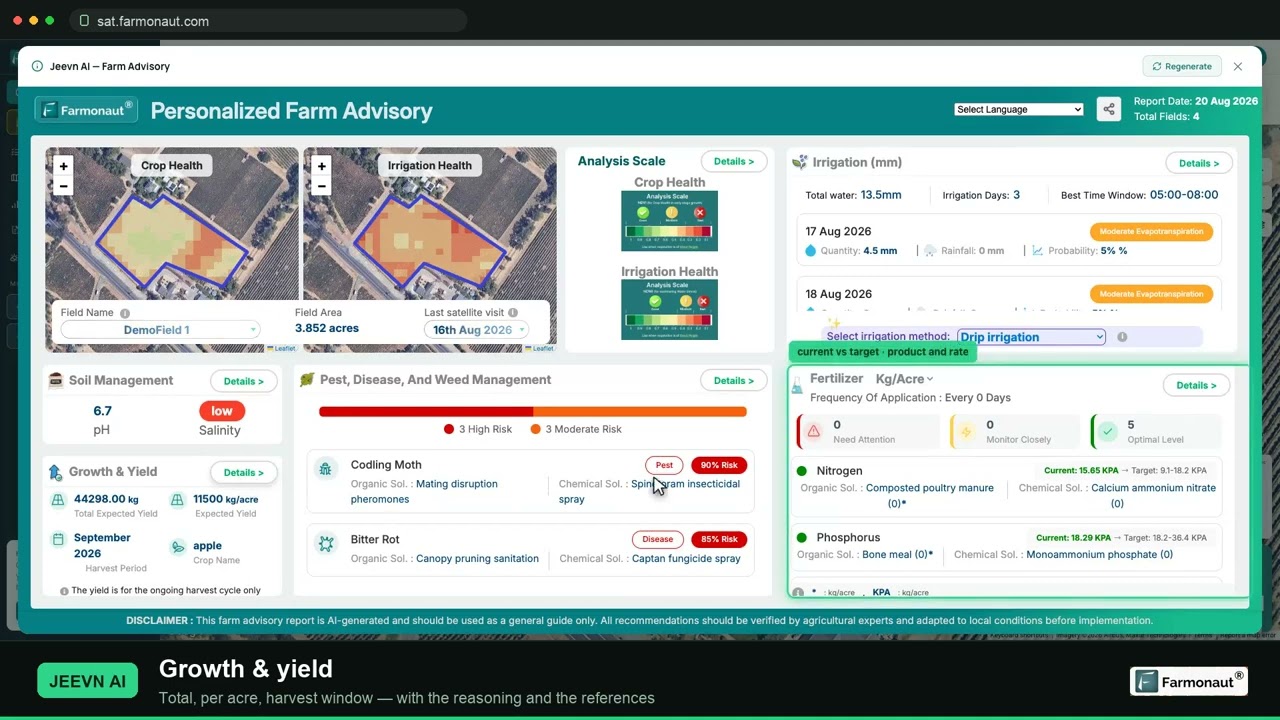
▶ A full walkthrough of satellite crop monitoring, from reading NDVI to pulling a field report. · 19:36
How to tell if a satellite image of your field is cloudy
Before you act on a sudden change in a crop map, run four quick checks.
- Look at the scene cloud percentage. Sentinel-2 and Landsat images come with a cloud figure for the whole scene. A low number for the scene does not guarantee your field was clear, but a high one is a warning.
- Open the true-colour view. White patches, a milky haze or sharp dark patches next to bright ones point to cloud and shadow.
- Compare with the image before and after. Real crop stress tends to build over days. A drop that appears on one date and disappears on the next is usually cloud.
- Check the weather record. If the local station logged overcast skies at the time of the pass, treat that image with care.
If two of these checks point to cloud, wait for the next clear image or look at radar data for the same dates.
Satellites compared with drones and ground sensors
Drones fly below the cloud, so cloud cover does not stop them, though rain and strong wind do. They give very sharp images but cover fewer acres per day and need a pilot on site. Soil and weather sensors in the field work in any weather but measure single points. Satellites cover every field at once at lower cost per acre, with the cloud limits described above.
| Method | Cloud a problem? | Coverage | Detail |
|---|---|---|---|
| Optical satellite | Yes | Whole farm or region | 10 m to 30 m (Sentinel-2, Landsat) |
| Radar satellite | No | Whole farm or region | Metres to tens of metres |
| Drone | No (flies below) | One field per flight | Centimetres |
| Ground sensors | No | Single points | Point readings |
Many farms use satellites to find the problem areas and then send a drone or a person to check them. Our page on an agriculture monitoring system goes further into these trade-offs.
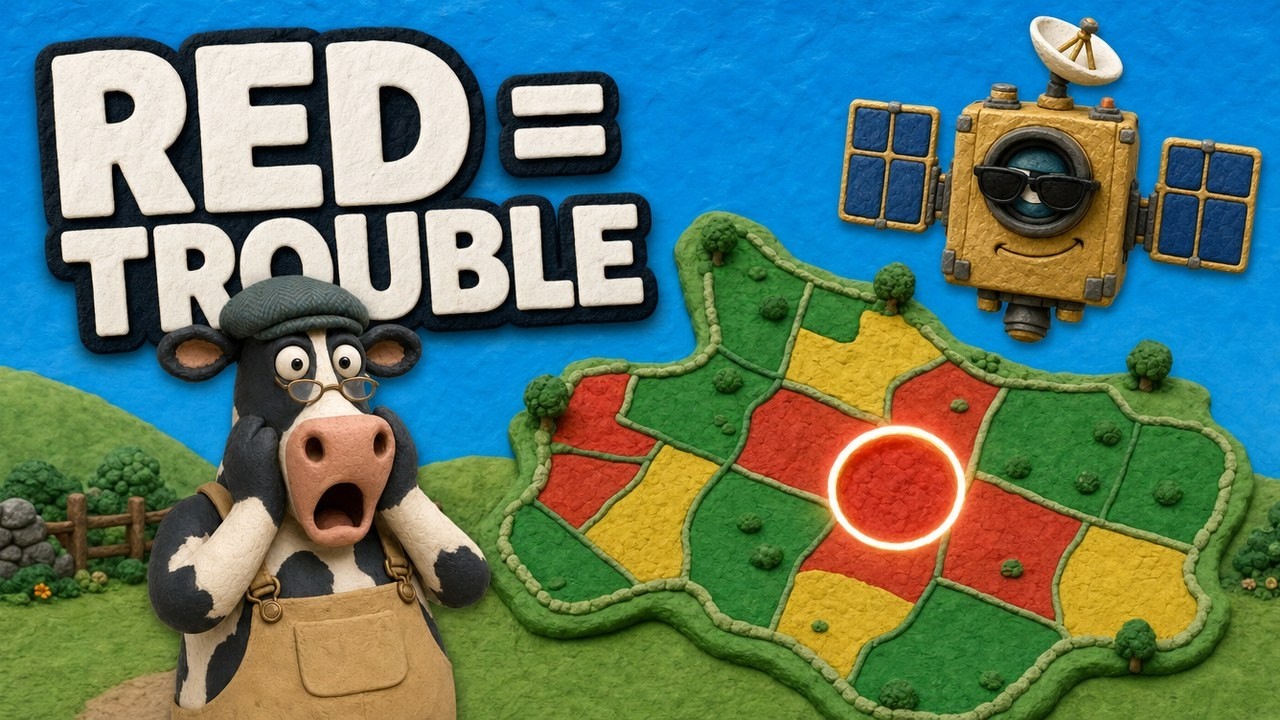
▶ A light-hearted look at how NDVI maps show crop stress before it is visible from the ground. · 4:09
What comes next for imaging through clouds
Three trends will make cloudy days less of a problem.
- More radar in orbit. The Sentinel-1 constellation is moving to the Sentinel-1C and 1D pair, and the Copernicus mission guide says a two-satellite constellation gives a six-day repeat cycle.
- Small-satellite constellations. Commercial optical and radar fleets add many more passes per day, which raises the chance of catching a gap in the clouds.
- Better fusion software. Tools that blend radar, optical and weather data into one daily estimate are improving, and some web apps already show this blend; see our overview of agriculture web applications using AI.
None of these makes an optical sensor see through a cloud. They add more chances to look, and more ways to fill the gaps.
FAQ
Can satellites see through clouds at night?
Radar satellites can. They send their own signal, so they work through cloud by day and by night. Optical satellites need sunlight and record nothing useful at night, cloud or not.
Can SAR imagery work when optical satellites are blocked by clouds?
Yes. That is the main reason SAR is used in farming and disaster work. It gives you data on crop structure, flooding and soil moisture when optical images are cloudy, though it does not replace a crop colour index such as NDVI.
Are the clouds on Google Earth accurate?
Google Earth’s base map is built mostly from many images stitched together, with clear pixels chosen where possible. The clouds you sometimes see are left over from those images, not a live weather view. For current cloud cover, use a weather satellite map.
Can infrared satellites see through clouds?
No. Near-infrared, shortwave infrared and thermal infrared are all blocked by real clouds. Shortwave infrared copes better with haze and smoke, and thermal sensors measure the temperature of the cloud top instead of the ground.
How many clear satellite images will my field get?
It depends on your local cloud cover. Worldwide, cloud cut the average number of usable Landsat 8 and Sentinel-2 observations in 2018 by about 42%, according to a study in Sensors. Use the calculator above with your own cloud figure.
Related pages on our site: satellites and drones under cloud
More from Farmonaut: agritech partnership areas (Russian)
Satellite site monitoring
Monitor your fields by satellite
See your fields in satellite crop health maps with Farmonaut.




Sources
- NASA Earth Observatory, Cloudy Earth (2015): earthobservatory.nasa.gov
- NASA Earthdata, What is Synthetic Aperture Radar?: earthdata.nasa.gov
- Copernicus SentiWiki, Sentinel-1 mission: sentiwiki.copernicus.eu
- Copernicus SentiWiki, Sentinel-2 mission: sentiwiki.copernicus.eu
- USGS, Landsat 9: usgs.gov
- Sensors (2020), Global revisit interval analysis of Landsat-8/-9 and Sentinel-2A/-2B: ncbi.nlm.nih.gov
- Agriculture and Agri-Food Canada, Annual Crop Inventory (Open Government Portal): open.canada.ca
- Canadian Space Agency, What is the RCM?: asc-csa.gc.ca
- Copernicus Data Space Ecosystem, Sentinel-1: dataspace.copernicus.eu
- USGS, What are the best Landsat spectral bands for use in my research?: usgs.gov
Discussion
Questions, corrections or field experience? Share them below. First-time comments are reviewed before they appear, and your email is never published.
No comments yet. Be the first to add a question or your experience.

 Sama Premium
 Mahaswami
 Prochecker
 Tres Valles
 LACOS Geoinformation
 Pulsar Supernova
 Magrifly
 LatConnect 60
 WebsEdge
 Blickwinkel
 Agricultural Credit Policy Council
 MCSOD
 Marei Nursery
 eKGIS
 Mostas Tech
 Andex
 FCF India
 Unifrutti Gulf
 Deluxe Conseil

 Licence holder · Niger · Gold
 Licence holder · Nigeria · Gold + lithium
 Client · Tanzania · Gold
 Client · Somalia · Gold
 Client & affiliate partner · Ghana · Gold










