
Vegetation Indices: 7 Secrets for Massive Farm Yields
Table of Contents
- Introduction: The Power of Vegetation Indices
- What Are Vegetation Indices?
- Trivia
- Comparison Table of Key Vegetation Indices
- Secret 1: Normalized Difference Vegetation Index (NDVI)
- Secret 2: Enhanced Vegetation Index (EVI)
- Secret 3: Soil Adjusted Vegetation Index (SAVI)
- Secret 4: Modified Soil Adjusted Vegetation Index (MSAVI)
- Secret 5: Normalized Difference Red Edge (NDRE)
- Secret 6: Visible Atmospherically Resistant Index (VARI)
- Secret 7: Triangular Greenness Index (TGI) & Leaf Chlorophyll Index (LCI)
- Trivia
- Applications: Crop, Forest, & Land Management
- Farmonaut: Democratizing Vegetation Monitoring
- Conclusion: Vegetation Indices & the Future of Farming
- FAQ: Vegetation Indices, Crop Health, & Sustainable Agriculture
Introduction: The Power of Vegetation Indices for Modern Agriculture
In today’s age of technology and innovation, the agriculture and forestry sectors are rapidly adopting advanced remote sensing technologies to enhance productivity, ensure sustainable land management, and safeguard both crops and ecosystems. The heart of this transformation lies in the use of vegetation indices—powerful mathematical formulations that interpret spectral measurements from satellites and other sensors.
By utilizing indices such as NDVI, EVI, SAVI, MSAVI, NDRE, VARI, TGI, and LCI, we can gain invaluable insights into crop health, soil conditions, forest vigor, chlorophyll content, and more. These precision farming tools are transforming how we monitor, assess, and manage large areas of land efficiently on a global scale.
In this comprehensive guide, we’ll explore the 7 secrets for massive farm yields revealed by the most influential vegetation indices. We’ll examine how each index works, their advantages and limitations, and why they are essential for crop health monitoring, forest health assessment, and sustainable land management—driving the next era of data-driven, eco-friendly agriculture.


What Are Vegetation Indices? (And Why Do They Matter in Agriculture and Forestry)
Vegetation indices are mathematical formulations derived from spectral reflectance measurements gathered by remote sensing technologies such as satellites, drones, or handheld tools. They utilize differences in how vegetation reflects light across various wavelengths—particularly in the red, near-infrared (NIR), green, blue, and red-edge spectral bands—to assess vital plant and soil properties.
By utilizing indices such as NDVI in agriculture, we can determine:
- Crop health and vigor: Identify regions with healthy, stressed, or diseased crops using visible and NIR bands.
- Biomass and density: Evaluate vegetation density and estimate biomass production.
- Soil moisture and exposure: Detect soil influence on plant reflectance, crucial for sparse or arid regions.
- Chlorophyll content analysis: Assess photosynthetic activity and nitrogen status using red-edge and visible bands.
- Forest health assessment: Monitor forest cover, drought stress, and regrowth after events like fires or logging.
- Management decisions: Guide irrigation scheduling, fertilizer application, pest/weed monitoring, selective harvesting, and sustainable management practices.
These indices have seen widespread adoption in both precision farming and forestry, powering tools and platforms like Farmonaut—which democratize access to real-time crop monitoring, AI-based advisory, and resource optimization for farmers, agribusinesses, and government agencies.
“NDVI can detect crop stress up to 10 days before visible symptoms appear, revolutionizing early intervention in agriculture.”
Comparison Table of Key Vegetation Indices in Agriculture & Forestry
| Index Name | Formula | Purpose/Application | Advantages | Limitations | Ideal Value Range |
|---|---|---|---|---|---|
| NDVI (Normalized Difference Vegetation Index) | (NIR – Red) / (NIR + Red) | Monitor crop/forest health, assess biomass, detect stressed areas | Widely used, simple, effective for most crops | Saturates in dense vegetation, affected by soil/atmospheric effects | -1 (bare soil) to +1 (healthy, dense vegetation), >0.5 = robust growth |
| EVI (Enhanced Vegetation Index) | G × ((NIR – Red) / (NIR + C1 × Red – C2 × Blue + L)) | Improved accuracy in dense canopies, minimizes soil/atmospheric influences | Better in dense forests/rainforests | More complex, needs blue band | Typically 0–1, higher = more chlorophyll/biomass |
| SAVI (Soil Adjusted Vegetation Index) | ((NIR – Red) / (NIR + Red + L)) × (1 + L) | Areas with sparse vegetation/soil exposure, arid regions | Reduces soil brightness impact, good for early stages/regions with visible soil | Requires setting L factor, less effective with dense cover | 0 (soil) to 1 (dense canopy), 0.3-0.5 = healthy crops |
| MSAVI (Modified Soil Adjusted Vegetation Index) | (2*NIR + 1 – sqrt((2*NIR+1)2 – 8*(NIR–Red))) / 2 | Early crop growth/arid regions with high soil exposure | Further minimizes soil impacts, auto-adjusted | Complexity, limited interpretability vs NDVI | 0 (soil) to 1 (healthy crops), >0.5 = optimal |
| NDRE (Normalized Difference Red Edge) | (NIR – Red Edge) / (NIR + Red Edge) | Chlorophyll/nitrogen status, late growth, precision agriculture | More sensitive at high canopy, great for nitrogen management | Requires red-edge band, rare on older sensors | Typically 0.2–0.6; higher = more active vegetation |
| VARI (Visible Atmospherically Resistant Index) | (Green – Red) / (Green + Red – Blue) | Vegetation fraction, crop maturity/senescence in hazy/cloudy areas | Can use only visible bands, atmospheric resistance | Less sensitive than NIR-based indices | Values between 0–1; 0.2–0.5 for healthy cover |
| TGI (Triangular Greenness Index) | Complex function of RGB; proxies for chlorophyll | Chlorophyll content in leafy, dense regions using RGB sensors | Works with standard RGB imagery | Less accurate than NIR/red-edge methods | Higher = more chlorophyll, optimal as per crop |
| LCI (Leaf Chlorophyll Index) | RGB-based formulation | Chlorophyll assessment under full canopy | Works with RGB imaging, good proxy for strong cover | Only for dense, uniform coverage | Higher values = healthy, dense leaves |


Secret 1: Normalized Difference Vegetation Index (NDVI) – The Global Standard
The Formula for Agricultural Insight
The Normalized Difference Vegetation Index (NDVI) is arguably the most recognized and universally applied vegetation index in agriculture, forestry, and environmental sciences. Its formula:
NDVI = (NIR – Red) / (NIR + Red)
Here, NIR (near-infrared) and Red refer to the amount of sunlight reflected in these spectral bands. Healthy green foliage reflects significantly more in the NIR and absorbs more in the red, resulting in higher NDVI values.
NDVI in Agriculture: Monitoring and Yield Optimization
- NDVI values range from -1 to +1: Negative/zero values indicate water, snow, or bare soil, while higher positive values (>0.4) signal dense, healthy vegetation.
- It is widely employed to monitor crop health, assess biomass production, and detect areas requiring attention before issues become visible.
- NDVI helps quantify forest cover and leaf area index in forestry, contributing to carbon and biodiversity assessments.
- By identifying spatial variability at large scales, NDVI underpins precision farming tools for site-specific management.
Why NDVI? We rely on NDVI because of its simplicity, effectiveness, and adaptability across diverse crops, ecosystems, and remote sensing for agriculture. It is foundational in crop health monitoring and sustainable land management.
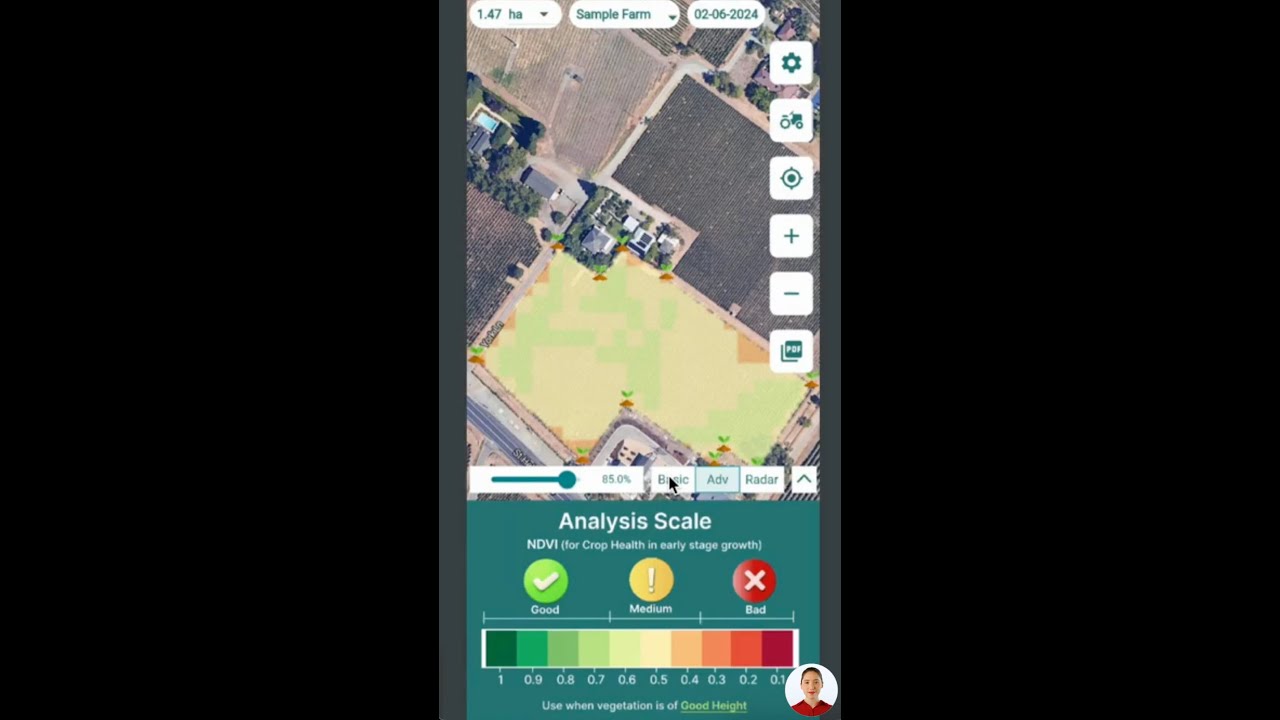
NDVI Use on Farmonaut
On Farmonaut’s precision agriculture platform, NDVI data is updated regularly—delivered via web/mobile apps and API—enabling farmers and agribusinesses to spot anomalies, take rapid action, and ensure massive yields with sustainable inputs.
Access Farmonaut NDVI API for vegetation health analysis here.
Check API documentation for integration details.
Secret 2: Enhanced Vegetation Index (EVI) – Advancing Beyond NDVI
The Enhanced Vegetation Index (EVI) is engineered to overcome some of NDVI’s major limitations—particularly soil background influences, atmospheric interference, and index saturation in dense forests or plantations.
Its formula incorporates additional coefficients for superior correction:
EVI = G × ((NIR – Red) / (NIR + C1 × Red – C2 × Blue + L))
- Where: G=gain factor, C1 and C2=coefficients for atmospheric conditions, L=canopy background adjustment, Blue=blue band reflectance.
- EVI is especially useful for monitoring matured, dense canopy vegetation, such as rainforests, sugarcane fields, or plantations where NDVI may saturate and lose sensitivity.
- By minimizing atmospheric effects and background “noise”, EVI provides more robust readings under variable conditions.
Application: When managing regions with dense leaf cover or significant atmospheric scattering (such as equatorial or humid climates), EVI becomes a powerful tool for capturing true biomass variations—vital in both sustainable forestry and high-output agriculture.
Secret 3: Soil Adjusted Vegetation Index (SAVI) – Taming the Soil Factor
While NDVI performs well in dense crops, it can be biased by soil brightness and sparse vegetation. That’s where the Soil Adjusted Vegetation Index (SAVI) comes into play:
SAVI = ((NIR – Red) / (NIR + Red + L)) × (1 + L)
- The L factor (soil brightness) is typically set to 0.5 for general conditions but may be adjusted based on soil reflectance.
- SAVI is tailored for arid regions, early crop stages, or any area where exposed, bright soil could distort typical NDVI readings.
- It is highly beneficial for crops during early growth stages, reforestation plots, or degraded lands undergoing restoration.
SAVI enables us to assess vegetation health where soil exposure is significant—improving anomaly detection, guiding replanting, and optimizing early-stage input allocation.
Secret 4: Modified Soil Adjusted Vegetation Index (MSAVI) – Precision in Sparse, Degraded Areas
For maximum precision in environments dominated by sparse vegetation and high soil exposure (including semi-arid regions and degraded lands), we turn to the Modified Soil Adjusted Vegetation Index (MSAVI). Its enhanced algorithm further adjusts soil brightness effects and thereby yields cleaner, more accurate vegetation insights:
MSAVI = (2 × NIR + 1 – sqrt((2 × NIR + 1)2 – 8 × (NIR – Red))) / 2
- Best for arid or semi-arid conditions, fallow lands, early planting phases, or any region where soil reflectance overshadows crop presence.
- Ideal for tracking rehabilitation efforts, dryland farming, and ecological restoration.
- MSAVI’s algorithm “self-adjusts” to soil background, removing the need for manual L setting as in SAVI.
At Farmonaut, MSAVI is used for fine-tuned land analysis—particularly valuable for monitoring crop emergence, guiding sustainable reforestation, and quantifying growth on marginal lands.
Secret 5: Normalized Difference Red Edge (NDRE) – Chlorophyll & Nitrogen Monitoring
Driven by continuous innovation, Normalized Difference Red Edge (NDRE) leverages the spectral sensitivity of the “red-edge” band (between red and NIR), making it superior for detecting chlorophyll content and nitrogen status during crop growth.
NDRE = (NIR – Red Edge) / (NIR + Red Edge)
- Red-edge region is highly sensitive to changes in chlorophyll
- NDRE identifies chlorophyll shortage, nitrogen deficiency, and oncoming crop maturity even when NDVI saturates at full canopy.
- It is a valuable index in precision farming for variable-rate nitrogen application and for optimizing input use based on actual plant demand.
Not all satellite sensors capture the red-edge region, but advanced platforms such as Farmonaut utilize available spectral bands to drive actionable nitrogen management.
Secret 6: Visible Atmospherically Resistant Index (VARI) – All-Weather Health Assessment
VARI was developed to be less sensitive to atmospheric effects such as haze, dust, or cloudiness, and uniquely, it can be calculated using only visible light bands (green, red, blue):
VARI = (Green – Red) / (Green + Red – Blue)
- VARI is essential for estimating vegetation fraction, tracking crop senescence and maturity when cloud cover obscures NIR readings.
- It helps farmers and agronomists detect late-stage crop decline, uniformly assess field conditions, and adapt management under less-than-ideal observation situations.
By enabling monitoring under cloudy or hazy conditions, VARI ensures continuity in crop health assessments—a centerpiece of Farmonaut’s real-time monitoring solutions.
Secret 7: Triangular Greenness Index (TGI) & Leaf Chlorophyll Index (LCI)
RGB Vegetation Indices for Quick, High-Leaf Cover Analysis
Sometimes, satellite or drone sensors may capture only RGB bands (red, green, blue). In those cases, Triangular Greenness Index (TGI) and Leaf Chlorophyll Index (LCI) provide a practical solution for chlorophyll content analysis—especially in areas of complete, dense leaf cover.
- TGI: Uses a mathematical combination of red, green, and blue reflectance values to estimate greenness. Higher values indicate more chlorophyll and healthier foliage, useful in high-leaf biomass crops or plantations.
- LCI: Focused on RGB assessment in areas with full canopy, providing a reliable proxy for total leaf chlorophyll content.
While not as precise as NIR-based indices, TGI and LCI are fast, accessible tools for daily crop monitoring, biomass mapping, and site-specific management—furthering sustainability and yield optimization in precision farming systems.
“Over 80% of precision agriculture systems use vegetation indices like NDVI for real-time crop health monitoring.”
Applications: Crop, Forest, and Sustainable Land Management
Precision Farming Tools and Remote Sensing for Agriculture
-
Crop Health Monitoring:
By analyzing time-series dynamics of NDVI, EVI, SAVI, and VARI, we can rapidly pinpoint stressed, diseased, or water-deficient parts of a field—enabling early intervention and resource optimization. -
Assessing Vegetation Health & Growth Stages:
NDRE and TGI are vital for tracking changes in chlorophyll content across growth stages—informing nutrient management and supporting variable-rate fertilizer application. - Forest Health Assessment: In forestry, NDVI, EVI, and MSAVI help quantify reforestation success, fire damage recovery, and monitor drought impact—guiding sustainable logging and biodiversity protection.
- Evaluating Covered vs. Bare Areas: SAVI and VARI make it possible to distinguish bare soil, sparse cover, or degraded lands from dense crop regions.
- Yield Estimation and Harvest Timing: Vegetation indices correlate strongly with biomass and yield, helping farmers schedule harvests for maximum profitability.
- Irrigation and Fertilizer Optimization: Remote tracking of spatial variability enables irrigation adjustments and targeted nutrient delivery—preserving water and reducing environmental impact.
- Traceability and Sustainability: Documented index trends support blockchain-based product traceability solutions by Farmonaut.
- Access to Crop Financing and Insurance: Satellite-based index monitoring allows verification for crop loans and insurance, minimizing fraud and streamlining claims.
- Fleet and Large-Scale Farm Management: Large holdings benefit from Fleet & Resource Management Tools and Agro-Admin Large-Scale Management Apps, powered by vegetation indices for efficient logistics, reporting, and yield mapping.
- Carbon Footprinting in Agriculture & Forestry: Track emissions and sustainability metrics using Farmonaut’s Carbon Footprinting Services built on vegetation data.
Farmonaut: Democratizing Vegetation Monitoring with Satellite, AI & Blockchain
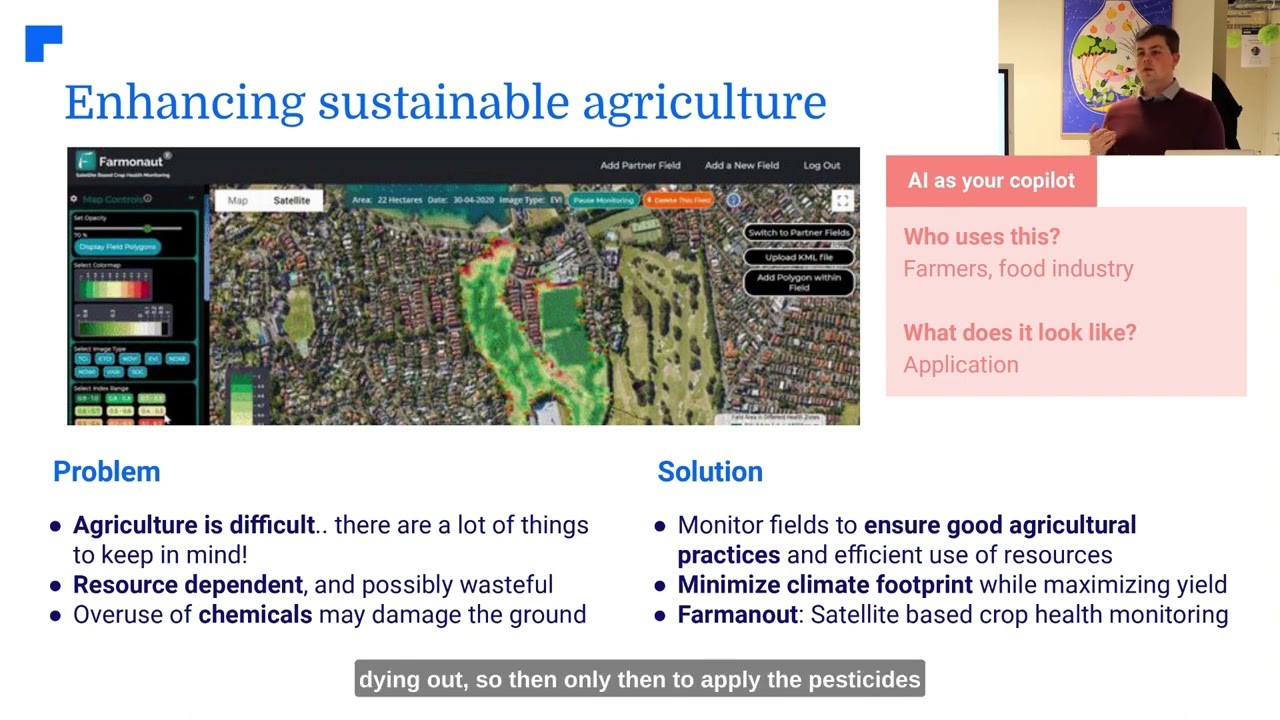
As a pioneering agricultural technology company, Farmonaut is at the forefront of making precision agriculture affordable and accessible worldwide. By integrating satellite-based crop health monitoring, AI-powered advisory, and blockchain traceability into everyday farming and forestry operations, Farmonaut bridges the gap between advanced science and practical, scalable field management.
- Satellite-based Crop Monitoring: Multispectral imagery (including NDVI, EVI, SAVI, VARI, and more) fuels near real-time insights for crop and forest management, reducing risk and boosting sustainability.
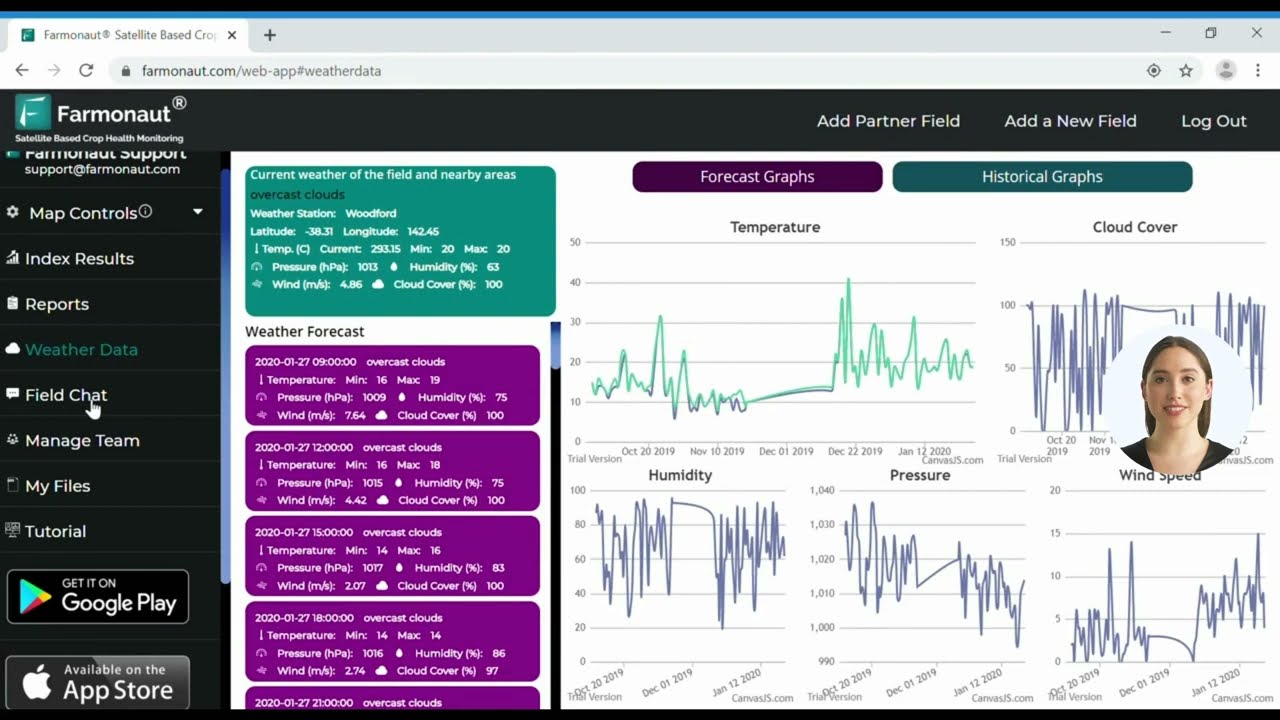
- AI & Machine Learning Advisory: The Jeevn AI system delivers personalized recommendations on irrigation, fertilization, pest/weed control, and harvest timing based on evolving vegetation index data and weather trends.
- Blockchain-Enabled Traceability: Each stage—from planting to storage/shipping—is tracked using secured, verifiable data for transparency and consumer trust.
- Fleet, Resource & Carbon Footprint Management: Agribusinesses streamline logistics, optimize fleet/machinery usage, and quantify emissions using practical remote sensing for agriculture & forest operations.
Ready to experience the future of farming? Try Farmonaut for yourself:
Farmonaut offers a flexible, subscription-based model—scaling from individual growers to government agencies and large conglomerates. Access the Farmonaut API for custom development or research at
https://sat.farmonaut.com/api, and see
Developer Docs for easy integration.
Conclusion: Vegetation Indices & the Future of Massive Farm Yields
Vegetation indices, ranging from classic NDVI to advanced indices like NDRE, SAVI, VARI, TGI, and MSAVI, are now indispensable tools for modern agriculture and forestry. Fueled by remote sensing technologies, AI, and blockchain-driven traceability, these indices transform how we assess vegetation health, manage land, optimize inputs, and strengthen food security.
Farmonaut is helping us harness these tools by making precision technologies affordable, actionable, and accessible to farmers, agribusinesses, and organizations worldwide. Together, we’re building a sustainable, data-driven agricultural ecosystem where massive yields, environmental stewardship, and transparency go hand in hand.
Explore the future of crop health monitoring, sustainable land management, and forest health assessment on Farmonaut now!
FAQ: Vegetation Indices, Crop Health, & Sustainable Agriculture
Q1: Which vegetation index is best for early crop growth stages?
A: SAVI and MSAVI are ideally suited for early stages where soil exposure is prominent. They adjust for soil brightness, providing clearer insight when crops are just emerging.
Q2: How do vegetation indices assist in sustainable land management?
A: By revealing spatial deviations in crop health, biomass, and soil cover, indices guide targeted interventions, optimize input use, and minimize resource wastage—crucial for sustainability and conservation.
Q3: Can NDVI and VARI be used together for comprehensive crop assessment?
A: Yes! NDVI gives robust health estimates under clear sky, while VARI ensures monitoring even in cloudy/hazy conditions using only visible light bands.
Q4: What is the main use of NDRE in precision farming?
A: NDRE is superb for chlorophyll content analysis and nitrogen management—helping optimize fertilizer application, especially at maturity or in dense canopies.
Q5: Are Farmonaut’s solutions scalable for small and large farms?
A: Absolutely. Farmonaut is designed to serve individual growers, cooperatives, and large agribusinesses thanks to its scalable subscription and API-based model. Access real-time vegetation index analytics via web, Android, or iOS app. See the Carbon Footprinting and Large-Scale Farm Management pages for specialized services.
Q6: Can I integrate Farmonaut’s data into my own platform?
A: Yes, the Farmonaut API allows seamless integration with your existing business or research systems.
Q7: Does Farmonaut sell or manufacture farm inputs or machinery?
A: No, Farmonaut is not a manufacturer or an online marketplace for farm inputs or machinery. It is a technology platform for remote crop monitoring, advisory, and resource management.


