

Reviewed August 2026 against USDA’s Economic Research Service, DTN Progressive Farmer, and the Farm Bureau/MorganMyers farmer-AI survey.
Try it: Enter your numbers above to see an estimate. →
Artificial intelligence in agriculture is software that turns field data into one specific action: spray this row, irrigate that zone, harvest by this date. In the United States it already runs on GPS-guided tractors, camera-equipped sprayers that identify individual weeds, satellite-derived vegetation maps, and general chat tools farmers use to plan a season. The sections below give the actual US adoption numbers behind each of those, sourced and dated, plus how to check for a newer figure than the one printed here.
How Many US Farmers Actually Use AI in Agriculture
Two different surveys answer this, and they measure two different things. USDA’s Economic Research Service (ERS) tracks hardware-based precision-agriculture technology through its Agricultural Resource Management Survey (ARMS). Using 2023 crop-year data published in “America’s Farms and Ranches at a Glance” in December 2024, guidance autosteer systems — the GPS units that keep a tractor or combine on line without a driver correcting the wheel — were running on 52% of midsize farms and 70% of large-scale crop-producing farms. Decision-support tools such as yield monitors, yield maps, and soil maps showed a wider gap: 68% of large-scale crop farms used them versus 13% of small farms (those under $350,000 in gross cash farm income). See the USDA ERS chart for the full farm-size breakdown, which ERS updates as new ARMS rounds are released.
A separate 2026 survey from MorganMyers, covered by AgWired, measured a different layer entirely: general-purpose AI chat tools. It found 75% of US farmers and ranchers had used a tool such as ChatGPT or Gemini to support their operation, and 48% of that group used it weekly or more. Of the farmers who had tried it, 83% said it delivered value for their operation — but 63% of farm retailers, who advise growers on inputs, still called AI “promising but unproven.” Adoption skewed toward dairy producers, farmers under 35, and larger operations, and away from smaller farms, growers 51 and older, and row-crop producers.
Read together, the two data sets say something an AI Overview summary won’t: the tool people mean by “AI in agriculture” is a different thing entirely depending on the operation. A row-crop farm running a GPS autosteer system and a dairy operation asking Gemini to draft a ration plan are both, technically, using AI in agriculture — and the adoption curve looks completely different for each.
Applications of AI in Agriculture: What It Does on a Working Farm
Strip away the marketing, and the application of AI in agriculture in the US sorts into five categories most farms are already touching in some form:
- Crop yield prediction — modeling expected bushels or tons per acre from satellite, weather, and historical yield data ahead of harvest.
- Pest and disease detection — image models trained to spot weed species, insect damage, or fungal disease from a camera or drone feed.
- AI-targeted spraying — boom cameras that identify and spray individual weeds instead of blanketing a field.
- Satellite-based crop health monitoring — NDVI and soil-moisture layers derived from Landsat and Sentinel-2 passes.
- Advisory chat and decision-support systems — natural-language tools combining weather, soil, and market data into a specific recommendation.
AI-Targeted Spraying: The Clearest US Numbers Available
The most fully documented example is John Deere’s See & Spray, useful precisely because Deere publishes season-end figures. Across the 2025 growing season, customers ran its boom-mounted cameras — which scan more than 2,500 square feet per second and trigger individual nozzles only over a detected weed — across more than 5 million acres of US farmland, per DTN Progressive Farmer’s reporting. Average non-residual herbicide use fell by nearly 50% on those acres, for a season total of about 31 million gallons of herbicide mix saved — about 6.2 gallons per acre.
Deere’s 2025 Application Savings Guarantee priced the technology at $1 per fallow acre and $5 per in-crop acre. Separate seven-state field trials run during the same season measured an average yield gain of 2 bushels per acre from targeted spraying versus broadcast spraying, with the best-performing fields reaching 4.8 bushels per acre.
Satellite Monitoring and What “AI in Agriculture” Images Actually Show
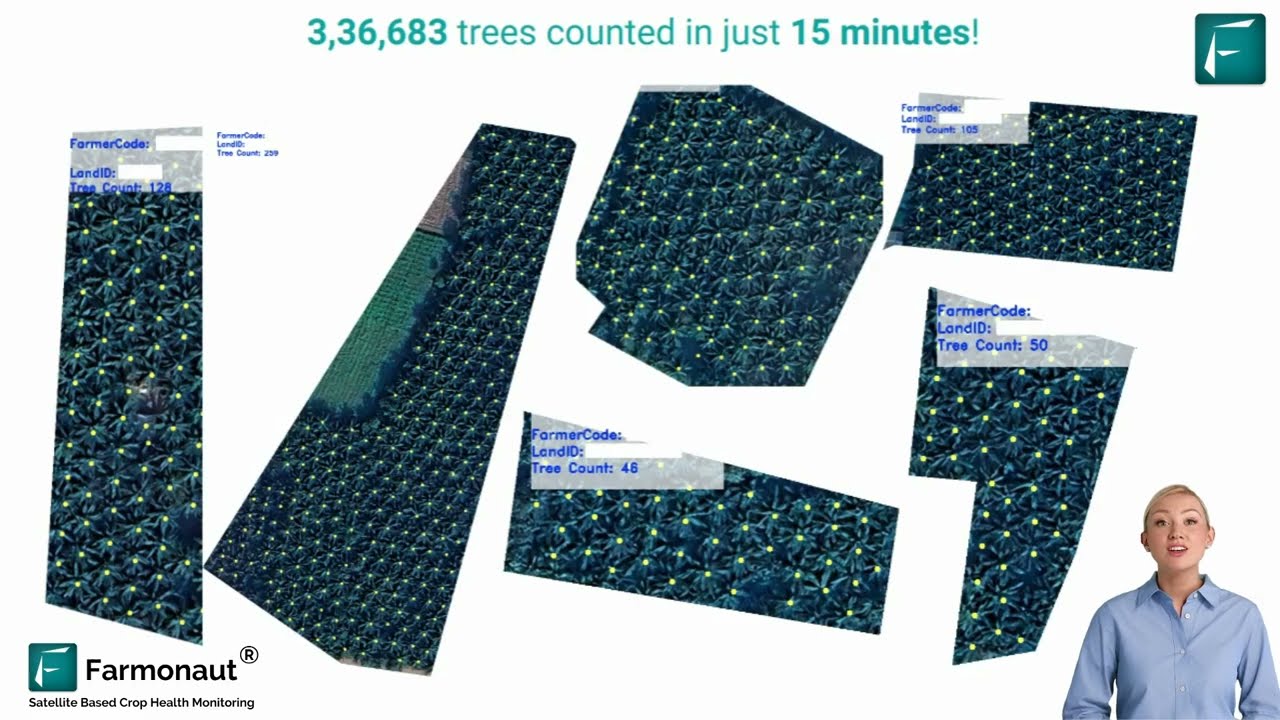
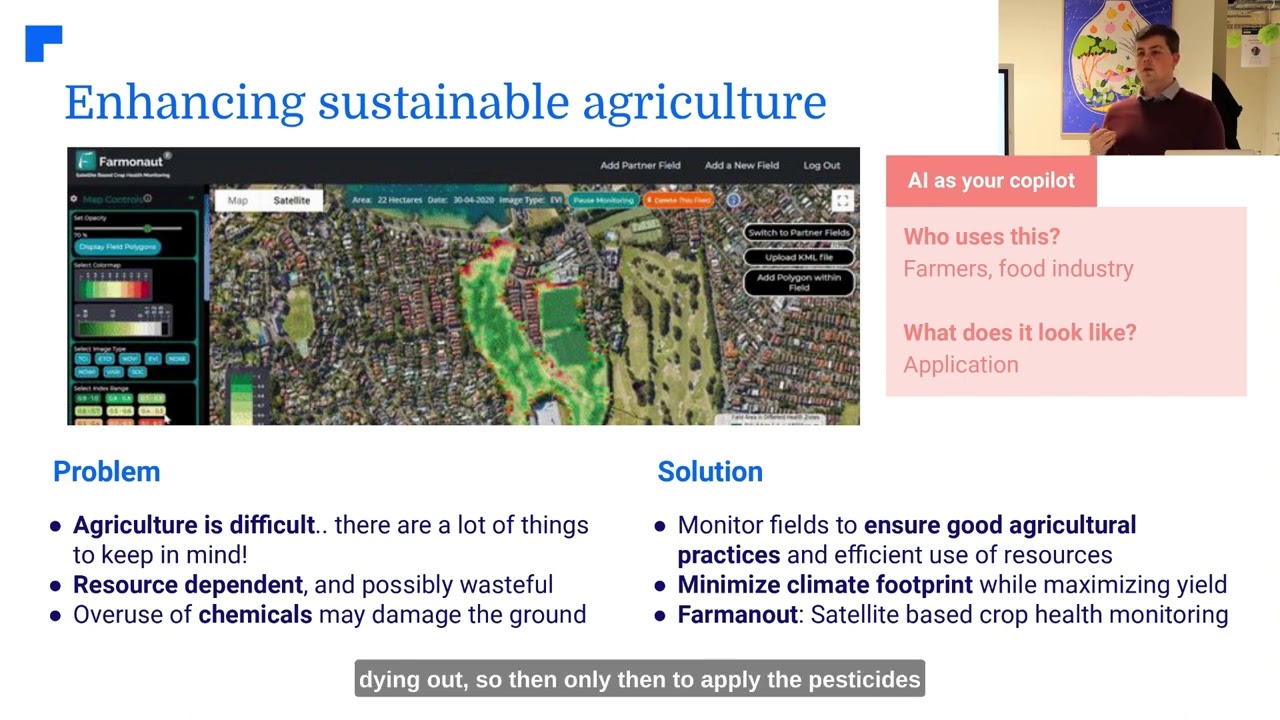
Searches for images of AI in agriculture often expect humanoid robots in a field. The real picture is less dramatic and more useful: a colour-coded NDVI map, a soil-moisture overlay, or a dashboard flagging one irrigation zone in red. USDA’s National Agricultural Statistics Service (NASS) builds that imagery nationally through its Cropland Data Layer, combining Landsat 8/9 and Sentinel-2A/2B passes into 10-day NDVI composites. The Cropland Data Layer moved from 30-meter to 10-meter resolution starting with the 2024 layer, and the edition covering the 2025 season was released February 27, 2026, per NASS’s own documentation. Farmonaut’s satellite crop-health monitoring works on the same principle at the field level: multispectral imagery converted into NDVI, soil-moisture, and stress layers a grower can act on directly rather than just look at.

Comparing the Main AI and Precision-Ag Categories
| Technology | What it does | Adoption, large-scale US crop farms | Adoption, small farms | Source & year |
|---|---|---|---|---|
| Guidance autosteer | GPS keeps machinery on line without driver correction | 70% | Not broken out separately in ERS’s public release | USDA ERS, ARMS 2023 data (published Dec. 2024) |
| Yield/soil mapping (decision-support) | Yield monitors, yield maps, soil maps inform later decisions | 68% | 13% | USDA ERS, ARMS 2023 data |
| General AI chat tools | ChatGPT/Gemini-style tools for planning, research, ration or crop decisions | 75% of all US farmers/ranchers have used one; farm-size split not published | MorganMyers/Farm Bureau survey, reported June 2026 | |
| AI-targeted spraying | Camera-guided sprayers detect and treat individual weeds | 5M+ acres nationally in the 2025 season (tracked by acreage, not farm-size tier) | John Deere 2025 season data, via DTN Progressive Farmer | |
AI Farming Technology Beyond the Sprayer: Autonomous Machinery and Market Growth
Autosteer and targeted spraying have hard adoption numbers behind them, but they sit inside a faster-growing category: fully autonomous farming equipment that removes the driver from routine passes such as tillage and grain-cart transfer. Market researchers track this whole bundle — guidance, imaging, sensors, and autonomy software — as “precision agriculture.” Fortune Business Insights values the global precision-agriculture market at $12.86 billion in 2025, projected to reach $22.74 billion by 2034 at a 6.60% compound annual growth rate, with North America holding 36.63% of the 2025 market. Fortune Business Insights’ report breaks that down further by hardware, software, and region.
Farmonaut’s AI Tools for US Farm Operations
Farmonaut packages several of the categories above into one subscription, aimed at making tools that used to require an agribusiness-scale budget available to a single operation. The core pieces are satellite-based crop health monitoring, the Jeevn AI advisory system, blockchain-based traceability records, and fleet and resource-management tools for irrigation and fertilizer scheduling.
Explore Farmonaut’s solutions:



Jeevn AI: Advisory Without Waiting for a Consultant
The Jeevn AI Advisory System is Farmonaut’s decision-support layer: it combines field-level weather forecasts, soil data, and crop stage to generate a specific recommendation rather than a general one, and updates it as conditions change through the season. It’s the closest analogue in Farmonaut’s product line to the general chat-based AI tools the MorganMyers survey measured above, tuned to a field’s own data rather than open-ended questions.

Blockchain Traceability and Resource Management
AI-driven advisory only helps if the underlying supply-chain record is trustworthy, so Farmonaut logs key field and handling events on a blockchain ledger, giving buyers a tamper-resistant record of what happened to a crop between field and shipment. The same platform tracks irrigation, fertilizer application, and machinery use so a grower can see input costs and an estimated carbon footprint alongside the agronomic data.

Crop-Specific and Regional Considerations
None of the adoption figures above are uniform across crops. Row-crop growers — corn, soybeans, wheat — are the group MorganMyers found adopting general AI tools most slowly, even though they’re also the group with the most mature autosteer and yield-mapping infrastructure in ERS’s ARMS data. Crops with tighter agronomic windows, such as rice, put more weight on timing than on any single tool; see our separate breakdown of rice farming’s specific innovations and challenges for how AI-driven water and nitrogen management applies there. The autonomous-machinery trend above also rolls out unevenly by region: large, rectangular Midwest fields suit autosteer and autonomous tillage far better than smaller or irregular parcels, which is part of why ERS keeps finding that adoption tracks farm size and geography together, not technology alone.
Estimate Your Own AI-Targeted Spraying Savings
Deere’s 2025 season data above gives three real inputs — acres, herbicide cost, and reduction rate — but your own operation’s numbers will differ from the national average. Enter your figures below to estimate what AI-targeted spraying could be worth on your acres.
Enter your numbers above to see an estimate.
Assumes the herbicide-use reduction and technology fee are flat per acre. It excludes equipment purchase or lease cost, weed-pressure differences by field, and fuel savings from fewer spray passes. The 50% and $3 defaults sit inside Deere’s published 2025 season-average figures cited above; replace them with your own agronomist’s estimate for your fields.
The Real Challenges in Agricultural AI and Big Data
The gap between the MorganMyers adoption numbers and the ERS hardware numbers points to the actual obstacle: trust and integration, not access. 63% of farm retailers calling AI “promising but unproven” is a bigger constraint on adoption than price for most midsize operations, because it means a recommendation still has to be checked by a person before it’s acted on. Practical challenges layer on top of that: data standardization across equipment brands, privacy over whose field data feeds whose model, and the well-documented rural broadband gaps that make cloud-based tools unreliable on the acres that need them most.

How to Check Fresher Numbers Than This Page
Every figure above has a publication cycle, and checking it takes under five minutes:
- USDA ERS adoption rates — ARMS survey results feed into ERS’s “Charts of Note” and the periodic “America’s Farms and Ranches at a Glance” report; search ers.usda.gov for the newest edition rather than assuming 2023 is still the latest survey round.
- Farmer AI-trust survey — MorganMyers has run this as an annual report; check for a newer year’s release before citing the 75%/48%/83% figures above.
- See & Spray season results — Deere publishes an acreage and savings recap after each growing season closes; the 2025 recap was published in November 2025, so check deere.com’s newsroom each autumn for the next one.
- Market-size forecasts — precision-agriculture market reports are republished annually by multiple research firms, and the topline number moves each time; treat any single figure as one firm’s estimate, not a consensus.
- Satellite imagery specs — NASS documents the Cropland Data Layer’s resolution and release date on the same FAQ page cited above, updated with each annual release.
FAQ: AI and Agriculture in the United States
Q: What’s the difference between “AI in agriculture” and “precision agriculture”?
A: Precision agriculture is the broader practice of managing fields at a finer resolution than “the whole farm” — it includes simple GPS guidance as well as AI. AI in agriculture specifically means systems that learn from data, such as image recognition for weeds or predictive yield models, rather than systems that just record or display it.
Q: Is AI adoption in agriculture actually growing in the US?
A: Yes, on both measures above: ERS’s ARMS data shows hardware-based precision-ag adoption rising with each survey round, and MorganMyers’ 2026 survey found 75% of farmers and ranchers had already tried a general AI tool, with 48% of that group using it weekly.
Q: Do I need a large farm to use AI-based tools?
A: No, but adoption has historically tracked farm size closely — ERS found small farms at 13% adoption of yield/soil mapping versus 68% for large-scale operations, largely because hardware and per-acre technology fees are easier to amortize over more acres. Software-only tools such as satellite monitoring and chat-based advisory don’t carry the same acreage minimum.
Q: Where can I see real examples of AI-in-agriculture imagery?
A: USDA NASS’s Cropland Data Layer and Farmonaut’s own satellite crop-health dashboards are both built from the same underlying Landsat/Sentinel-2 NDVI data described above — that is what the technology actually produces, as distinct from illustrative stock photos.
Explore Farmonaut’s API: Satellite & Weather API
API Documentation: Developer Docs

 Elders
 Agritein
 Delicio
 Payagri
 WB Dev
 Sama Premium
 Prochecker
 Tres Valles
 LACOS Geoinformation
 Magrifly
 LatConnect 60
 WebsEdge
 Blickwinkel
 Agricultural Credit Policy Council
 Marei Nursery
 eKGIS
eKGIS Mostas Tech
 Andex
Andex FCF India
