

Reviewed September 2026 against USDA NASS, USDA ERS, and University of Illinois farmdoc daily.
Try it: Run your own numbers →
Farming Productivity Solutions: Boost Yields With Real Data
Farming productivity solutions that work share three traits: they target a measurable input (nitrogen, water, labor hours), they use field-level data instead of averages, and they get checked against a real number every season. US corn growers averaged 179.3 bushels/acre in 2024 and soybean growers 50.7 bushels/acre, per USDA NASS. Below is what actually moves those numbers, what it costs, and how to verify the figures for your own operation.
Where Global and US Productivity Growth Actually Stands
Total factor productivity (TFP) — output per unit of combined land, labor, capital, and material input — is the standard yardstick for “agricultural productivity.” It is not a single published number you can quote for a given year; it is calculated from yield, input cost, and acreage data that different agencies release on different schedules. That is the honest starting point: any article claiming a single global TFP percentage without a source and a date is guessing.
What you can verify directly: US corn grain yield hit 179.3 bushels/acre in 2024, and soybean yield hit 50.7 bushels/acre, both from USDA NASS’s Crop Production Annual Summary. These are updated every year, and 2025 figures are already rolling in through USDA NASS Crop Production reports and via QuickStats during the growing season — check there for the current figure before citing last year’s.
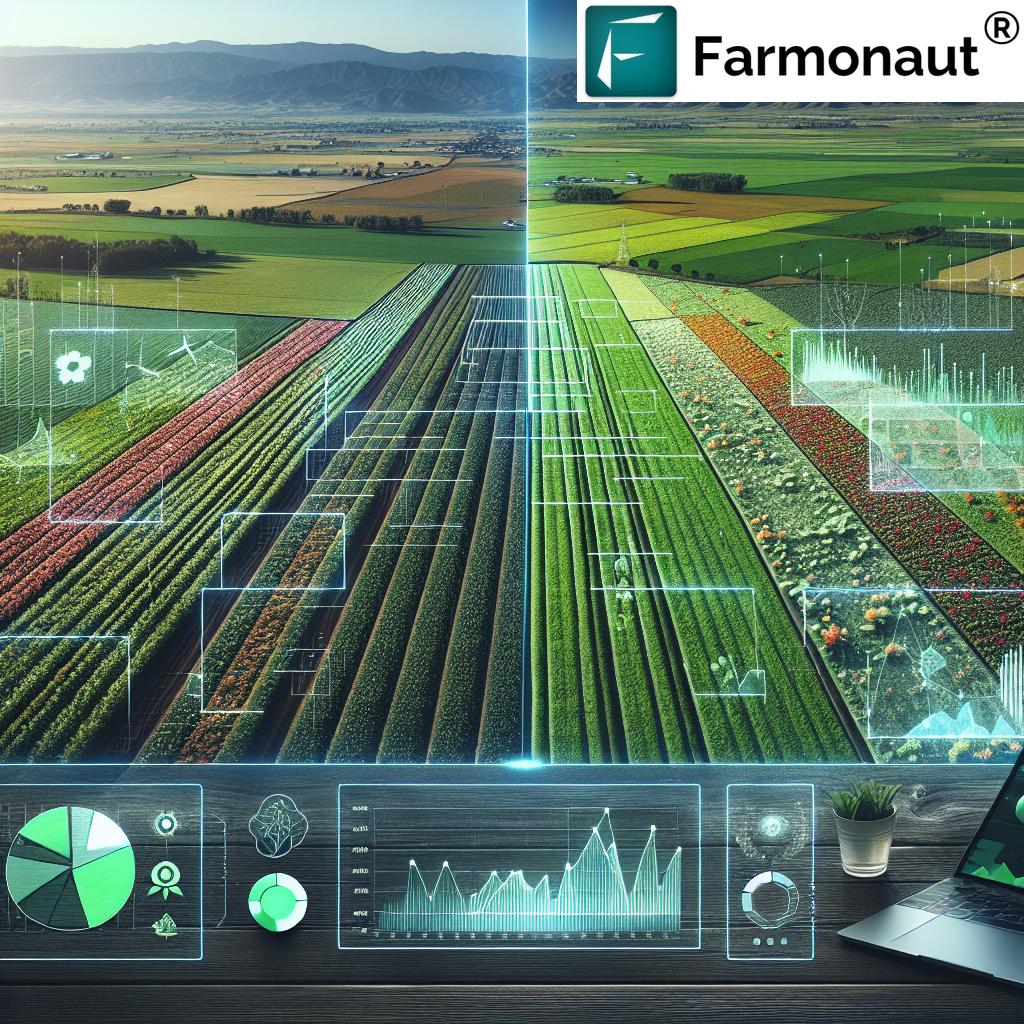
Productivity growth is not even across regions. Soil degradation, shrinking arable land, and water constraints hit hardest where irrigation infrastructure and machinery access lag. That gap is exactly where satellite monitoring and targeted input use return the most value per dollar spent, because a small data-driven correction has more room to help.
How to Increase Agricultural Productivity: What Actually Works
“How to increase agricultural productivity” breaks into three levers that respond to data: input efficiency, technology adoption, and timing. Here is what the evidence shows for each.
1. Precision Agriculture Adoption
27% of US farms used some form of precision agriculture technology in 2023, according to USDA ERS. Adoption is far higher among large-scale crop operations: 70% of large-scale crop farms used guidance/autosteering systems in 2023. That gap between the 27% average and the 70% large-farm rate is the single biggest opportunity most mid-size and smaller operations are leaving on the table — the technology is proven at scale, adoption on smaller acreage is what is lagging.
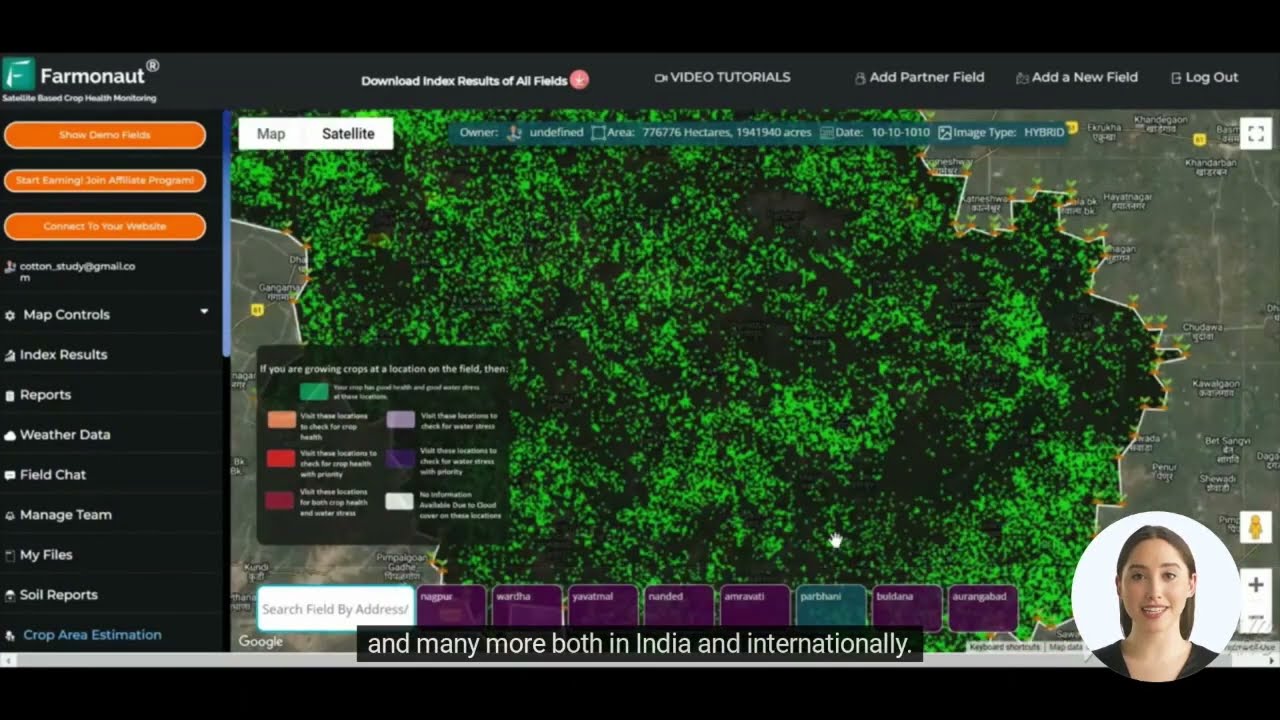
Farmonaut’s satellite-based crop monitoring puts the same class of data — NDVI vegetation health, soil moisture, field-level variability — into an app rather than a $40,000+ guidance system, available on Android, iOS, web, and via API. That is the accessibility gap precision ag needs closed for farms below the large-scale threshold.

2. Fertilizer Efficiency, Not Just Fertilizer Volume
Nitrogen use is the clearest example of a productivity lever with a hard number attached. Corn growers applied 151.8 lbs of nitrogen per acre in 2024, working out to 0.85 lbs of nitrogen per bushel of corn produced, per farmdoc daily (University of Illinois). Wheat growers applied 77.15 lbs/acre the same year. Fertilizer overall cost US crop farms $162/acre in 2025 (USDA ERS), and chemicals/herbicides added another $53/acre (Texas A&M AgriLife).
The 0.85 lbs-per-bushel figure is the number to track on your own operation: if your nitrogen-per-bushel ratio is running above that, you are either over-applying or losing yield to something else (moisture stress, pest pressure, soil compaction) that better-targeted nitrogen won’t fix on its own. Satellite NDVI monitoring and soil moisture data let you separate those two causes before you spend on more fertilizer. farmdoc daily publishes this fertilizer efficiency analysis annually each May, using the prior year’s USDA data — that is your refresh point for a current ratio.
3. Input Cost Control
Combined US crop inputs — fertilizer, chemicals, and seed — totaled $72.2 billion in 2024, per USDA NASS. At $162/acre for fertilizer and $53/acre for chemicals alone, that is $215/acre in just those two categories before seed, fuel, or labor. Targeted application — applying inputs only where field data shows they are needed, rather than a flat rate across the whole field — is the direct lever against that $215/acre baseline.
Ways to Increase Agricultural Productivity by Category
| Lever | What It Targets | Verified Figure | Source | Farmonaut Tool |
|---|---|---|---|---|
| Precision ag adoption | Input timing and placement | 27% of US farms (2023); 70% of large-scale crop farms | USDA ERS | Satellite crop health monitoring |
| Nitrogen efficiency | Fertilizer-to-yield ratio | 0.85 lbs N per bushel corn (2024) | farmdoc daily | NDVI + soil moisture data |
| Irrigation timing | Water use efficiency | Not published at national scale — see gap note below | Regional studies only | Soil moisture monitoring |
| Machinery/fleet management | Labor and fuel cost per acre | No disaggregated USDA figure by farm size | USDA NASS (aggregate only) | Fleet and resource management |
| Advisory/decision support | Timing of planting, spraying, harvest | N/A — outcome-dependent | — | Jeevn AI Advisory |
Two rows in that table say “not published” honestly rather than filling in a plausible-sounding number. Soil organic matter and water productivity trends have no national-scale dataset; what exists are regional university and extension studies specific to a state or watershed — search your state’s land-grant extension service (e.g., a state agricultural experiment station) for local figures rather than a national average that does not exist. Cost-per-acre broken out by farm size similarly is not something USDA publishes at the commodity level; NASS reports acres and yields aggregated across all farm sizes, not split small vs. large.
Agricultural Climate Solutions: Adapting to Volatile Conditions
Climate volatility — shifting rainfall timing, heat stress during pollination, more frequent extreme-weather events — is now a routine input into crop planning rather than a rare shock. Agricultural climate solutions that hold up are the ones that shorten the gap between a field condition changing and a farmer knowing about it:
- Real-time satellite monitoring flags moisture stress or vegetation decline before it is visible from the road
- AI-driven advisories translate weather forecasts into specific actions (delay planting, adjust irrigation, apply fungicide) instead of general warnings
- Precision-targeted inputs reduce the fertilizer and water applied per unit of yield, which lowers both cost and the environmental exposure of the operation
Farmonaut’s Jeevn AI Advisory System delivers this as real-time insight paired with weather forecasts and specific crop management recommendations, rather than a generic seven-day forecast.

Farm Productivity Optimization: The Farmonaut Toolset
Crop yield optimization depends on catching problems at the field-zone level, not the whole-farm level. Farmonaut’s suite:
- Satellite-Based Crop Health Monitoring: multispectral imagery for vegetation health (NDVI), soil moisture, and zone-level variability.
- Jeevn AI Advisory System: real-time crop management guidance tied to weather forecasts.
- Blockchain-Based Product Traceability: supply-chain transparency from field to buyer.
- Fleet and Resource Management: tracks utilization of agricultural machinery to cut idle time and fuel cost.
- Carbon Footprinting: quantifies and tracks emissions for agribusinesses reporting on environmental impact.

These tools apply the same logic smaller operations need: know the field condition before you spend on an input, and confirm the spend worked afterward with the next satellite pass.
Increased Productivity for Farmers: A Verification Method That Doesn’t Expire
Numbers in this article will age. Here is a method that will not, so you can check your own productivity trend every season without waiting for someone to rewrite an article:
- Pull your yield. Compare your farm’s bushels/acre (or your crop’s equivalent unit) against USDA NASS’s current Crop Production report for your state and crop — available via USDA NASS or QuickStats.
- Calculate your input ratio. Divide your nitrogen (or other key input) applied per acre by your yield per acre. Compare that to the current national ratio published in farmdoc daily’s annual fertilizer trend analysis.
- Check your cost per acre. Compare your fertilizer and chemical spend per acre against USDA ERS’s current cost-of-production charts, updated via USDA ERS Charts of Note.
- Flag the gap. If your input-per-yield ratio is above the national figure and your yield is not above the national average to match, that gap is your target for precision-ag intervention — not a bigger input budget next season.
This four-step check works whether nitrogen costs $0.30/lb or $0.60/lb next year, and whether national corn yield lands at 175 or 195 bushels/acre — because it is a ratio against a live source, not a number frozen at publication.
Improve Agricultural Production: Closing the Developed–Developing Gap
Developed regions with mature machinery infrastructure and dense extension networks generally post faster productivity gains than regions still building that infrastructure. Farmonaut’s role in narrowing that gap:
- Satellite monitoring delivered through a mobile app needs no on-farm sensor hardware, cutting the entry cost for precision agriculture
- The interface works on standard smartphones, which matters where broadband and desktop access are limited
- AI advisories substitute for in-person agronomist visits where extension staff are scarce
For US, Canadian, and European operations already running John Deere or Trimble guidance systems at the 70% large-farm adoption rate cited above, satellite crop health data is a complement — it catches within-field variability that autosteering alone does not address, since guidance manages machinery path, not plant stress.
Sustainable Farming Practices That Support Long-Term Yield
Productivity and sustainability are the same problem viewed on different timeframes. Practices that hold soil and water capacity intact are what keep next decade’s yield curve from bending downward:
- Efficient resource management — applying nitrogen closer to the 0.85 lbs/bushel benchmark rather than well above it — cuts both cost and nitrogen runoff
- Carbon footprint tracking gives agribusinesses a documented trail for buyers and regulators asking about emissions
- Precision techniques that avoid blanket tillage and blanket input application preserve soil structure across seasons
These overlap directly with regenerative farming practices, and with the resource-management principles covered in sustainable resource management for agriculture.
Where This Is Headed
The direction of travel, not tied to a single year: more farms closing the gap between the 27% average and 70% large-farm precision-ag adoption rate as hardware and software costs fall; tighter fertilizer-to-yield ratios as more operations track the farmdoc daily benchmark instead of applying a flat rate; and continued growth in satellite-based advisory tools reaching operations that cannot justify a full guidance-system capital purchase. Crop-specific innovation cycles, like those in rice production, follow the same pattern: adoption spreads from large operations down once cost per acre drops.

Nitrogen Efficiency Calculator
Check your own nitrogen-per-bushel ratio against the 2024 US corn benchmark (0.85 lbs N per bushel, farmdoc daily) using your actual field numbers below.
Run your own numbers
Assumes nitrogen and yield figures you enter are accurate for the field in question. Excludes other nutrients (phosphorus, potassium), split-application timing effects, and soil-type variation. The 0.85 lbs/bushel benchmark is a 2024 US national average for corn (farmdoc daily) — your crop, region, or soil type may have a different efficient ratio.
Access Farmonaut’s Tools
Web App: 
Android App: 
iOS App: 
API Access: Developers integrating Farmonaut’s tools into other applications: API and API Developer Docs.
Farmonaut Subscriptions
FAQ
Q: What is the fastest way to increase agricultural productivity on an existing operation?
A: Start with your nitrogen-to-yield ratio. The 2024 US benchmark is 0.85 lbs of nitrogen per bushel of corn produced (farmdoc daily). If your ratio is above that and your yield isn’t correspondingly higher than the 179.3 bushels/acre national average (USDA NASS, 2024), targeted input reduction — guided by field-level moisture and vegetation data — is the highest-return fix before spending on new inputs.
Q: How much does precision agriculture actually get used in the United States?
A: 27% of US farms used some precision agriculture technology in 2023; among large-scale crop farms specifically, 70% used guidance/autosteering systems (USDA ERS). The gap between those two figures is where mid-size and smaller operations have the most unclaimed opportunity.
Q: What do US crop farms spend on fertilizer and chemicals per acre?
A: $162/acre for fertilizer and $53/acre for chemicals and herbicides in 2025, per USDA ERS and Texas A&M AgriLife. Combined crop inputs (fertilizer, chemicals, seed) totaled $72.2 billion nationally in 2024 (USDA NASS).
Q: Is there a single global number for “agricultural productivity growth”?
A: Not one you can cite reliably without a specific source and year — total factor productivity is calculated differently by agency and revised on different schedules. For a US-specific, verifiable figure, use USDA NASS yield data and USDA ERS input-cost data directly rather than a secondhand aggregate.
Q: How does Farmonaut fit into farm productivity optimization?
A: It provides satellite-based crop health monitoring (NDVI, soil moisture), an AI advisory system for real-time management decisions, fleet/machinery tracking, and carbon footprint tracking — aimed at the same input-efficiency and timing problems the USDA figures above quantify, at a lower entry cost than a full guidance-system hardware purchase.

 Sampurn AgriConnect
 FCF India
 Unifrutti Gulf
 Deluxe Conseil
 TVS Electronics
 BW Pipelines
 WICO
WICO Gen Chayat
 Chimera Innovation
 SkyHarvest
 Polaris Digitech
 Teledarbas
 Wild Oak Farm
 SFX
SFX Doodlakine
