

Farm technology · Evidence guide
How Does Machine Learning Optimize Farming? 7 Uses Checked
Machine learning finds patterns in field data, then predicts yield, spots weeds or disease, and times water and inputs. In an Iowa State test on five soybean fields, camera-guided spraying saved 43.9% to 90.6% of post-emergence herbicide. Here is the evidence for seven uses, and where each falls short.
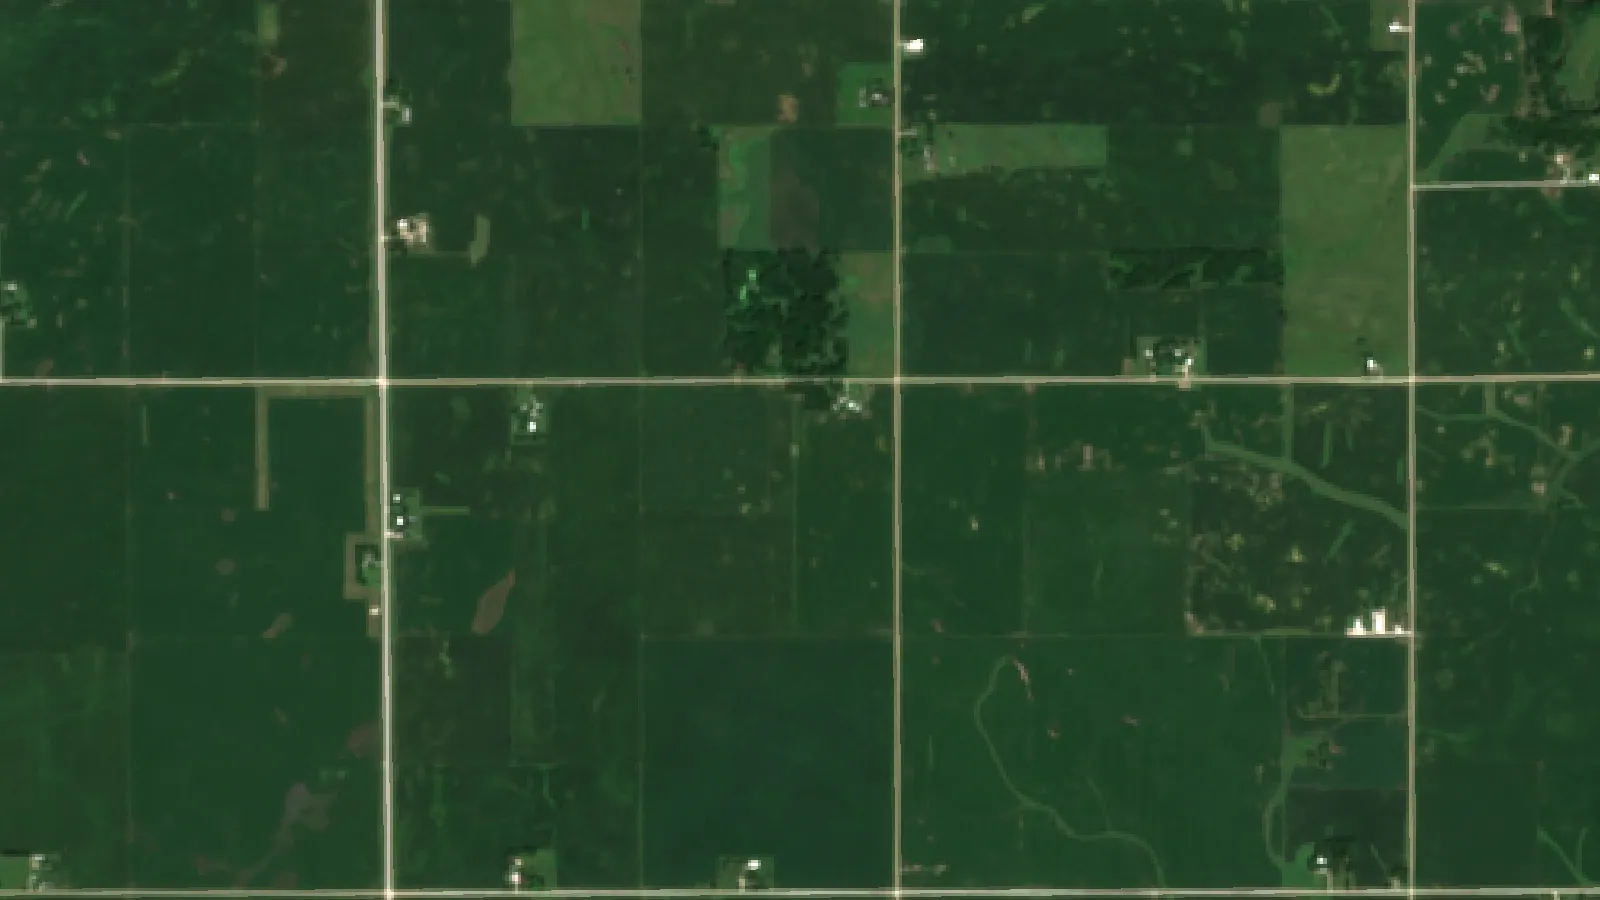
Key takeaways
- Iowa State measured post-emergence post-emergence post-emergence herbicide savings of 43.9% to 90.6% per field on five soybean fields (2024); weed pressure drove the gap.
- Yield model errors ran from 6% to 14% of average yield in a 2016 PLOS ONE test, and about 12% for a corn hybrid model (2019).
- A disease model scoring 99.35% on similar images fell to about 31% on images from other sources (Frontiers in Plant Science, 2016).
- 22% of US farms reported precision practices in 2025, down from 27% in 2023 (USDA NASS).
- Net return gains from older precision tools on US corn farms were 1.1% to 1.8% (USDA ERS report, 2010 data).
In this article
- How does machine learning optimize farming?
- Seven jobs machine learning does on a farm
- 1. Finding crop disease and stress early
- 2. Spraying weeds instead of whole fields
- 3. Forecasting yield before harvest
- 4. Timing irrigation and water
- 5. Self-driving tractors and field machines
- 6. Watching livestock health
- 7. Reading fields from satellites
- How many farms use these tools
- Does machine learning raise yield and profit?
- Limits to check before you buy
- How to start using machine learning on your farm
- FAQ
Machine learning optimizes farming by finding patterns in field data, then using them to predict yield, spot weeds or disease, and time water and inputs. In an Iowa State University demonstration on five soybean fields, a camera-guided sprayer saved 43.9% to 90.6% of the herbicide in a post-emergence pass, per field. Results depend on the field: that gap came from weed pressure.
This guide answers how machine learning optimizes farming, one job at a time, with what each use has shown so far and where it falls short. It also gives you a calculator to test whether targeted spraying pays on your own acres. If you want a list of tools instead, see our guide to AI for agriculture apps.
How does machine learning optimize farming?
A normal computer program follows rules that a person wrote. A machine learning model works the other way. It is shown many past examples, such as field photos with weeds marked or county weather paired with final yields, and it learns the link between them. It can then make a guess on new data it has not seen.
On a farm, that loop has four steps. Data comes in from yield monitors, soil tests, weather stations, cameras or satellites. A model turns that data into a prediction or a map. A person or a machine acts on it. Then the season’s result becomes new training data.
A review of machine learning in agricultural production, published in Sensors in 2018, sorted the research into four areas: crops, livestock, water and soil. Of the 40 papers it studied, 24 dealt with crop management, 8 with livestock, 4 with water and 4 with soil. That balance is a useful warning. A research paper shows that a method can work. It does not show that a product will work on your land.
Seven jobs machine learning does on a farm
The table sums up each job, then the sections below give the evidence. The final column is the question to ask before you pay for anything.
| Job | Data it learns from | What the evidence shows | Ask before buying |
|---|---|---|---|
| Disease spotting | Leaf and canopy images | 99.35% on similar images, about 31% on images from elsewhere (Mohanty, 2016) | Was it tested on my crop and in my region? |
| Weed spraying | Live camera images | 43.9% to 90.6% of post-emergence herbicide saved on five Iowa fields (Iowa State, 2024) | What weed pressure do my fields carry? |
| Yield forecasts | Weather, soil, genetics, past yields | Error of 6% to 14% of average yield in one multi-crop test (Jeong, 2016) | How far ahead, and at what scale? |
| Irrigation timing | Soil, weather, satellite images | Less water prescribed in one of two Nebraska years, no yield change (2019 paper) | Does it cut water use or only pumping? |
| Self-driving machines | Camera and GPS data | Retrofit kits announced for tractors and tillage tools (AgWeb) | Which tasks, and who supervises? |
| Livestock checks | Tags, sensors, milking robots | 8 of 40 papers in a 2018 review | How many false alarms will I get? |
| Field monitoring | Satellite bands at 10 to 60 m | 5-day revisit at the equator (Copernicus) | Are my fields large enough to see clearly? |
1. Finding crop disease and stress early
Image models called convolutional neural networks learn what a sick leaf looks like: spots, lesions and color change. A well-known 2016 study in Frontiers in Plant Science trained one on leaf photos covering 14 crops and 26 diseases. It scored 99.35% on held-back test images.
The same paper holds the more useful lesson. When the best model was tried on images taken from other sources, its accuracy fell to about 31%. That is still far better than a blind guess among 38 labels, but it would not be good enough to base a spray decision on. A model does well on photos like the ones it trained on, and much worse under different conditions, such as new light and backgrounds.
So treat a phone app’s diagnosis as a prompt to go and look. Satellite maps have a similar limit at field scale: they show where plants have changed, not what caused it. Someone still needs to walk that part of the field. Best for: deciding where to scout first. Check: whether the tool was tested on your crop under field conditions.
Chart
One disease model, two kinds of test image
Percent of images labeled correctly among 38 crop and disease classes
2. Spraying weeds instead of whole fields
Targeted spraying has one of the more direct field results in this guide. Cameras on the boom scan the ground, a model separates weed from crop, and each nozzle fires when it sees a target. Iowa State University ran a commercial system on five conventionally managed soybean fields, 415 acres in all, and reported the savings per field shown below.
Chart
Herbicide saved per field with precision spraying
Post-emergence pass, five conventionally managed soybean fields, 415 acres in total, Iowa
Those fields were all in one state and one crop, so they are a demonstration and not a forecast. Iowa State ties the savings to initial weed pressure. A clean field saves a lot of product, and a weedy one saves far less, so your own weed maps matter more than the headline number.
Savings also need to beat the cost of the system. Enter your own figures in the calculator to see the savings rate you would need. Always follow the product label and local rules, and ask your adviser or the manufacturer whether a product and rate are approved for spot application. Best for: post-emergence herbicide passes on fields with patchy weeds.
Try the numbers for your own farm below.
Calculator
Would targeted spraying pay on your acres?
Enter your own acres, herbicide bill, expected savings and system cost.
- Herbicide saved per acre (US$): $8
- Break-even savings rate: 23.3 %
Example values only, chosen near break-even; they are not a benchmark or a forecast. Use today’s herbicide price and a written quote. The formula counts herbicide savings against system cost per acre and leaves out any yield change, labor or machinery time.
3. Forecasting yield before harvest
Yield models learn from past seasons: weather, soil, management, and sometimes genetics. Better forecasts help with grain marketing, storage and crop insurance paperwork, though they do not raise yield by themselves.
Two studies give a sense of the size of the error. In a 2016 PLOS ONE test across wheat, maize and potato, a random forest model had errors of 6% to 14% of average observed yield, against 14% to 49% for standard multiple linear regression. A 2019 corn hybrid study from a Syngenta crop challenge compared four model types on the same data. Its deep neural network reached a validation error of 12.79 bushels per acre with actual weather data, about 11% of average yield, and 13.94 bushels, about 12%, with predicted weather.
As an illustration, a 12% error on a 180-bushel crop would be about 22 bushels. That is useful for planning across many fields, yet too wide to judge one input on one field. Best for: farm-wide and regional planning. Check: how far before harvest the stated accuracy applies, since a late-season forecast has already seen most of the weather.
Chart
Corn hybrid yield error by model type
Validation root-mean-square error, bushels per acre, with actual weather data; lower is better
4. Timing irrigation and water
Irrigation models combine soil, weather and crop data to estimate how much water the crop has used. A field trial shows what to expect, and what not to. A study of variable rate irrigation on maize and soybean in west-central Nebraska, which used a spatial evapotranspiration model rather than machine learning as such, compared variable and uniform watering.
The field grew maize in 2017 and soybean in 2018. In 2018, the variable approach prescribed less gross irrigation in both the full and deficit treatments; 2017 showed no significant difference. Grain yield did not differ significantly in either year. The authors also did not detect a fall in deep percolation or actual water use from the crop. Pumping less does not always mean the basin has more water, as water that seeps past the roots can recharge the aquifer.
This points to a fair way of judging any smart irrigation claim. Lower pumping may save energy and money, and that can be worth having. Ask for it to be measured against your own past records, and check local water rules before changing an allocation plan. Best for: pivots where you can compare results against past pumping records.
Chart
Water prescribed: variable vs uniform irrigation
Mean prescribed gross irrigation, mm, one soybean field, west-central Nebraska, 2018
5. Self-driving tractors and field machines
Older guidance follows GPS lines. Newer autonomous farming machines add cameras and models that read what is in front of them. AgWeb reported in January 2025 that John Deere had announced retrofit autonomy kits for tractors, tillage implements and orchard sprayers, with a stated goal of a fully autonomous production system by 2030. That is a company target, not a result.
Labor is one reason for interest. USDA’s Economic Research Service reports that, in the 2022 Census of Agriculture, wages and contract labor made up 42% of production expenses for greenhouse and nursery operations and 40% for fruit and tree nut farms. Those are the sectors where labor savings would count for the most, though many of their tasks remain hard to automate.
Guidance itself is already common on larger farms. It is the building block that the chart below shows far ahead of other tools on corn ground. Best for: repeat tasks on large, well-mapped fields. Check: local rules on unattended machines, your insurance, and who responds when a machine stops.

▶ How precision technology, satellites, AI and drones are being used to grow food. · 13:27
6. Watching livestock health
Models can read data from ear tags, collars, cameras and milking robots, then flag an animal whose eating, movement or milk has changed. USDA counts electronic tagging, precision feeding and robotic milking as precision practices in its farm survey, so this is already part of how the sector is measured.
The research base is smaller than for crops: 8 of the 40 papers in the Sensors review covered livestock. Before buying, ask how many alerts the system sends per week for a herd of your size, and how many of those turned out to be real problems. Too many false alarms and staff stop checking them. An alert does not replace your vet. Best for: herds too large for a daily close look at every animal.
7. Reading fields from satellites
Satellites give a low-effort way to get repeated field data with no hardware on the farm. The European Sentinel-2 mission carries a 13-band sensor with four bands at 10 m resolution and is designed for a 5-day revisit at the equator. Clouds can block a pass, so real gaps may be longer.
Models turn those bands into vegetation maps that show where a crop is ahead of or behind the rest of the field. Farmonaut is one provider of such maps. They work best as a guide on where to look. A 10 m pixel suits a field of several acres far better than a single row or plant. The same imagery helps with climate planning too, as several seasons of maps can show which zones of a field suffer first in a dry spell.
Forest managers use similar imagery. For that side of the subject, see our notes on AI in forestry and sustainable forest management. Best for: larger fields and farms with many scattered blocks.

▶ A step-by-step tutorial on monitoring crops with satellite imagery and crop health indices in the Farmonaut web system. · 8:43
How many farms use these tools
Uptake is uneven. In the USDA technology use survey of August 2025, 22% of US farms said they used precision agriculture practices to manage crops or livestock, down from 27% in 2023. The same survey found 85% of farms had internet access. These figures count farms, large and small, so they understate the share of acres.
The acre picture looks different. The USDA report on precision agriculture in the digital era shows corn in 2016 as a heavy user of guidance and yield maps, with far less use of soil maps and imagery. The survey data are several years old, and they measure older tools that collect the data models need, rather than machine learning itself.
Chart
Precision tools on US corn acres
Percent of planted corn acres, 2016
Does machine learning raise yield and profit?
Be careful with big percentages. The evidence on the older precision tools, which has had the longest study, points to modest gains. The USDA report cites work on 2010 survey data from US corn farms that found net returns rose 1.8% with soil and yield mapping, 1.5% with guidance systems and 1.1% with variable rate technology.
USDA also shows that corn yields in 2016 averaged 183 bushels per acre for yield map adopters and 139 for nonadopters. It warns that such gaps are correlations and not causal effects, because they do not control for weather, soil and other inputs. USDA also finds higher adoption on larger farms, so the tool may not be the only reason for the difference.
No single yield gain applies to “AI” as a whole. Judge each use on its own measured result, on your own farm, against a check strip.
Limits to check before you buy
- Training data: a model trained elsewhere may fail on your crop, soil type or climate. Ask where it was trained.
- Farm size: USDA finds that at least half of relatively large row crop farms use yield maps, soil maps, variable rate or guidance tools, while under 25% of the smallest farms do (cotton aside). Fixed costs are harder to spread over few acres.
- Connectivity: some tools need a signal in the field. Ask what still works offline.
- Data ownership: read who owns and can share your data. In the US, Ag Data Transparent certifies companies against farm data privacy principles, and Australia has the Australian Farm Data Code.
- Skills: someone must calibrate equipment, check maps and overrule the model when it is wrong.
How to start using machine learning on your farm
- Pick one costly problem. Herbicide bills, uneven pivots and late disease finds are good candidates. Do not start from the technology.
- Collect your baseline. Save yield maps, input records and scouting notes for at least a season, if you do not have them already.
- Run a check strip. Compare treated and untreated parts of the same field. Keep it simple enough to repeat.
- Get the numbers in writing. Ask the vendor for trial data from your crop and region, along with all costs per acre.
- Review at season end. Keep the tool if your own numbers justify it. Talk to your agronomist or adviser before making large spending decisions.
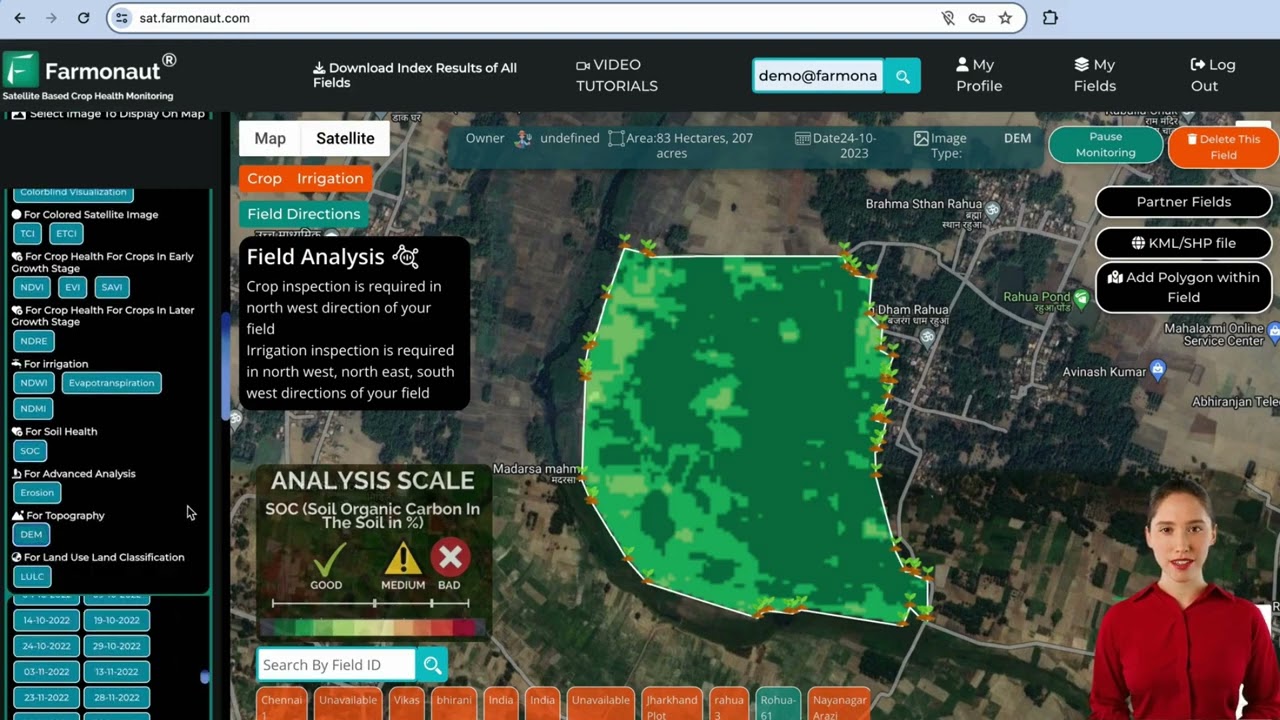
▶ A tutorial for the Farmonaut web app for satellite monitoring of fields. · 8:02
FAQ
What is machine learning in agriculture?
It is software that learns patterns from farm data rather than following fixed rules. Common uses include yield prediction, weed and disease detection, and livestock monitoring. Computer vision and predictive analytics are both built on it.
How does AI help agriculture on a working farm?
It narrows down where to look and where to act. Examples include sprayers that treat weeds and skip clean ground, maps that show which part of a field to scout, and forecasts that help with marketing and storage plans.
How accurate is machine learning for crop yield prediction?
In the studies cited here, errors were 6% to 14% of average yield with random forests, and about 12% with a deep neural network on corn hybrids. Accuracy depends on the crop, the scale and how late in the season the forecast is made.
Is machine learning worth it for a small farm?
It depends on the cost per acre. Tools with fixed hardware costs are harder to justify on few acres, and USDA finds lower adoption among small farms. Subscription tools with no hardware are a lower-risk way to test the idea. Use the calculator to run your own figures.
Will machine learning replace agronomists?
The evidence here does not suggest that. Models can flag a problem area, but satellite maps do not name the cause and image models lose accuracy on unfamiliar images. Someone still needs to confirm the problem and decide what to do.
Who owns the data from farm AI tools?
It depends on the contract, so read it before you sign up. Look for clear terms on ownership, sharing and deletion. Industry codes in the US and Australia give you a list of questions to ask.
Related pages on our site: satellite vegetation maps, satellite data API, API developer documents, farm vehicle tracking, large-scale farm management, crop loan and insurance checks, product traceability, carbon footprint tracking and sustainable and organic produce.
Farmonaut crop monitoring
See your own fields from space
Outline your fields once and Farmonaut shows satellite vegetation maps for them through the season, on web, Android or iOS.




Keep reading
Sources
- USDA ERS, Precision Agriculture in the Digital Era: Recent Adoption on U.S. Farms, EIB-248 (2023): ers.usda.gov
- USDA NASS, Technology Use (Farm Computer Usage and Ownership), August 2025: esmis.nal.usda.gov
- Liakos et al., Machine Learning in Agriculture: A Review, Sensors (2018): pmc.ncbi.nlm.nih.gov
- Mohanty, Hughes and Salathe, Using Deep Learning for Image-Based Plant Disease Detection, Frontiers in Plant Science (2016): frontiersin.org
- Khaki and Wang, Crop Yield Prediction Using Deep Neural Networks, Frontiers in Plant Science (2019): frontiersin.org
- Jeong et al., Random Forests for Global and Regional Crop Yield Predictions, PLOS ONE (2016): journals.plos.org
- Iowa State University Extension, Precision Spraying Technology (2024): crops.extension.iastate.edu
- Variable Rate Irrigation of Maize and Soybean in West-Central Nebraska Under Full and Deficit Irrigation (PMC): pmc.ncbi.nlm.nih.gov
- USDA ERS, Farm Labor: ers.usda.gov
- Copernicus SentiWiki, Sentinel-2 mission: sentiwiki.copernicus.eu
- AgWeb, John Deere Introducing Next Generation Perception Autonomy Kits: agweb.com
- Ag Data Transparent, Privacy and Security Principles for Farm Data: agdatatransparent.com
- National Farmers’ Federation, Australian Farm Data Code: nff.org.au
Discussion
Questions, corrections or field experience? Share them below. First-time comments are reviewed before they appear, and your email is never published.
No comments yet. Be the first to add a question or your experience.

 CU Foods
 BeyondTech Global
 Consulthink Global
 Rouge VC
 Yutz Automation
 AgroGreen Dynamics
 AgroRisk
 Oath Inc
 Reddane Farming
 Esri North East Africa
 Cresol
 Atur Kuliner
 MDCV UK
 Zerella Group
 Etech Consulting Madagascar
 Vestlandsforsking
 Delicio
 WB Dev
 Sama Premium
 Prochecker
 Tres Valles
 LACOS Geoinformation
 Magrifly
 LatConnect 60

 Exploration consultancy · South Africa · Gold
 Licence holder · Niger · Gold
 Client · Tanzania · Gold
 Client · Somalia · Gold
 Client & affiliate partner · Ghana · Gold










